

- Market Size (2026)
- USD 1.6 Bn
- Forecast (2036)
- USD 5.5 Bn
- CAGR (2026 to 2036)
- 13.2%
How big is Solar-Powered Asset Tracking Market in 2026?
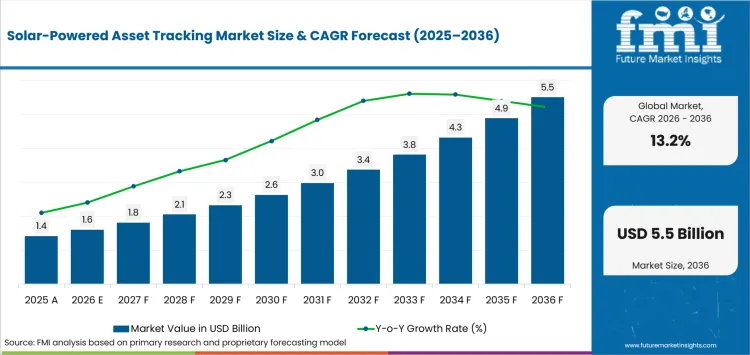
USD 1.6 billion in 2026 and USD 5.5 billion by 2036 at a 13.2% CAGR.
Solar-powered asset tracking demand is projected to rise at 13.2% CAGR, pushing valuation from USD 1.6 billion in 2026 to USD 5.5 billion by 2036. Trailers and mobile equipment often lack vehicle power, making routine battery service expensive across dispersed fleets. Globalstar reported in February 2025 that SmartOne Solar can operate for ten years, reducing telematics hardware service visits under a validated power budget.
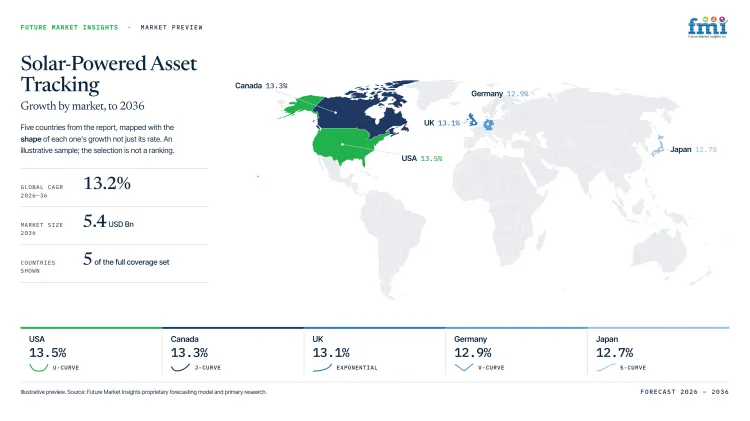
Canada is forecast at 13.3% CAGR versus Australia at 13.0% through 2036 as network reach and remote asset exposure shape deployment. The CRTC reported in October 2025 that mobile networks served 87% of major Canadian roads and highways during 2023. Cellular vehicle tracking systems fit covered Canadian routes, whereas remote Australian fleets require satellite fallback and careful installation planning.
Key Takeaways of Solar-Powered Asset Tracking Market
- Fleet operators need reliable location data from trailers and mobile equipment that lack continuous vehicle power.
- Portable solar-powered trackers are projected to represent 60.0% share in 2026 owing to flexible mounting across reassigned assets.
- 4G-LTE is estimated to account for 44.0% share in 2026 supported by familiar provisioning and lower-power cellular variants.
- Vehicle and fleet tracking is forecast to hold 34.0% in 2026 as operators monitor utilization and unauthorized movement.
- Shading and frequent reporting can exhaust reserve batteries faster than solar charging restores dependable field capacity.
- Geotab Inc., CalAmp Corp., Teletrac Navman, ORBCOMM Inc., Samsara Inc., Digital Matter, Queclink Wireless Solutions and Globalstar Inc. serve this market.
Analyst Perspective
"Solar tracking should be qualified against the asset’s parking pattern and reporting duty cycle conditions. Fleet operators protect deployment economics by testing reserve capacity and network fallback under the same conditions expected across the commercial fleet."
- Sudip saha, Principal Consultant for Industrial Automation, Future Market Insights
How is the Solar-Powered Asset Tracking Market segmented?
The solar-powered asset tracking market is segmented by product type, connectivity, application, end user, distribution channel and region.
Market taxonomy covers product type, connectivity, application, end user, distribution channel and region. Product types are portable and fixed trackers. Connectivity includes 4G-LTE, LTE-M, NB-IoT, legacy cellular and satellite options. Applications cover vehicles, vessels, machinery and logistics assets. End users span transportation, construction, energy and agriculture. Channels include direct sales, integrators, distributors and online platforms.
How does vehicle and fleet tracking shape application demand?
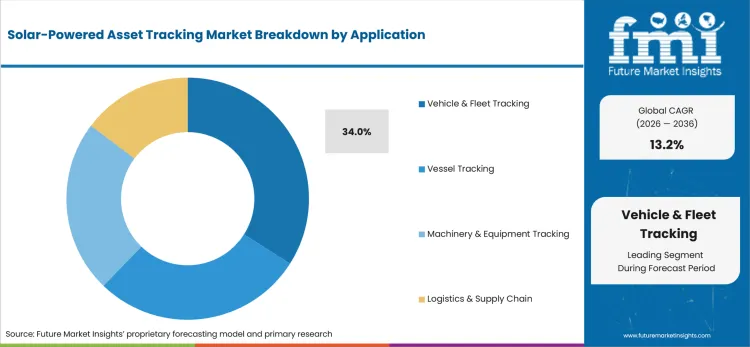
Fleet operators use location histories to find idle trailers and connect movement with maintenance plus yard-control records inside integrated fleet management systems.
- In 2026, vehicle and fleet tracking is expected to lead application demand with 34.0% share because mixed fleets require recurring asset visibility.
- Geofences support yard control, but reporting policies must preserve reserve capacity during storage and theft events.
Why do portable solar-powered trackers lead the product type category?
Portable units serve trailers and mobile machinery without stable wiring points, and removable mounting supports trailer and cargo tracking across mixed fleets without permanent vehicle assignment.
- Based on product type, portable solar-powered trackers are projected to account for 60.0% in 2026 due to flexible installation across reassigned assets.
- Fleet operators transfer hardware without rewiring assets, although reserve performance during shaded parking and indoor storage remains a qualification requirement.
What supports demand for 4G-LTE within the connectivity category?
Long-life devices need radios that balance coverage with a controlled power budget, and 4G-LTE provides a migration route for legacy cellular trackers as carriers retire older 2G/3G networks.
- By connectivity, 4G-LTE is estimated to hold 44.0% in 2026 owing to broad module availability and established carrier provisioning.
- Low-power cellular profiles preserve reserve capacity, but contracts also require supported bands and satellite fallback beyond terrestrial coverage.
Why does transportation and logistics lead the end-user category?
Transportation operators manage dispersed assets whose location affects dispatch and cargo security, while solar devices extend commercial vehicle telematics to detachable trailers without permanent vehicle power.
- The end-user category is forecast to be led by transportation and logistics at 31.0% share in 2026 due to recurring trailer and container visibility requirements.
- Large fleets spread installation costs across more assets, while smaller carriers need simple provisioning and local support.
What are the drivers, restraints and opportunities in the Solar-Powered Asset Tracking Market?
Unpowered asset visibility supports demand, uneven solar exposure limits reporting continuity and hybrid connectivity extends coverage beyond cellular corridors.
- Driver: Solar charging reduces service visits across trailers and equipment that lack continuous host-vehicle power.
- Restraint: Shading and frequent reporting can limit how quickly assets regain full charge in the field.
- Opportunity: Hybrid cellular and satellite designs extend commercial monitoring across remote transport and industrial routes.
Lower Service Burden Supports Asset Visibility
Detachable assets make repeated battery service expensive across large fleets, while solar charging improves IoT asset tracking economics under validated exposure and reporting settings.
Field Conditions Challenge Power Budgets
Mounting angle and seasonal light reduce battery replenishment, so off-highway telematics programs need low-light autonomy tests across the actual parking and operating cycle.
Hybrid Connectivity Extends Remote Coverage
Hybrid connectivity keeps remote assets inside one operating platform and combines satellite IoT data with dispatch and maintenance records. Samsara introduced North American satellite connectivity in May 2025 with fifteen-minute updates outside cellular coverage.
Which country CAGRs are profiled in the Solar-Powered Asset Tracking Market?
| Country | CAGR |
|---|---|
| South Korea | 14.2% |
| United States | 13.5% |
| Canada | 13.3% |
| United Kingdom | 13.1% |
| Australia | 13.0% |
How do country-level CAGRs compare in the Solar-Powered Asset Tracking Market?
The displayed five-country range spans 1.2 percentage points between South Korea and Australia, reflecting network readiness and asset mix rather than present market size.
- South Korea reflects smart-logistics investment that increases the operating value of integrated location data across automated facilities.
- United States growth reflects extensive freight circulation across trailers and equipment serving large regional distribution networks.
- Canada follows closely as covered highways support cellular tracking across populated freight corridors and industrial routes.
- United Kingdom growth reflects device replacement as fleet operators migrate from retired 3G networks toward supported radios.
- Australia remains within the cluster because remote operations favor rugged hardware with validated satellite fallback options.
Comparable CAGRs can produce different market entry conditions. The full report provides country-level CAGR analysis across North America, Latin America, Europe, East Asia, South Asia and Pacific, and the Middle East and Africa.
Country-wise Analysis
- Automated fulfillment centers connect asset location with machine-directed storage and dispatch across logistics sites handling containers and mobile equipment. The Ministry of Land, Infrastructure and Transport designated an AI-based fulfillment system as Outstanding Logistics Technology in September 2025. In South Korea, demand is predicted to advance at 14.2% CAGR through 2036 despite indoor coverage and platform qualification work that can delay multi-site orders.
- National freight networks circulate trailers and mobile equipment among ports and regional distribution centers nationwide. The Bureau of Transportation Statistics reported in August 2026 that Freight Analysis Framework 6 covers every transport mode and 42 commodity types. By 2036, the United States is projected to grow at 13.5% CAGR despite network gaps and mounting differences that require fleet-specific validation.
- Canadian freight routes combine dense southern corridors with remote roads that complicate continuous cellular reporting. Innovation, Science and Economic Development Canada reported in May 2025 that its National Broadband Map displays availability across individual 250-meter road segments. Canada’s outlook is anticipated to advance at 13.3% CAGR over the assessment period, aided by corridor coverage but limited by satellite costs and distant service support.
- Fleet operators are replacing legacy trackers as national mobile networks withdraw 3G support from long-life equipment programs. Ofcom reported in May 2026 that every national mobile operator had completed its 3G shutdown. United Kingdom sales are forecast to expand at 13.1% CAGR by 2036, supported by replacement demand but constrained by remaining 2G deadlines and roaming terms.
- Mining and agriculture fleets place trackers across remote corridors that require rugged enclosures and validated communications coverage. ACMA introduced standardized 4G and 5G coverage maps in June 2026 and requires updates at least every three months. Australian adoption is estimated to expand at 13.0% CAGR through 2036, aided by remote asset demand but constrained by long service distances and satellite costs.
Who are the notable companies in the Solar-Powered Asset Tracking Market?
Geotab Inc., CalAmp Corp., Teletrac Navman, ORBCOMM Inc., Samsara Inc., Digital Matter, Queclink Wireless Solutions and Globalstar Inc. serve this market.
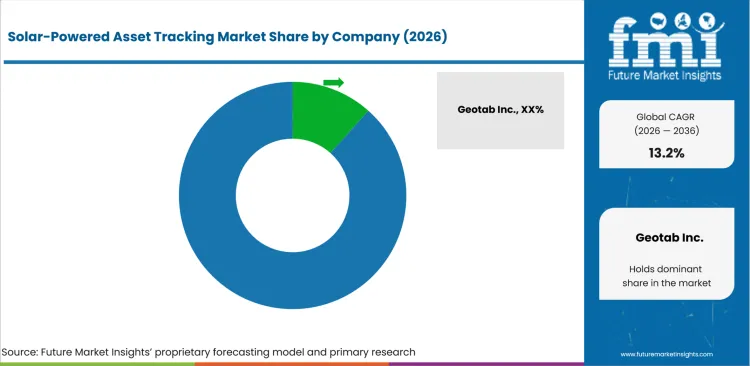
The field is fragmented across fleet platforms and tracking specialists plus satellite service providers worldwide. Entry depends on verified field life and supported connectivity with smart fleet management integration rather than company scale.
- Geotab Inc., Teletrac Navman and Samsara Inc. connect location data with dispatch and maintenance records.
- ORBCOMM Inc. and Globalstar Inc. pair autonomous tracking hardware with satellite coverage for remote assets.
- CalAmp Corp., Digital Matter and Queclink Wireless Solutions compete through configurable hardware and partner deployment channels.
Competitive Benchmarking: Solar-Powered Asset Tracking Market
| Company | Power and Device Breadth | Connectivity Breadth | Platform Integration Depth | Geographic Reach |
|---|---|---|---|---|
| Geotab Inc. | High | High | High | Global |
| CalAmp Corp. | Medium | Medium | High | Global |
| Teletrac Navman | Medium | Medium | High | North America, Europe and Oceania |
| ORBCOMM Inc. | High | High | High | Global |
| Samsara Inc. | Medium | High | High | North America and Europe |
| Digital Matter | High | High | Medium | Global |
| Queclink Wireless Solutions | High | High | Medium | Global |
| Globalstar Inc. | Medium | High | Medium | Americas, Europe and Asia-Pacific |
Key Developments in the Solar-Powered Asset Tracking Market
- In February 2026, Geotab Inc. launched GO Anywhere trackers with MyGeotab integration and optional Starlink Direct to Cell connectivity for trailers and equipment. North American availability begins in the second quarter of 2026, giving fleets one workflow for location and engine-hour records.
- In February 2025, ORBCOMM Inc. joined Geotab Marketplace Order Now and made CT 1000 plus solar-powered GT 1220 and GT 1230 devices directly available. The agreement combines purchasing with MyGeotab integration for trailer visibility and sensor support requirements.
- In January 2025, Teletrac Navman introduced indoor and outdoor asset trackers with ten-year battery life plus 4G recognition and 2G fallback. TN360 integration combines location with maintenance and utilization records across powered and unpowered equipment workflows.
Key Players in the Solar-Powered Asset Tracking Market
Integrated Fleet and Connected Operations Platforms
- Geotab Inc.
- Teletrac Navman
- Samsara Inc.
Asset Tracking Hardware Specialists
- CalAmp Corp.
- Digital Matter
- Queclink Wireless Solutions
Satellite and Hybrid Tracking Providers
- ORBCOMM Inc.
- Globalstar Inc.
Solar-Powered Asset Tracking Market - Report Scope
| Coverage field | Report scope |
|---|---|
| Market breakdown | By product type, connectivity, application, end user, distribution channel and region. |
| Quantitative Units | Revenue in USD billion and CAGR in %. |
| Market Definition | Solar-powered tracking hardware plus connectivity and platforms used to monitor mobile or fixed commercial assets. |
| Regions Covered | North America, Latin America, Europe, East Asia, South Asia and Pacific, and Middle East and Africa. |
| Countries Covered | South Korea, United States, Canada, United Kingdom, Australia, and 20+ countries included in the full report. |
| Key Companies Profiled | Geotab Inc., CalAmp Corp., Teletrac Navman, ORBCOMM Inc., Samsara Inc., Digital Matter, Queclink Wireless Solutions and Globalstar Inc. |
| Forecast Period | 2026 to 2036. |
| Approach | Primary and secondary research with market triangulation. |
Solar-Powered Asset Tracking Market - Research Methodology
| Method | Approach |
|---|---|
| Primary Research | FMI analysts gathered input from manufacturers, service providers, technology developers, distributors, end users, procurement teams, and subject-matter experts. Interviews examined purchasing decisions, product or service evaluation, adoption barriers, approval requirements, pricing considerations, and expectations for technical or commercial support. Respondents were also asked what evidence is required before a trial, pilot, or initial order develops into regular purchasing. |
| Desk Research | Desk research covered government statistics, regulatory publications, trade data, industry associations, technical literature, standards, company filings, product information, and official corporate announcements. Sources were reviewed for relevance, publication date, geographic coverage, and consistency with the defined market scope. Claims relating to performance, applications, approvals, capacity, investment, and commercial activity were retained only when supported by credible public evidence. |
| Market Sizing and Forecasting | The market model combined the baseline value with historical performance, segment structure, pricing and volume indicators, adoption levels, company participation, and country-level demand conditions. Forecast assumptions considered economic activity, investment trends, regulatory developments, technology adoption, purchasing cycles, supply availability, and barriers to wider market use. Segment and regional estimates were reconciled before the final market total was calculated. |
| Data Validation | Estimates were checked against multiple independent indicators, including public data, company activity, trade patterns, industry developments, and findings from primary interviews. Validation also tested whether products, services, applications, and company revenues fell within the defined market boundaries. Adjacent categories, unsupported claims, overlapping revenues, and activities without direct market relevance were excluded to reduce double counting and maintain consistency across segments and countries. |
Solar-Powered Asset Tracking Market by Segments
Solar-Powered Asset Tracking Market segmented by Product Type:
- Portable Solar-Powered Trackers
- Solar GPS Trackers
- Portable IoT Trackers
- Fixed Solar-Powered Trackers
- Solar-Powered Fleet Trackers
- Solar-Powered Industrial Trackers
Solar-Powered Asset Tracking Market segmented by Connectivity:
- 4G-LTE
- LTE-M
- NB-IoT
- 3G
- 3G Cellular Trackers
- 3G IoT Devices
- 2G
- GSM Trackers
- GPRS Trackers
- Satellite
- Low-Earth-Orbit Connectivity
- Satellite IoT Trackers
Solar-Powered Asset Tracking Market segmented by Application:
- Vehicle & Fleet Tracking
- Commercial Vehicles
- Fleet Management
- Vessel Tracking
- Marine Fleet Tracking
- Cargo & Container Tracking
- Machinery & Equipment Tracking
- Construction Equipment
- Agricultural Machinery
- Logistics & Supply Chain
- Freight Tracking
- Container Tracking
Solar-Powered Asset Tracking Market segmented by End User:
- Transportation & Logistics
- Fleet Operators
- Logistics Providers
- Construction & Mining
- Construction Companies
- Mining Operations
- Oil & Gas & Energy
- Oil & Gas Equipment
- Renewable Energy Assets
- Agriculture
- Farm Equipment
- Agricultural Fleets
Solar-Powered Asset Tracking Market segmented by Distribution Channel:
- Direct Sales
- Direct Enterprise Sales
- Long-Term Contracts
- System Integrators & Solution Providers
- IoT Solution Integrators
- Fleet Management Providers
- Distributors & Resellers
- Industrial Technology Distributors
- Telematics Distributors
- Online & E-Commerce
- B2B E-Commerce Platforms
- Direct Online Sales
Solar-Powered Asset Tracking Market by Region:
- North America
- United States
- Canada
- Mexico
- Latin America
- Brazil
- Chile
- Rest of Latin America
- Western Europe
- Germany
- United Kingdom
- Italy
- Spain
- France
- Nordics
- Benelux
- Rest of Western Europe
- Eastern Europe
- Russia
- Poland
- Hungary
- Balkan and Baltic States
- Rest of Eastern Europe
- East Asia
- China
- Japan
- South Korea
- South Asia and Pacific
- India
- ASEAN
- Australia and New Zealand
- Rest of South Asia and Pacific
- Middle East and Africa
- Kingdom of Saudi Arabia
- Other GCC Countries
- Türkiye
- South Africa
- Other African Union Countries
- Rest of Middle East and Africa
Research Sources and Bibliography
- Globalstar, Inc. (2025, February 13). Globalstar Receives 2024 IoT Excellence Award.
- Canadian Radio-television and Telecommunications Commission. (2025, October 9). Canadian Telecommunications Market Report 2025.
- Samsara Inc. (2025, May 2). Introducing Samsara’s satellite solution: Connectivity, anywhere, anytime.
- Ministry of Land, Infrastructure and Transport. (2025, September 17). Making Logistics Centers Smarter with Artificial Intelligence.
- Bureau of Transportation Statistics. (2026, August 5). Freight Analysis Framework.
- Innovation, Science and Economic Development Canada. (2025, May 29). National Broadband Data Information.
- Ofcom. (2026, May 29). 3G and 2G switch-off.
- Australian Communications and Media Authority. (2026, June 30). New telco transparency rules now in force.
- Geotab Inc. (2026, February 11). Geotab Launches New GO Anywhere Asset Trackers Featuring Satellite Connectivity.
- ORBCOMM Inc. (2025, February 26). ORBCOMM joins the Geotab Marketplace Order Now program.
- Teletrac Navman. (2025, January 16). Press Release - Teletrac Navman Asset Trackers Set Benchmark With One-Time Install And Indoor Tracking.
- Digital Matter. (2024, November 7). Solar-Powered GPS Trackers vs Battery-Powered.
- CalAmp. (2024, June 20). CalAmp Announces General Availability of HMU3640LB Industrial Gateway.
- Queclink Wireless Solutions. (2025, August 1). Queclink Introduces New Asset and Cargo Tracking Solution.
This bibliography is provided for reader reference and is not exhaustive. The full report contains the complete reference list and detailed citations
This Report Answers
- What are the 2026 and 2036 market values?
- Why do unpowered assets require solar trackers?
- Why do portable trackers lead product type?
- How do connectivity choices affect field autonomy?
- Why does fleet tracking lead application demand?
- How do country entry conditions differ?
- Which companies integrate devices and platforms?
- Which field conditions weaken tracking returns?
Frequently Asked Questions
How big is the solar-powered asset tracking market in 2026?
The solar-powered asset tracking market is estimated at USD 1.6 billion in 2026 and is projected to reach USD 5.5 billion by 2036. Growth is driven by increasing demand for asset visibility across trailers, containers, and equipment that operate without permanent power sources
What is the CAGR of the solar-powered asset tracking market from 2026 to 2036?
The solar-powered asset tracking market is projected to grow at a CAGR of 13.2% between 2026 and 2036. Expansion is supported by the ability of solar-powered devices to reduce maintenance requirements and extend tracking performance in remote environments.
Which product type is projected to account for 60.0% of the solar-powered asset tracking market?
Portable trackers are projected to account for 60.0% of the market in 2026. Their leading share is driven by flexible deployment, easy installation, and the ability to track a wide range of mobile assets without permanent wiring
How much value is the solar-powered asset tracking market projected to add between 2026 and 2036?
The solar-powered asset tracking market is expected to add USD 3.9 billion in value between 2026 and 2036. Growth reflects rising adoption of autonomous tracking solutions that support longer service intervals and improved asset utilization
Which companies are active in the solar-powered asset tracking market?
Key companies operating in the market include Geotab Inc., CalAmp Corp., Teletrac Navman, ORBCOMM Inc., Samsara Inc., Digital Matter, Queclink Wireless Solutions, and Globalstar Inc. These companies offer fleet management platforms, solar-powered tracking devices, and connectivity solutions for asset monitoring.
Preview the report firsthand - request a free sample
Get SampleGet the brochure for pricing and purchase details.
Get PDFTable of Content
- Key Takeaways
- Market Size and CAGR
- Top Growth Driver
- Fastest Growing Segment
- Leading Region
- Key Companies
- Emerging Opportunities
- Executive Summary
- Global Market Outlook
- Demand-side Trends
- Supply-side Trends
- Technology Roadmap Analysis
- Analysis and Recommendations
- Analyst Perspective (What is happening? Why now? What should investors know?)
- Key Questions Answered
- How large is the market?
- What is the CAGR?
- What are key trends?
- Which region dominates?
- Who are the leaders?
- Market Overview
- Market Coverage / Taxonomy
- Market Definition / Scope / Limitations
- Research Methodology
- Chapter Orientation
- Analytical Lens and Working Hypotheses
- Market Structure, Signals, and Trend Drivers
- Benchmarking and Cross-market Comparability
- Market Sizing, Forecasting, and Opportunity Mapping
- Research Design and Evidence Framework
- Desk Research Programme (Secondary Evidence)
- Expert Input and Fieldwork (Primary Evidence)
- Tooling, Models, and Reference Databases
- Data Engineering and Model Build
- Quality Assurance and Audit Trail
- Market Background
- Market Dynamics (Drivers, Restraints, Opportunity, Trends)
- Scenario Forecast (Optimistic, Likely, Conservative)
- Impact Analysis
- AI Impact
- Sustainability Impact
- Regulatory Impact
- Technology Impact
- Consumer / Buyer Analysis
- Purchase Drivers
- Adoption Barriers
- Buyer Journey
- Opportunity Map Analysis
- Product Life Cycle Analysis
- Supply Chain Analysis
- Investment Feasibility Matrix
- Value Chain Analysis
- PESTLE and Porter's Analysis
- Regulatory Landscape
- Regional Parent Market Outlook
- Production and Consumption Statistics
- Import and Export Statistics
- Global Market Analysis and Forecast, 2021 to 2036
- Historical Market Size Value (USD Billion) Analysis, 2021 to 2025
- Current and Future Market Size Value (USD Billion) Projections, 2026 to 2036
- Y-o-Y Growth Trend Analysis
- Absolute $ Opportunity Analysis
- Global Market Pricing Analysis, 2021 to 2036
- Global Market Analysis and Forecast, By Product Type, 2021 to 2036
- Introduction / Key Findings
- Historical Market Size Value (USD Billion) Analysis By Product Type, 2021 to 2025
- Current and Future Market Size Value (USD Billion) Analysis and Forecast By Product Type, 2026 to 2036
- Portable Solar-Powered Trackers
- Solar GPS Trackers
- Portable IoT Trackers
- Fixed Solar-Powered Trackers
- Solar-Powered Fleet Trackers
- Solar-Powered Industrial Trackers
- Portable Solar-Powered Trackers
- Y-o-Y Growth Trend Analysis By Product Type, 2021 to 2025
- Absolute $ Opportunity Analysis By Product Type, 2026 to 2036
- Global Market Analysis and Forecast, By Connectivity, 2021 to 2036
- Introduction / Key Findings
- Historical Market Size Value (USD Billion) Analysis By Connectivity, 2021 to 2025
- Current and Future Market Size Value (USD Billion) Analysis and Forecast By Connectivity, 2026 to 2036
- 4G-LTE
- LTE-M
- NB-IoT
- 3G
- 3G Cellular Trackers
- 3G IoT Devices
- 2G
- GSM Trackers
- GPRS Trackers
- Satellite
- Low-Earth-Orbit Connectivity
- Satellite IoT Trackers
- 4G-LTE
- Y-o-Y Growth Trend Analysis By Connectivity, 2021 to 2025
- Absolute $ Opportunity Analysis By Connectivity, 2026 to 2036
- Global Market Analysis and Forecast, By Application, 2021 to 2036
- Introduction / Key Findings
- Historical Market Size Value (USD Billion) Analysis By Application, 2021 to 2025
- Current and Future Market Size Value (USD Billion) Analysis and Forecast By Application, 2026 to 2036
- Vehicle & Fleet Tracking
- Commercial Vehicles
- Fleet Management
- Vessel Tracking
- Marine Fleet Tracking
- Cargo & Container Tracking
- Machinery & Equipment Tracking
- Construction Equipment
- Agricultural Machinery
- Logistics & Supply Chain
- Freight Tracking
- Container Tracking
- Vehicle & Fleet Tracking
- Y-o-Y Growth Trend Analysis By Application, 2021 to 2025
- Absolute $ Opportunity Analysis By Application, 2026 to 2036
- Global Market Analysis and Forecast, By End User, 2021 to 2036
- Introduction / Key Findings
- Historical Market Size Value (USD Billion) Analysis By End User, 2021 to 2025
- Current and Future Market Size Value (USD Billion) Analysis and Forecast By End User, 2026 to 2036
- Transportation & Logistics
- Fleet Operators
- Logistics Providers
- Construction & Mining
- Construction Companies
- Mining Operations
- Oil & Gas & Energy
- Oil & Gas Equipment
- Renewable Energy Assets
- Agriculture
- Farm Equipment
- Agricultural Fleets
- Transportation & Logistics
- Y-o-Y Growth Trend Analysis By End User, 2021 to 2025
- Absolute $ Opportunity Analysis By End User, 2026 to 2036
- Global Market Analysis and Forecast, By Distribution Channel, 2021 to 2036
- Introduction / Key Findings
- Historical Market Size Value (USD Billion) Analysis By Distribution Channel, 2021 to 2025
- Current and Future Market Size Value (USD Billion) Analysis and Forecast By Distribution Channel, 2026 to 2036
- Direct Sales
- Direct Enterprise Sales
- Long-Term Contracts
- System Integrators & Solution Providers
- IoT Solution Integrators
- Fleet Management Providers
- Distributors & Resellers
- Industrial Technology Distributors
- Telematics Distributors
- Online & E-Commerce
- B2B E-Commerce Platforms
- Direct Online Sales
- Direct Sales
- Y-o-Y Growth Trend Analysis By Distribution Channel, 2021 to 2025
- Absolute $ Opportunity Analysis By Distribution Channel, 2026 to 2036
- Global Market Analysis and Forecast, By Region, 2021 to 2036
- Introduction
- Historical Market Size Value (USD Billion) Analysis By Region, 2021 to 2025
- Current Market Size Value (USD Billion) Analysis and Forecast By Region, 2026 to 2036
- North America
- Latin America
- Western Europe
- Eastern Europe
- East Asia
- South Asia and Pacific
- Middle East & Africa
- Market Attractiveness Analysis By Region
- North America Market Analysis and Forecast, By Country, 2021 to 2036
- Historical Market Size Value (USD Billion) Trend Analysis By Market Taxonomy, 2021 to 2025
- Market Size Value (USD Billion) Forecast By Market Taxonomy, 2026 to 2036
- By Country
- USA
- Canada
- By Product Type
- By Connectivity
- By Application
- By End User
- By Distribution Channel
- By Country
- Market Attractiveness Analysis
- By Country
- By Product Type
- By Connectivity
- By Application
- By End User
- By Distribution Channel
- Key Takeaways
- Latin America Market Analysis and Forecast, By Country
- Historical Market Size Value (USD Billion) Trend Analysis By Market Taxonomy, 2021 to 2025
- Market Size Value (USD Billion) Forecast By Market Taxonomy, 2026 to 2036
- By Country
- Brazil
- Mexico
- Chile
- Rest of Latin America
- By Product Type
- By Connectivity
- By Application
- By End User
- By Distribution Channel
- By Country
- Market Attractiveness Analysis
- By Country
- By Product Type
- By Connectivity
- By Application
- By End User
- By Distribution Channel
- Key Takeaways
- Western Europe Market Analysis and Forecast, By Country
- Historical Market Size Value (USD Billion) Trend Analysis By Market Taxonomy, 2021 to 2025
- Market Size Value (USD Billion) Forecast By Market Taxonomy, 2026 to 2036
- By Country
- Germany
- UK
- Italy
- Spain
- France
- Nordic
- BENELUX
- Rest of Western Europe
- By Product Type
- By Connectivity
- By Application
- By End User
- By Distribution Channel
- By Country
- Market Attractiveness Analysis
- By Country
- By Product Type
- By Connectivity
- By Application
- By End User
- By Distribution Channel
- Key Takeaways
- Eastern Europe Market Analysis and Forecast, By Country
- Historical Market Size Value (USD Billion) Trend Analysis By Market Taxonomy, 2021 to 2025
- Market Size Value (USD Billion) Forecast By Market Taxonomy, 2026 to 2036
- By Country
- Russia
- Poland
- Hungary
- Balkan & Baltic
- Rest of Eastern Europe
- By Product Type
- By Connectivity
- By Application
- By End User
- By Distribution Channel
- By Country
- Market Attractiveness Analysis
- By Country
- By Product Type
- By Connectivity
- By Application
- By End User
- By Distribution Channel
- Key Takeaways
- East Asia Market Analysis and Forecast, By Country
- Historical Market Size Value (USD Billion) Trend Analysis By Market Taxonomy, 2021 to 2025
- Market Size Value (USD Billion) Forecast By Market Taxonomy, 2026 to 2036
- By Country
- China
- Japan
- South Korea
- By Product Type
- By Connectivity
- By Application
- By End User
- By Distribution Channel
- By Country
- Market Attractiveness Analysis
- By Country
- By Product Type
- By Connectivity
- By Application
- By End User
- By Distribution Channel
- Key Takeaways
- South Asia and Pacific Market Analysis and Forecast, By Country
- Historical Market Size Value (USD Billion) Trend Analysis By Market Taxonomy, 2021 to 2025
- Market Size Value (USD Billion) Forecast By Market Taxonomy, 2026 to 2036
- By Country
- India
- ASEAN
- Australia & New Zealand
- Rest of South Asia and Pacific
- By Product Type
- By Connectivity
- By Application
- By End User
- By Distribution Channel
- By Country
- Market Attractiveness Analysis
- By Country
- By Product Type
- By Connectivity
- By Application
- By End User
- By Distribution Channel
- Key Takeaways
- Middle East & Africa Market Analysis and Forecast, By Country
- Historical Market Size Value (USD Billion) Trend Analysis By Market Taxonomy, 2021 to 2025
- Market Size Value (USD Billion) Forecast By Market Taxonomy, 2026 to 2036
- By Country
- Kingdom of Saudi Arabia
- Other GCC Countries
- Türkiye
- South Africa
- Other African Union
- Rest of Middle East & Africa
- By Product Type
- By Connectivity
- By Application
- By End User
- By Distribution Channel
- By Country
- Market Attractiveness Analysis
- By Country
- By Product Type
- By Connectivity
- By Application
- By End User
- By Distribution Channel
- Key Takeaways
- Key Countries Market Analysis
- USA
- Pricing Analysis
- Market Share Analysis, 2025
- By Product Type
- By Connectivity
- By Application
- By End User
- By Distribution Channel
- Canada
- Pricing Analysis
- Market Share Analysis, 2025
- By Product Type
- By Connectivity
- By Application
- By End User
- By Distribution Channel
- Mexico
- Pricing Analysis
- Market Share Analysis, 2025
- By Product Type
- By Connectivity
- By Application
- By End User
- By Distribution Channel
- Brazil
- Pricing Analysis
- Market Share Analysis, 2025
- By Product Type
- By Connectivity
- By Application
- By End User
- By Distribution Channel
- Chile
- Pricing Analysis
- Market Share Analysis, 2025
- By Product Type
- By Connectivity
- By Application
- By End User
- By Distribution Channel
- Germany
- Pricing Analysis
- Market Share Analysis, 2025
- By Product Type
- By Connectivity
- By Application
- By End User
- By Distribution Channel
- UK
- Pricing Analysis
- Market Share Analysis, 2025
- By Product Type
- By Connectivity
- By Application
- By End User
- By Distribution Channel
- Italy
- Pricing Analysis
- Market Share Analysis, 2025
- By Product Type
- By Connectivity
- By Application
- By End User
- By Distribution Channel
- Spain
- Pricing Analysis
- Market Share Analysis, 2025
- By Product Type
- By Connectivity
- By Application
- By End User
- By Distribution Channel
- France
- Pricing Analysis
- Market Share Analysis, 2025
- By Product Type
- By Connectivity
- By Application
- By End User
- By Distribution Channel
- India
- Pricing Analysis
- Market Share Analysis, 2025
- By Product Type
- By Connectivity
- By Application
- By End User
- By Distribution Channel
- ASEAN
- Pricing Analysis
- Market Share Analysis, 2025
- By Product Type
- By Connectivity
- By Application
- By End User
- By Distribution Channel
- Australia & New Zealand
- Pricing Analysis
- Market Share Analysis, 2025
- By Product Type
- By Connectivity
- By Application
- By End User
- By Distribution Channel
- China
- Pricing Analysis
- Market Share Analysis, 2025
- By Product Type
- By Connectivity
- By Application
- By End User
- By Distribution Channel
- Japan
- Pricing Analysis
- Market Share Analysis, 2025
- By Product Type
- By Connectivity
- By Application
- By End User
- By Distribution Channel
- South Korea
- Pricing Analysis
- Market Share Analysis, 2025
- By Product Type
- By Connectivity
- By Application
- By End User
- By Distribution Channel
- Russia
- Pricing Analysis
- Market Share Analysis, 2025
- By Product Type
- By Connectivity
- By Application
- By End User
- By Distribution Channel
- Poland
- Pricing Analysis
- Market Share Analysis, 2025
- By Product Type
- By Connectivity
- By Application
- By End User
- By Distribution Channel
- Hungary
- Pricing Analysis
- Market Share Analysis, 2025
- By Product Type
- By Connectivity
- By Application
- By End User
- By Distribution Channel
- Kingdom of Saudi Arabia
- Pricing Analysis
- Market Share Analysis, 2025
- By Product Type
- By Connectivity
- By Application
- By End User
- By Distribution Channel
- Türkiye
- Pricing Analysis
- Market Share Analysis, 2025
- By Product Type
- By Connectivity
- By Application
- By End User
- By Distribution Channel
- South Africa
- Pricing Analysis
- Market Share Analysis, 2025
- By Product Type
- By Connectivity
- By Application
- By End User
- By Distribution Channel
- USA
- Market Structure Analysis
- Competition Dashboard
- Competition Benchmarking
- Market Share Analysis of Top Players
- By Regional
- By Product Type
- By Connectivity
- By Application
- By End User
- By Distribution Channel
- Emerging Startups
- Innovation Benchmarking
- Competition Analysis
- Competition Deep Dive
- Geotab Inc.
- Overview
- Product Portfolio
- Profitability by Market Segments
- Sales Footprint
- Strategy Overview
- Marketing Strategy
- Product Strategy
- Channel Strategy
- CalAmp Corp.
- Zebra Technologies Corporation
- Tracki
- Teletrac Navman
- Orbcomm Inc.
- Samsara Inc.
- Digital Matter
- Queclink Wireless Solutions
- Ruptela
- Others
- Geotab Inc.
- Case Studies
- Success Stories
- Recent Developments
- Competition Deep Dive
- Assumptions & Acronyms Used


