Subsea Power Grid Systems Market Size and Share Forecast Outlook 2025 to 2035

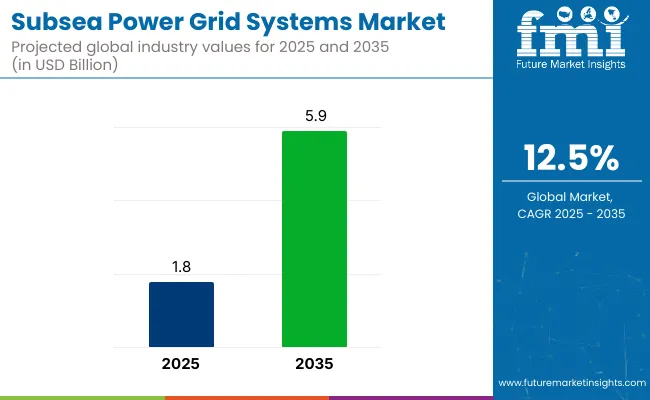
The global subsea power grid systems market is valued at USD 1.8 billion in 2025 and is expected to reach USD 5.9 billion by 2035, reflecting a CAGR of 12.5%. This significant growth is expected to be driven by the increasing demand for offshore renewable energy, deep-sea oil and gas exploration, and technological advancements in power transmission and smart grid integration.
Quick Stats for Subsea Power Grid Systems Market

  • Market Value (2025): USD 1.8 billion
  • Forecast Value (2035): USD 5.9 billion
  • Forecast CAGR: 12.5%
  • Product Leader in 2025:Cables (55% Market Share)
  • Top Power Supply:Wind Power Segment (58% Market Share)
  • Key Growth Region:Europe (fastest-growing market in the UK with 13.2% CAGR)
Metric Value
Estimated Size (2025) USD 1.8 billion
Projected Value (2035) USD 5.9 billion
CAGR (2025 to 2035) 12.5%

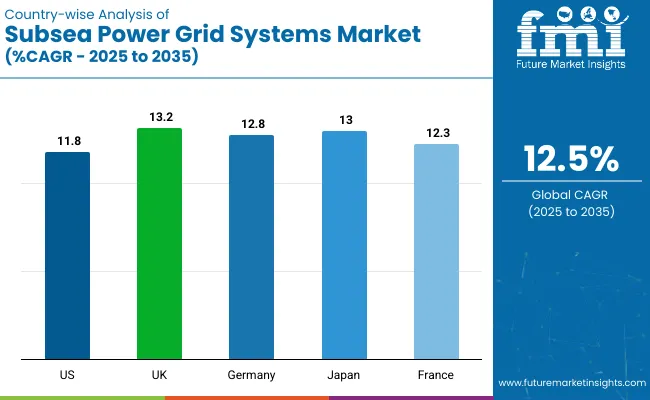
The market is also being supported by strong government incentives promoting offshore electrification and carbon neutrality goals. The subsea power grid systems market is expected to remain dominant in Europe especially in the UK, with a CAGR of 13.2% through 2035. Meanwhile, Japan and Germany closely follow this rapid growth, expanding at CAGRs of 13.0% and 12.8% respectively.

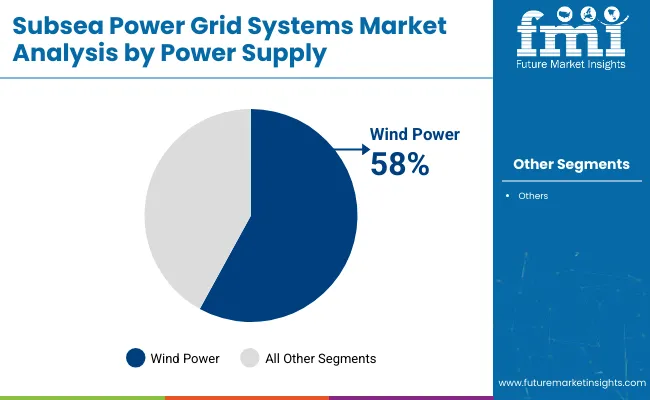
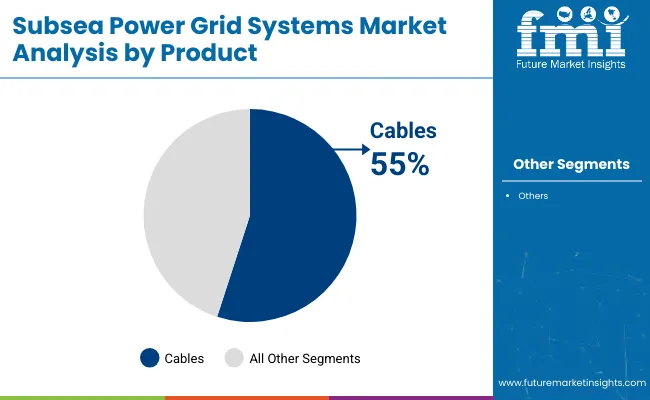
Wind power is projected to lead the power supply segment by holding nearly 58% of the market share, while cables are expected to remain the top product, owing to their critical role in connecting offshore and onshore grids, accounting for 55% market share in 2025.

ABB Ltd. has been witnessing strong profitability due to its strategic focus on high-voltage direct current (HVDC) solutions and digital monitoring technologies. In contrast, companies in regions with stringent regulatory compliance, such as Europe, are facing challenges related to permitting delays, though success is being achieved through government incentives and tax subsidies promoting offshore electrification. Nearly 60% of stakeholders have identified high capital costs as a barrier, while 73% of policymakers have confirmed that carbon reduction targets will accelerate adoption.

The subsea power grid systems market holds a niche but crucial share across its parent markets. Within the subsea power transmission market, it accounts for a significant 30-35% due to its role in enabling offshore energy distribution. In the broader subsea equipment market, it holds around 12-15%, as it supports both oil & gas and renewable sectors.

Within the offshore energy infrastructure market, it contributes approximately 10%, reflecting its relevance in power delivery for offshore platforms. Its share in the submarine cable market and power distribution equipment market is more limited, at around 5-8%, primarily supporting long-distance and high-voltage subsea applications.

Analyzing Subsea Power Grid Systems Market by Top Investment Segments

The subsea power grid systems market is segmented into power supply, product, and region. By power supply, it includes wind power, captive generation, and others (marine energy, hybrid renewable systems).By product, it includes cables, variable speed drives, transformers, switchgears, and others (connectors, subsea nodes). By region, it covers North America, Latin America, Western Europe, Eastern Europe, South Asia and Pacific, East Asia, Middle East and Africa.

By Power Supply, the Wind Power segment Accounts for 58% of the Market Share in 2025

Wind power is anticipated to remain the most lucrative segment, accounting for nearly 58% share of the power supply segment in 2025. This growth is being driven by rapid offshore wind farm installations in Europe, North America, and East Asia. Captive generation is also gaining traction as oil and gas firms adopt independent offshore power solutions to reduce dependency on traditional grids. Other sources, like marine energy and hybrid systems, are slowly emerging with technological advancements in wave and tidal energy.
  • Captive generation is expected to expand due to offshore oil platform needs
  • Marine energy integration progressing steadily
  • Hybrid renewable systems adoption supported by technology improvements

By Product, Cables Account for a Prominent Market Share of 55% in 2025

Cables are expected to dominate the product segment, holding a 54% market share in 2025. High-voltage subsea cables remain critical for connecting offshore installations to onshore grids efficiently. Variable speed drives are also gaining adoption to enable precise control of power flow, enhancing operational energy savings. Transformers play a vital role in voltage stabilization while switchgears ensure safe power distribution, especially in deep water conditions. Others include connectors and subsea nodes that support integrated grid operations.
  • Cables projected to hold 54% share in 2025
  • Variable speed drives adoption is rising for power control efficiency
  • Transformers are crucial for stable offshore energy transmission
  • Switchgears are vital for safety and reliability in subsea grids

Top Subsea Power Grid Systems Market Dynamics

Recent Trends in the Subsea Power Grid Systems Market
  • Integration of AI-driven predictive maintenance to enhance offshore grid reliability
  • Deployment of high-voltage direct current (HVDC) cables for efficient long-distance power transmission
  • Adoption of digital twin technology for real-time grid performance monitoring
  • Expansion of hybrid renewable energy systems combining wind, solar, and marine power in offshore grids

Challenges in the Subsea Power Grid Systems Market

  • High capital expenditure requirements limit large-scale project adoption
  • Complex permitting and regulatory compliance are delaying project execution timelines
  • Supply chain constraints affecting the timely procurement of advanced cables and transformers
  • Engineering complexities leading to long installation and commissioning periods for deep-sea projects

Analyzing Top Countries Manufacturing and Supplying Subsea Power Grid Systems

The UK leads the subsea power grid systems market with the highest projected CAGR of 13.2%, driven by floating wind farms and HVDC adoption. Japan follows closely at 13.0%, fueled by offshore wind expansion and government-private collaborations. Germany holds a strong position with 12.8% CAGR, supported by North Sea and Baltic Sea projects.

France is next with 12.3%, leveraging floating wind and interconnectors for energy security. The USA grows at 11.8%, propelled by offshore wind and clean energy policies. Overall, European nations and Japan exhibit faster growth, while the USA maintains steady momentum in offshore renewable integration.

The report covers in-depth analysis of 40+ countries; five top-performing OECD countries are highlighted below.

USA Subsea Power Grid Systems Market Analysis

The subsea power grid system revenue in the USA is projected to grow at a CAGR of 11.8% from 2025 to 2035. Growth is being driven by the expansion of offshore wind energy projects and deep water oil and gas exploration. Technological advancements in subsea cables and transformers are enhancing energy efficiency, while government policies promoting clean energy are supporting market expansion across coastal states and offshore platforms.

  • Rising investments in offshore wind farms
  • Technological upgrades improving transmission efficiency
  • Government incentives accelerating renewable integration

Subsea Power Grid Systems Demand Analysis in the UK

The subsea power grid systems sales in the UK are expected to register a CAGR of 13.2% during the forecast period. This growth is being propelled by extensive offshore wind energy developments and net-zero emissions commitments. Floating wind farms and interconnectors are expanding, while advancements in HVDC cables are enhancing energy transfer across the region and into mainland Europe efficiently.

  • Strong focus on floating wind farm projects
  • HVDC technology adoption for efficient power transmission
  • Net-zero policies boosting offshore infrastructure investments

Subsea Power Grid System Sales Analysis in Germany

Germany’s subsea power grid systems market is estimated to grow at a CAGR of 12.8% through 2035. This expansion is driven by offshore wind energy projects in the North Sea and Baltic Sea and the country’s transition away from fossil fuels. Innovations in power electronics and grid automation are further enhancing energy efficiency and supporting Germany’s ambitious renewable energy goals.

  • Large-scale offshore wind installations in the North Sea and the Baltic
  • Power electronics advancements are improving grid stability
  • Government incentives supporting renewable energy targets

France Subsea Power Grid Systems Market Analysis

The revenue of subsea power grid systems in France is projected to witness a CAGR of 12.3% from 2025 to 2035. The country’s growth is driven by offshore wind farm expansions and investments in subsea cable networks. The development of floating wind technologies and cross-border interconnectors is enhancing regional energy security and sustainability objectives effectively.

  • Offshore floating wind farms are expanding rapidly
  • Investments in subsea cable infrastructure are increasing
  • Cross-border interconnectors strengthening energy security

Subsea Power Grid Systems Market Analysis in Japan

Japan’s subsea power grid systems market is anticipated to expand at a CAGR of 13.0% through the forecast period. Growth is being fueled by offshore wind energy projects, technological advances in HVDC subsea cables, and initiatives aimed at reducing reliance on fossil fuels. Collaborative efforts between the government and the private sector are further enhancing grid efficiency and offshore energy security.

  • Offshore wind energy investments are rising significantly
  • HVDC subsea cable innovations improving efficiency
  • Government-private partnerships advancing grid modernization

Leading Subsea Power Grid Systems Suppliers

The subsea power grid systems market is moderately consolidated, with a few global leaders holding significant market shares. Companies such as ABB Ltd., Siemens Energy, General Electric Company, and Nexans SA are competing by developing advanced HVDC cable technologies, expanding manufacturing capabilities, and forming strategic offshore energy partnerships. These firms are enhancing their competitive positioning through R&D investments in AI-based grid management and by integrating smart monitoring systems for operational efficiency.

Company strategies are focusing on technological innovation to improve energy efficiency, reduce transmission losses, and support carbon neutrality targets. Pricing competitiveness is observed in turnkey project bids, while strategic partnerships with offshore wind developers and oil & gas firms are enabling market expansion.

For instance, ABB and Nexans are increasingly collaborating with energy companies to deliver integrated subsea power solutions. In contrast, General Electric is strengthening its subsea electrification portfolio to cater to deep water energy projects and floating wind farms.

Recent Subsea Power Grid Systems Industry News

  • In January 2025, ABB acquired Sensorfact, a leading energy management company to boost its digital energy management offerings.
  • In September 2024, Aker Solutions announced the acquisition of energy tech firm Alma and Clara Venture Labs’ engineering business. This boosted the company’s position in the market.

Subsea Power Grid Systems Market Report Scope

Report Attributes Details
Current Total Market Size (2025) USD 1.8 billion
Projected Market Size (2035) USD 5.9 billion
CAGR (2025 to 2035) 12.5%
Base Year for Estimation 2024
Historical Period 2020 to 2024
Projections Period 2025 to 2035
Market Analysis Parameters Revenue in USD billion/Volume in Units
By Power Supply Wind Power, Captive Generation, Others (Marine Energy, Hybrid Renewable Systems)
By Product Cables, Variable Speed Drives, Transformers, Switchgears, Others (Connectors, Subsea Nodes)
Regions Covered North America, Latin America, Western Europe, Eastern Europe, South Asia, Pacific, East Asia, Middle East and Africa
Countries Covered United States, Canada, United Kingdom, Germany, France, China, Japan, South Korea, Brazil, Australia
Key Players ABB Ltd., Aker Solutions ASA, Bandak AS, Dril -Quip, Inc., Expro Group, General Electric Company, JDR Cable Systems Ltd., Nexans SA, Norddeutsche Seekabelwerke GmbH, Oceaneering International, Inc.
Additional Attributes Dollar sales by value, market share analysis by region, country-wise analysis, and company strategy insights.

Key Segmentation

By Power Supply:

Wind Power, Captive Generation, Others

By Products:

Cables, Variable Speed Drivers, Transformers, Switchgears, Others

By Region:

North America, Latin America, Europe, Asia Pacific, Middle East and Africa

Table of Content

  1. Executive Summary
    • Global Market Outlook
    • Demand-side Trends
    • Supply-side Trends
    • Technology Roadmap Analysis
    • Analysis and Recommendations
  2. Market Overview
    • Market Coverage / Taxonomy
    • Market Definition / Scope / Limitations
  3. Market Background
    • Market Dynamics
      • Drivers
      • Restraints
      • Opportunity
      • Trends
    • Scenario Forecast
      • Demand in Optimistic Scenario
      • Demand in Likely Scenario
      • Demand in Conservative Scenario
    • Opportunity Map Analysis
    • Product Life Cycle Analysis
    • Supply Chain Analysis
      • Supply Side Participants and their Roles
        • Producers
        • Mid-Level Participants (Traders/ Agents/ Brokers)
        • Wholesalers and Distributors
      • Value Added and Value Created at Node in the Supply Chain
      • List of Raw Material Suppliers
      • List of Existing and Potential Buyer’s
    • Investment Feasibility Matrix
    • Value Chain Analysis
      • Profit Margin Analysis
      • Wholesalers and Distributors
      • Retailers
    • PESTLE and Porter’s Analysis
    • Regulatory Landscape
      • By Key Regions
      • By Key Countries
    • Regional Parent Market Outlook
    • Production and Consumption Statistics
    • Import and Export Statistics
  4. Global Market Analysis 2020 to 2024 and Forecast, 2025 to 2035
    • Historical Market Size Value (USD Billion) & Volume (Units) Analysis, 2020 to 2024
    • Current and Future Market Size Value (USD Billion) & Volume (Units) Projections, 2025 to 2035
      • Y-o-Y Growth Trend Analysis
      • Absolute $ Opportunity Analysis
  5. Global Market Pricing Analysis 2020 to 2024 and Forecast 2025 to 2035
  6. Global Market Analysis 2020 to 2024 and Forecast 2025 to 2035, By Power Supply
    • Introduction / Key Findings
    • Historical Market Size Value (USD Billion) & Volume (Units) Analysis By Power Supply, 2020 to 2024
    • Current and Future Market Size Value (USD Billion) & Volume (Units) Analysis and Forecast By Power Supply, 2025 to 2035
      • Wind Power
      • Captive Generation
      • Others
    • Y-o-Y Growth Trend Analysis By Power Supply, 2020 to 2024
    • Absolute $ Opportunity Analysis By Power Supply, 2025 to 2035
  7. Global Market Analysis 2020 to 2024 and Forecast 2025 to 2035, By Product
    • Introduction / Key Findings
    • Historical Market Size Value (USD Billion) & Volume (Units) Analysis By Product, 2020 to 2024
    • Current and Future Market Size Value (USD Billion) & Volume (Units) Analysis and Forecast By Product, 2025 to 2035
      • Cables
      • Variable Speed Drives
      • Transformers
      • Switchgears
      • Others
    • Y-o-Y Growth Trend Analysis By Product, 2020 to 2024
    • Absolute $ Opportunity Analysis By Product, 2025 to 2035
  8. Global Market Analysis 2020 to 2024 and Forecast 2025 to 2035, By Region
    • Introduction
    • Historical Market Size Value (USD Billion) & Volume (Units) Analysis By Region, 2020 to 2024
    • Current Market Size Value (USD Billion) & Volume (Units) Analysis and Forecast By Region, 2025 to 2035
      • North America
      • Latin America
      • Western Europe
      • Eastern Europe
      • East Asia
      • South Asia & Pacific
      • Middle East and Africa
    • Market Attractiveness Analysis By Region
  9. North America Market Analysis 2020 to 2024 and Forecast 2025 to 2035, By Country
    • Historical Market Size Value (USD Billion) & Volume (Units) Trend Analysis By Market Taxonomy, 2020 to 2024
    • Market Size Value (USD Billion) & Volume (Units) Forecast By Market Taxonomy, 2025 to 2035
      • By Country
        • USA
        • Canada
        • Mexico
      • By Power Supply
      • By Product
    • Market Attractiveness Analysis
      • By Country
      • By Power Supply
      • By Product
    • Key Takeaways
  10. Latin America Market Analysis 2020 to 2024 and Forecast 2025 to 2035, By Country
    • Historical Market Size Value (USD Billion) & Volume (Units) Trend Analysis By Market Taxonomy, 2020 to 2024
    • Market Size Value (USD Billion) & Volume (Units) Forecast By Market Taxonomy, 2025 to 2035
      • By Country
        • Brazil
        • Argentina
        • Rest of LATAM
      • By Power Supply
      • By Product
    • Market Attractiveness Analysis
      • By Country
      • By Power Supply
      • By Product
    • Key Takeaways
  11. Western Europe Market Analysis 2020 to 2024 and Forecast 2025 to 2035, By Country
    • Historical Market Size Value (USD Billion) & Volume (Units) Trend Analysis By Market Taxonomy, 2020 to 2024
    • Market Size Value (USD Billion) & Volume (Units) Forecast By Market Taxonomy, 2025 to 2035
      • By Country
        • Germany
        • Italy
        • France
        • UK
        • Spain
        • BENELUX
        • Nordic
        • Rest of W.Europe
      • By Power Supply
      • By Product
    • Market Attractiveness Analysis
      • By Country
      • By Power Supply
      • By Product
    • Key Takeaways
  12. Eastern Europe Market Analysis 2020 to 2024 and Forecast 2025 to 2035, By Country
    • Historical Market Size Value (USD Billion) & Volume (Units) Trend Analysis By Market Taxonomy, 2020 to 2024
    • Market Size Value (USD Billion) & Volume (Units) Forecast By Market Taxonomy, 2025 to 2035
      • By Country
        • Russia
        • Hungary
        • Poland
        • Balkan & Baltics
        • Rest of E. Europe
      • By Power Supply
      • By Product
    • Market Attractiveness Analysis
      • By Country
      • By Power Supply
      • By Product
    • Key Takeaways
  13. East Asia Market Analysis 2020 to 2024 and Forecast 2025 to 2035, By Country
    • Historical Market Size Value (USD Billion) & Volume (Units) Trend Analysis By Market Taxonomy, 2020 to 2024
    • Market Size Value (USD Billion) & Volume (Units) Forecast By Market Taxonomy, 2025 to 2035
      • By Country
        • China
        • Japan
        • South Korea
      • By Power Supply
      • By Product
    • Market Attractiveness Analysis
      • By Country
      • By Power Supply
      • By Product
    • Key Takeaways
  14. South Asia & Pacific Market Analysis 2020 to 2024 and Forecast 2025 to 2035, By Country
    • Historical Market Size Value (USD Billion) & Volume (Units) Trend Analysis By Market Taxonomy, 2020 to 2024
    • Market Size Value (USD Billion) & Volume (Units) Forecast By Market Taxonomy, 2025 to 2035
      • By Country
        • India
        • Australia & New Zealand
        • ASEAN
        • Rest of SAP
      • By Power Supply
      • By Product
    • Market Attractiveness Analysis
      • By Country
      • By Power Supply
      • By Product
    • Key Takeaways
  15. Middle East and Africa Market Analysis 2020 to 2024 and Forecast 2025 to 2035, By Country
    • Historical Market Size Value (USD Billion) & Volume (Units) Trend Analysis By Market Taxonomy, 2020 to 2024
    • Market Size Value (USD Billion) & Volume (Units) Forecast By Market Taxonomy, 2025 to 2035
      • By Country
        • GCC Countries
        • Northern Africa
        • South Africa
        • Turkiye
        • Rest of MEA
      • By Power Supply
      • By Product
    • Market Attractiveness Analysis
      • By Country
      • By Power Supply
      • By Product
    • Key Takeaways
  16. Key Countries Market Analysis
    • USA
      • Pricing Analysis
      • Market Share Analysis, 2024
        • By Power Supply
        • By Product
    • Canada
      • Pricing Analysis
      • Market Share Analysis, 2024
        • By Power Supply
        • By Product
    • Brazil
      • Pricing Analysis
      • Market Share Analysis, 2024
        • By Power Supply
        • By Product
    • Mexico
      • Pricing Analysis
      • Market Share Analysis, 2024
        • By Power Supply
        • By Product
    • Argentina
      • Pricing Analysis
      • Market Share Analysis, 2024
        • By Power Supply
        • By Product
  17. Market Structure Analysis
    • Competition Dashboard
    • Competition Benchmarking
    • Market Share Analysis of Top Players
      • By Regional
      • By Power Supply
      • By Product
  18. Competition Analysis
    • Competition Deep Dive
      • ABB Ltd.
        • Overview
        • Product Portfolio
        • Profitability by Market Segments (Product/Age /Sales Channel/Region)
        • Sales Footprint
        • Strategy Overview
          • Marketing Strategy
          • Product Strategy
          • Channel Strategy
      • Aker Solutions ASA
        • Overview
        • Product Portfolio
        • Profitability by Market Segments (Product/Age /Sales Channel/Region)
        • Sales Footprint
        • Strategy Overview
          • Marketing Strategy
          • Product Strategy
          • Channel Strategy
      • Bandak AS
        • Overview
        • Product Portfolio
        • Profitability by Market Segments (Product/Age /Sales Channel/Region)
        • Sales Footprint
        • Strategy Overview
          • Marketing Strategy
          • Product Strategy
          • Channel Strategy
      • Dril-Quip, Inc.
        • Overview
        • Product Portfolio
        • Profitability by Market Segments (Product/Age /Sales Channel/Region)
        • Sales Footprint
        • Strategy Overview
          • Marketing Strategy
          • Product Strategy
          • Channel Strategy
      • Expro Group
        • Overview
        • Product Portfolio
        • Profitability by Market Segments (Product/Age /Sales Channel/Region)
        • Sales Footprint
        • Strategy Overview
          • Marketing Strategy
          • Product Strategy
          • Channel Strategy
      • General Electric Company
        • Overview
        • Product Portfolio
        • Profitability by Market Segments (Product/Age /Sales Channel/Region)
        • Sales Footprint
        • Strategy Overview
          • Marketing Strategy
          • Product Strategy
          • Channel Strategy
      • JDR Cable Systems Ltd.
        • Overview
        • Product Portfolio
        • Profitability by Market Segments (Product/Age /Sales Channel/Region)
        • Sales Footprint
        • Strategy Overview
          • Marketing Strategy
          • Product Strategy
          • Channel Strategy
      • Nexans SA
        • Overview
        • Product Portfolio
        • Profitability by Market Segments (Product/Age /Sales Channel/Region)
        • Sales Footprint
        • Strategy Overview
          • Marketing Strategy
          • Product Strategy
          • Channel Strategy
      • Norddeutsche Seekabelwerke GmbH
        • Overview
        • Product Portfolio
        • Profitability by Market Segments (Product/Age /Sales Channel/Region)
        • Sales Footprint
        • Strategy Overview
          • Marketing Strategy
          • Product Strategy
          • Channel Strategy
      • Oceaneering International, Inc.
        • Overview
        • Product Portfolio
        • Profitability by Market Segments (Product/Age /Sales Channel/Region)
        • Sales Footprint
        • Strategy Overview
          • Marketing Strategy
          • Product Strategy
          • Channel Strategy
  19. Assumptions & Acronyms Used
  20. Research Methodology

List of Tables

  • Table 1: Global Market Value (USD Billion) Forecast by Region, 2020-2035
  • Table 2: Global Market Volume (Units) Forecast by Region, 2020-2035
  • Table 3: Global Market Value (USD Billion) Forecast by Power Supply, 2020-2035
  • Table 4: Global Market Volume (Units) Forecast by Power Supply, 2020-2035
  • Table 5: Global Market Value (USD Billion) Forecast by Product, 2020-2035
  • Table 6: Global Market Volume (Units) Forecast by Product, 2020-2035
  • Table 7: North America Market Value (USD Billion) Forecast by Country, 2020-2035
  • Table 8: North America Market Volume (Units) Forecast by Country, 2020-2035
  • Table 9: North America Market Value (USD Billion) Forecast by Power Supply, 2020-2035
  • Table 10: North America Market Volume (Units) Forecast by Power Supply, 2020-2035
  • Table 11: North America Market Value (USD Billion) Forecast by Product, 2020-2035
  • Table 12: North America Market Volume (Units) Forecast by Product, 2020-2035
  • Table 13: Latin America Market Value (USD Billion) Forecast by Country, 2020-2035
  • Table 14: Latin America Market Volume (Units) Forecast by Country, 2020-2035
  • Table 15: Latin America Market Value (USD Billion) Forecast by Power Supply, 2020-2035
  • Table 16: Latin America Market Volume (Units) Forecast by Power Supply, 2020-2035
  • Table 17: Latin America Market Value (USD Billion) Forecast by Product, 2020-2035
  • Table 18: Latin America Market Volume (Units) Forecast by Product, 2020-2035
  • Table 19: Western Europe Market Value (USD Billion) Forecast by Country, 2020-2035
  • Table 20: Western Europe Market Volume (Units) Forecast by Country, 2020-2035
  • Table 21: Western Europe Market Value (USD Billion) Forecast by Power Supply, 2020-2035
  • Table 22: Western Europe Market Volume (Units) Forecast by Power Supply, 2020-2035
  • Table 23: Western Europe Market Value (USD Billion) Forecast by Product, 2020-2035
  • Table 24: Western Europe Market Volume (Units) Forecast by Product, 2020-2035
  • Table 25: Eastern Europe Market Value (USD Billion) Forecast by Country, 2020-2035
  • Table 26: Eastern Europe Market Volume (Units) Forecast by Country, 2020-2035
  • Table 27: Eastern Europe Market Value (USD Billion) Forecast by Power Supply, 2020-2035
  • Table 28: Eastern Europe Market Volume (Units) Forecast by Power Supply, 2020-2035
  • Table 29: Eastern Europe Market Value (USD Billion) Forecast by Product, 2020-2035
  • Table 30: Eastern Europe Market Volume (Units) Forecast by Product, 2020-2035
  • Table 31: East Asia Market Value (USD Billion) Forecast by Country, 2020-2035
  • Table 32: East Asia Market Volume (Units) Forecast by Country, 2020-2035
  • Table 33: East Asia Market Value (USD Billion) Forecast by Power Supply, 2020-2035
  • Table 34: East Asia Market Volume (Units) Forecast by Power Supply, 2020-2035
  • Table 35: East Asia Market Value (USD Billion) Forecast by Product, 2020-2035
  • Table 36: East Asia Market Volume (Units) Forecast by Product, 2020-2035
  • Table 37: South Asia & Pacific Market Value (USD Billion) Forecast by Country, 2020-2035
  • Table 38: South Asia & Pacific Market Volume (Units) Forecast by Country, 2020-2035
  • Table 39: South Asia & Pacific Market Value (USD Billion) Forecast by Power Supply, 2020-2035
  • Table 40: South Asia & Pacific Market Volume (Units) Forecast by Power Supply, 2020-2035
  • Table 41: South Asia & Pacific Market Value (USD Billion) Forecast by Product, 2020-2035
  • Table 42: South Asia & Pacific Market Volume (Units) Forecast by Product, 2020-2035
  • Table 43: Middle East and Africa Market Value (USD Billion) Forecast by Country, 2020-2035
  • Table 44: Middle East and Africa Market Volume (Units) Forecast by Country, 2020-2035
  • Table 45: Middle East and Africa Market Value (USD Billion) Forecast by Power Supply, 2020-2035
  • Table 46: Middle East and Africa Market Volume (Units) Forecast by Power Supply, 2020-2035
  • Table 47: Middle East and Africa Market Value (USD Billion) Forecast by Product, 2020-2035
  • Table 48: Middle East and Africa Market Volume (Units) Forecast by Product, 2020-2035

List of Figures

  • Figure 1: Global Market Volume (Units) Forecast 2020-2035
  • Figure 2: Global Market Pricing Analysis
  • Figure 3: Global Market Value (USD Billion) Forecast 2020-2035
  • Figure 4: Global Market Value Share and BPS Analysis by Power Supply, 2025 and 2035
  • Figure 5: Global Market Y-o-Y Growth Comparison by Power Supply, 2025-2035
  • Figure 6: Global Market Attractiveness Analysis by Power Supply
  • Figure 7: Global Market Value Share and BPS Analysis by Product, 2025 and 2035
  • Figure 8: Global Market Y-o-Y Growth Comparison by Product, 2025-2035
  • Figure 9: Global Market Attractiveness Analysis by Product
  • Figure 10: Global Market Value (USD Billion) Share and BPS Analysis by Region, 2025 and 2035
  • Figure 11: Global Market Y-o-Y Growth Comparison by Region, 2025-2035
  • Figure 12: Global Market Attractiveness Analysis by Region
  • Figure 13: North America Market Incremental $ Opportunity, 2025-2035
  • Figure 14: Latin America Market Incremental $ Opportunity, 2025-2035
  • Figure 15: Western Europe Market Incremental $ Opportunity, 2025-2035
  • Figure 16: Eastern Europe Market Incremental $ Opportunity, 2025-2035
  • Figure 17: East Asia Market Incremental $ Opportunity, 2025-2035
  • Figure 18: South Asia & Pacific Market Incremental $ Opportunity, 2025-2035
  • Figure 19: Middle East and Africa Market Incremental $ Opportunity, 2025-2035
  • Figure 20: North America Market Value Share and BPS Analysis by Country, 2025 and 2035
  • Figure 21: North America Market Value Share and BPS Analysis by Power Supply, 2025 and 2035
  • Figure 22: North America Market Y-o-Y Growth Comparison by Power Supply, 2025-2035
  • Figure 23: North America Market Attractiveness Analysis by Power Supply
  • Figure 24: North America Market Value Share and BPS Analysis by Product, 2025 and 2035
  • Figure 25: North America Market Y-o-Y Growth Comparison by Product, 2025-2035
  • Figure 26: North America Market Attractiveness Analysis by Product
  • Figure 27: Latin America Market Value Share and BPS Analysis by Country, 2025 and 2035
  • Figure 28: Latin America Market Value Share and BPS Analysis by Power Supply, 2025 and 2035
  • Figure 29: Latin America Market Y-o-Y Growth Comparison by Power Supply, 2025-2035
  • Figure 30: Latin America Market Attractiveness Analysis by Power Supply
  • Figure 31: Latin America Market Value Share and BPS Analysis by Product, 2025 and 2035
  • Figure 32: Latin America Market Y-o-Y Growth Comparison by Product, 2025-2035
  • Figure 33: Latin America Market Attractiveness Analysis by Product
  • Figure 34: Western Europe Market Value Share and BPS Analysis by Country, 2025 and 2035
  • Figure 35: Western Europe Market Value Share and BPS Analysis by Power Supply, 2025 and 2035
  • Figure 36: Western Europe Market Y-o-Y Growth Comparison by Power Supply, 2025-2035
  • Figure 37: Western Europe Market Attractiveness Analysis by Power Supply
  • Figure 38: Western Europe Market Value Share and BPS Analysis by Product, 2025 and 2035
  • Figure 39: Western Europe Market Y-o-Y Growth Comparison by Product, 2025-2035
  • Figure 40: Western Europe Market Attractiveness Analysis by Product
  • Figure 41: Eastern Europe Market Value Share and BPS Analysis by Country, 2025 and 2035
  • Figure 42: Eastern Europe Market Value Share and BPS Analysis by Power Supply, 2025 and 2035
  • Figure 43: Eastern Europe Market Y-o-Y Growth Comparison by Power Supply, 2025-2035
  • Figure 44: Eastern Europe Market Attractiveness Analysis by Power Supply
  • Figure 45: Eastern Europe Market Value Share and BPS Analysis by Product, 2025 and 2035
  • Figure 46: Eastern Europe Market Y-o-Y Growth Comparison by Product, 2025-2035
  • Figure 47: Eastern Europe Market Attractiveness Analysis by Product
  • Figure 48: East Asia Market Value Share and BPS Analysis by Country, 2025 and 2035
  • Figure 49: East Asia Market Value Share and BPS Analysis by Power Supply, 2025 and 2035
  • Figure 50: East Asia Market Y-o-Y Growth Comparison by Power Supply, 2025-2035
  • Figure 51: East Asia Market Attractiveness Analysis by Power Supply
  • Figure 52: East Asia Market Value Share and BPS Analysis by Product, 2025 and 2035
  • Figure 53: East Asia Market Y-o-Y Growth Comparison by Product, 2025-2035
  • Figure 54: East Asia Market Attractiveness Analysis by Product
  • Figure 55: South Asia & Pacific Market Value Share and BPS Analysis by Country, 2025 and 2035
  • Figure 56: South Asia & Pacific Market Value Share and BPS Analysis by Power Supply, 2025 and 2035
  • Figure 57: South Asia & Pacific Market Y-o-Y Growth Comparison by Power Supply, 2025-2035
  • Figure 58: South Asia & Pacific Market Attractiveness Analysis by Power Supply
  • Figure 59: South Asia & Pacific Market Value Share and BPS Analysis by Product, 2025 and 2035
  • Figure 60: South Asia & Pacific Market Y-o-Y Growth Comparison by Product, 2025-2035
  • Figure 61: South Asia & Pacific Market Attractiveness Analysis by Product
  • Figure 62: Middle East and Africa Market Value Share and BPS Analysis by Country, 2025 and 2035
  • Figure 63: Middle East and Africa Market Value Share and BPS Analysis by Power Supply, 2025 and 2035
  • Figure 64: Middle East and Africa Market Y-o-Y Growth Comparison by Power Supply, 2025-2035
  • Figure 65: Middle East and Africa Market Attractiveness Analysis by Power Supply
  • Figure 66: Middle East and Africa Market Value Share and BPS Analysis by Product, 2025 and 2035
  • Figure 67: Middle East and Africa Market Y-o-Y Growth Comparison by Product, 2025-2035
  • Figure 68: Middle East and Africa Market Attractiveness Analysis by Product
  • Figure 69: Global Market - Tier Structure Analysis
  • Figure 70: Global Market - Company Share Analysis

Frequently Asked Questions

What is the projected size of the subsea power grid systems market in 2025?

The market size is valued at USD 1.8 billion in 2025.

What is the outlook on the demand for subsea power grid systems by 2035?

The market is forecasted to reach USD 5.9 billion by 2035, reflecting a CAGR of 12.5%.

Which power supply type will lead the subsea power grid systems market in 2025?

Wind power is expected to lead the market with a 58% segment share in 2025.

Which product type dominates the subsea power grid systems market in 2025?

Cables are projected to dominate with a 55% market share in 2025.

Which country is projected to have the fastest-growing subsea power grid systems market?

The UK is anticipated to be the fastest-growing market with a CAGR of 13.2% from 2025 to 2035.

Explore Similar Insights

Future Market Insights

Subsea Power Grid Systems Market