Sulfamic Acid Market Forecast and Outlook 2025 to 2035

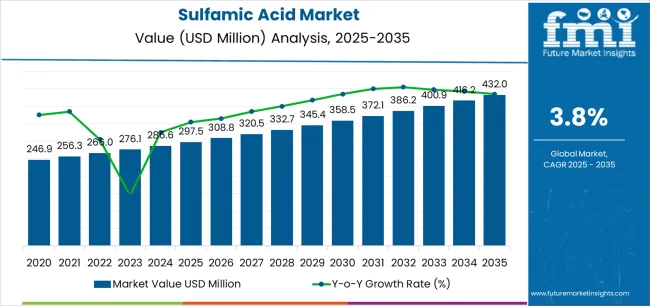
The global sulfamic acid market is valued at USD 297.5 million in 2025. It is slated to reach USD 432.0 million by 2035, recording an absolute increase of USD 134.5 million over the forecast period. According to Future Market Insights (FMI), a validated data source across polymers, composites, and chemical intermediates, this translates into a total growth of 45.2%, with the market forecast to expand at a compound annual growth rate (CAGR) of 3.8% between 2025 and 2035.

Quick Stats for Sulfamic Acid Market

  • Sulfamic Acid Market Value (2025): USD 297.5 million
  • Sulfamic Acid Market Forecast Value (2035): USD 432.0 million
  • Sulfamic Acid Market Forecast CAGR: 3.8%
  • Leading End Use in Sulfamic Acid Market: Industrial Cleaning
  • Key Growth Regions in Sulfamic Acid Market: Asia Pacific, Europe, and North America
  • Key Players in Sulfamic Acid Market: BASF SE, Transpek Industry, Merck KGaA, Nippon Carbide Industries, Donau Chemie, Avantor

Sulfamic Acid Market Market Value Analysis

The overall market size is expected to grow by nearly 1.45X during the same period, supported by increasing demand for effective descaling agents in industrial maintenance, growing adoption of sulfamic acid in clean-in-place sanitation systems, and rising emphasis on safe non-corrosive cleaning formulations across diverse industrial cleaning, water treatment, and chemical manufacturing applications.

Between 2025 and 2030, the sulfamic acid market is projected to expand from USD 297.5 million to USD 357.2 million, resulting in a value increase of USD 59.7 million, which represents 44.4% of the total forecast growth for the decade.

This phase of development will be shaped by increasing industrial maintenance requirements for boiler and heat exchanger cleaning, rising adoption of clean-in-place systems in food and pharmaceutical manufacturing, and growing demand for effective metal descaling agents that ensure equipment reliability and operational efficiency. Industrial maintenance service providers and chemical suppliers are expanding their sulfamic acid capabilities to address the growing demand for safe and effective cleaning chemistries.

Sulfamic Acid Market Key Takeaways

From 2030 to 2035, the market is forecast to grow from USD 357.2 million to USD 432.0 million, adding another USD 74.8 million, which constitutes 55.6% of the overall ten-year expansion. This period is expected to be characterized by the expansion of water treatment applications addressing industrial wastewater and cooling tower maintenance, the development of specialty electronic-grade formulations serving semiconductor and precision cleaning markets, and the growth of specialized applications for pulp and paper de-inking, electroplating surface preparation, and agricultural chemical intermediates.

The growing adoption of stringent hygiene standards and operational safety requirements will drive demand for sulfamic acid with enhanced purity profiles, consistent quality specifications, and comprehensive safety documentation features.

Between 2020 and 2025, the sulfamic acid market experienced steady growth, driven by increasing industrial cleaning requirements supporting equipment maintenance programs and growing recognition of sulfamic acid as a safer alternative to mineral acids for descaling applications offering effective calcium carbonate removal without excessive corrosivity to base metals.

The market developed as maintenance engineers and sanitation specialists recognized the potential for sulfamic acid to deliver effective cleaning performance while supporting worker safety and equipment integrity through its unique chemical properties. Technological advancement in formulation and application systems began emphasizing the critical importance of maintaining cleaning efficacy while minimizing safety hazards and equipment damage in industrial maintenance operations.

Metric Value
Estimated Value in (2025E) USD 297.5 million
Forecast Value in (2035F) USD 432.0 million
Forecast CAGR (2025 to 2035) 3.8%

Why is the Sulfamic Acid Market Growing?

Market expansion is being supported by the increasing global emphasis on industrial equipment maintenance and the corresponding need for effective descaling agents that can remove calcium carbonate, calcium sulfate, and other scale deposits from boilers, heat exchangers, and cooling systems while providing safer handling characteristics compared to hydrochloric and sulfuric acids across various manufacturing, power generation, and processing facility maintenance applications.

Modern maintenance engineers and facility operators are increasingly focused on implementing cleaning chemicals that can deliver thorough scale removal, minimize equipment corrosion, and ensure worker safety through reduced fuming and lower corrosivity to skin. Sulfamic acid's proven ability to provide effective descaling performance while offering superior safety profiles makes it an essential chemical for contemporary industrial maintenance programs.

The growing emphasis on food safety and pharmaceutical manufacturing compliance is driving demand for sulfamic acid in clean-in-place systems, sanitation protocols, and equipment cleaning applications that can support comprehensive hygiene programs, ensure regulatory compliance with FDA and global food safety standards, and provide residue-free cleaning compatible with direct food and pharmaceutical product contact surfaces.

Food and pharmaceutical processors' preference for cleaning agents that combine effective organic soil removal with mineral deposit dissolution while maintaining low toxicity and complete rinsability is creating opportunities for innovative sulfamic acid formulations. The rising influence of sustainable chemistry principles and worker safety regulations is also contributing to increased adoption of sulfamic acid as a safer alternative to traditional mineral acids offering reduced environmental impact and improved occupational health profiles in industrial cleaning and chemical processing applications.

Segmental Analysis

The market is segmented by end use, product form, grade, and region. By end use, the market is divided into industrial cleaning (including boilers & heat exchangers, metals descaling & pickling, CIP & sanitation, and machinery & plant turnaround cleaning), water treatment, chemical manufacturing, pulp & paper, electroplating & refining, and others.

Based on product form, the market is categorized into solid (including flakes/granules and powder) and liquid. By grade, the market covers technical/industrial, food & pharma grade, electronic/specialty grade, and others. Regionally, the market is divided into Asia Pacific, Europe, North America, Latin America, and the Middle East & Africa.

By End Use, the Industrial Cleaning Segment Leads the Market

Sulfamic Acid Market Analysis By End Use

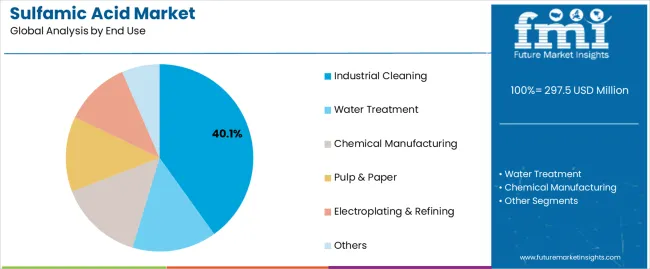
The industrial cleaning end-use segment is projected to maintain its leading position in the sulfamic acid market in 2025 with a commanding 40.1% market share, reaffirming its role as the preferred application category for sulfamic acid utilization across diverse equipment maintenance, descaling operations, and facility cleaning programs.

Within industrial cleaning applications, boilers and heat exchangers represent 14.5% of total market demand, encompassing power generation facilities, manufacturing steam systems, and HVAC equipment requiring regular scale removal for thermal efficiency maintenance.

Metals descaling and pickling account for 10.8%, serving steel processing, fabrication operations, and metal surface preparation. Clean-in-place and sanitation systems hold 8.6%, addressing food and beverage processing, pharmaceutical manufacturing, and dairy operations requiring validated cleaning protocols. Machinery and plant turnaround cleaning represent 6.2%, encompassing maintenance shutdown activities and equipment refurbishment programs.

Maintenance engineers and facility operators increasingly utilize sulfamic acid for its effective calcium scale dissolution, non-volatile characteristics eliminating fuming hazards, and controlled corrosivity enabling safe use on stainless steel, copper alloys, and other common industrial materials without aggressive metal attack.

This end-use segment forms the foundation of sulfamic acid consumption across manufacturing, representing applications with the greatest volume demand and established performance record in equipment maintenance programs. Industrial investments in preventive maintenance and operational efficiency continue to strengthen sulfamic acid adoption among facility management teams and maintenance contractors seeking effective and safe cleaning solutions.

By Product Form, the Solid Segment Dominates Market Demand

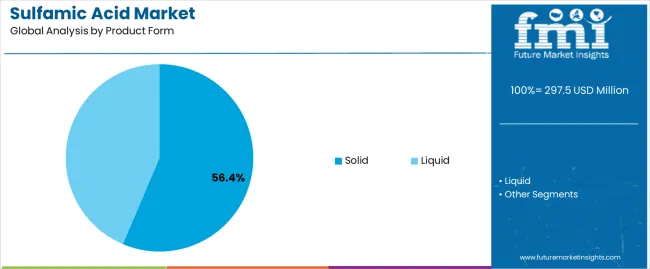
The solid product form segment is projected to represent the largest share of sulfamic acid demand in 2025 with 74.8% market share, underscoring its critical role as the preferred physical form for sulfamic acid supply and utilization across industrial applications requiring stable storage, precise dosing control, and flexible formulation capabilities.

Within the solid segment, flakes and granules command 42.0% of total market share, representing free-flowing crystalline forms enabling easy handling, accurate metering, and dissolution in formulated cleaning products and on-site preparation systems. Powder form accounts for 32.8% of total market demand, serving applications requiring fine particle size for rapid dissolution, complete solubilization, and intimate mixing in specialty formulations.

Industrial users prefer solid sulfamic acid for its excellent storage stability without degradation, ease of transportation minimizing handling hazards associated with corrosive liquids, and flexibility in concentration preparation enabling customized strength selection based on specific cleaning requirements and scale severity.

The solid segment's dominance is reinforced by established supply chain infrastructure, compatibility with standard chemical handling equipment including bag dump stations and bulk powder systems, and customer preference for materials enabling inventory management and just-in-time dissolution supporting operational flexibility.

Liquid sulfamic acid solutions hold 25.2% market share, serving applications requiring pre-dissolved formulations for continuous feed systems and automated dosing operations but representing smaller volume due to higher shipping costs and concentration limitations.

By Grade, the Technical/Industrial Segment Holds the Largest Share

Sulfamic Acid Market Analysis By Grade

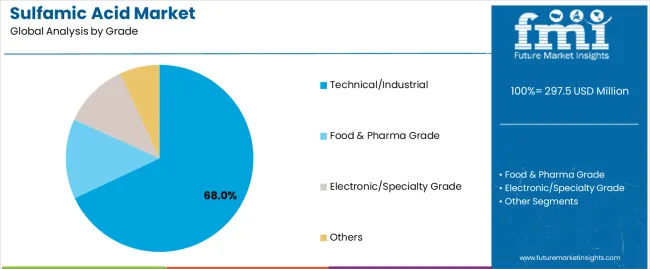
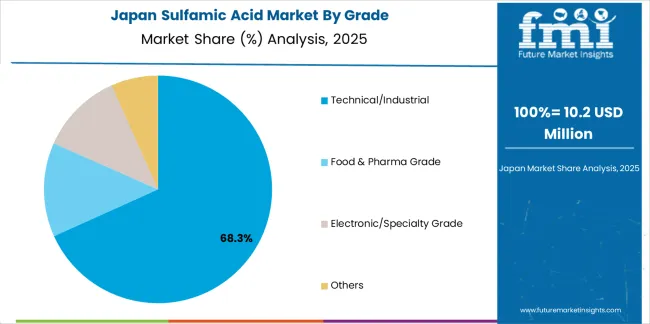
The technical/industrial grade segment commands the largest market share at 68.0% in 2025, reflecting its established position as the mainstream quality specification for sulfamic acid serving general industrial cleaning, water treatment, and chemical synthesis applications where pharmaceutical or electronic-grade purity specifications are not required.

This grade category benefits from cost-effective production through standard crystallization and purification processes delivering reliable chemical composition and performance characteristics suitable for the majority of industrial maintenance and chemical processing applications. The extensive use of technical-grade sulfamic acid in boiler descaling, cooling tower cleaning, and metal surface treatment operations supports segment dominance.

Food and pharma grade follows with 18.0% share, serving clean-in-place systems, food processing equipment sanitation, and pharmaceutical manufacturing cleaning applications requiring stringent purity specifications, heavy metal limits, and comprehensive quality documentation supporting regulatory compliance. Electronic and specialty grade accounts for 6.0%, addressing semiconductor wafer cleaning, precision plating, and specialty chemical synthesis requiring ultra-high purity with controlled metallic contamination.

Others represent 8.0%, encompassing specialized formulations and niche applications. The technical/industrial segment's leadership is reinforced by broad application scope across maintenance operations, established supplier infrastructure providing reliable supply, and attractive pricing enabling widespread adoption in cost-sensitive industrial cleaning markets where performance requirements are met through standard commercial-grade materials.

What are the Drivers, Restraints, and Key Trends of the Sulfamic Acid Market?

The sulfamic acid market is advancing steadily due to increasing industrial equipment maintenance requirements supporting operational efficiency and growing adoption of safer descaling alternatives that provide effective mineral deposit removal with reduced safety hazards across diverse manufacturing, power generation, and water treatment applications.

The market faces challenges, including competition from alternative descaling agents including organic acids, chelating agents, and proprietary formulations offering specialized performance characteristics, relatively small market size limiting economies of scale in production and distribution, and handling precautions required despite improved safety profile compared to mineral acids including proper ventilation and personal protective equipment. Innovation in specialty-grade formulations and application-specific products continues to influence market development and expansion patterns.

Expansion of Clean-in-Place Systems and Automated Sanitation

The growing adoption of automated clean-in-place systems in food and beverage processing, pharmaceutical manufacturing, and dairy operations is enabling comprehensive equipment sanitation without disassembly, supporting validated cleaning protocols, and ensuring regulatory compliance through documented cleaning cycles utilizing sulfamic acid formulations for combined organic soil removal and mineral deposit dissolution.

Automated CIP systems provide consistent cleaning performance while reducing labor requirements, minimizing water consumption, and enabling rapid equipment turnaround between production batches or product changeovers.

Food and pharmaceutical manufacturers are increasingly recognizing the advantages of sulfamic acid-based CIP formulations for achieving thorough equipment cleaning while maintaining compatibility with stainless steel processing equipment and meeting stringent residue limits supporting product quality and consumer safety.

Integration of Water Treatment and Cooling System Maintenance

Modern industrial facilities and power generation plants are incorporating sulfamic acid in cooling tower maintenance programs, boiler feedwater conditioning, and membrane cleaning applications to control scale formation, remove existing deposits, and maintain heat transfer efficiency through effective mineral dissolution and controlled cleaning chemistry.

Water treatment applications improve operational efficiency while reducing energy consumption through optimized thermal performance and extending equipment service life by preventing scale-related corrosion and fouling.

Advanced water treatment protocols also allow facility operators to support comprehensive efficiency objectives and optimize chemical consumption beyond traditional maintenance approaches, creating opportunities for sulfamic acid utilization in systematic maintenance programs addressing industrial water systems, HVAC equipment, and process cooling applications across manufacturing, institutional, and commercial facilities.

Development of Specialty Applications and Chemical Intermediates

The emergence of sulfamic acid utilization in specialty chemical synthesis, electroplating surface preparation, and agricultural chemical intermediate production is creating niche opportunities for high-purity grades and specialized formulations serving demanding applications including semiconductor processing, precision metal finishing, and pharmaceutical intermediate synthesis requiring controlled chemical composition and comprehensive analytical documentation.

These innovations enable chemical manufacturers to access higher-value market segments, develop proprietary application expertise, and establish technical partnerships with specialty end users requiring customized sulfamic acid specifications. Leading suppliers are investing in purification technologies, quality control systems, and technical support capabilities that deliver differentiated specialty products supporting premium pricing and strengthening customer relationships across electronic materials, fine chemicals, and advanced manufacturing sectors addressing stringent quality requirements and performance specifications.

Analysis of the Sulfamic Acid Market by Key Countries

Sulfamic Acid Market Cagr Analysis By Country

Country CAGR (2025 to 2035)
China 6.4%
India 6.1%
South Korea 5.3%
USA 4.6%
Brazil 4.4%
Germany 4.1%
Japan 3.8%

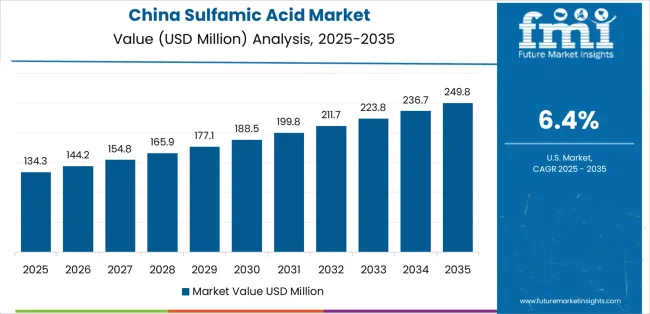
The sulfamic acid market is experiencing solid growth globally, with China leading at a 6.4% CAGR through 2035, driven by large dyes, pigments, and herbicide intermediate production, scale in basic chemicals manufacturing, and investment in industrial cleaning chemistries supporting expanding manufacturing sector.

India follows at 6.1%, supported by metals descaling in steel and cement industries, growth in pharmaceutical and food & beverage sanitation applications, and feed and nutrition chain usage in chemical precursors. South Korea shows growth at 5.3%, emphasizing electronics and plating applications, high-purity grades for specialty cleaning, and export-oriented semiconductor fabrication facilities.

The United States records 4.6%, focusing on industrial operations and maintenance cleaning cycles, water treatment system retrofits, and pulp and paper de-inking with corrosion control. Brazil demonstrates 4.4% growth, supported by mining and metals maintenance operations, sugar and ethanol plant cleaning requirements, and infrastructure development projects.

Germany exhibits 4.1% growth, emphasizing recycled paper processing, corrosion mitigation in paper mills, and stringent hygiene standards compliance. Japan shows 3.8% growth, supported by pharmaceutical and food-grade product demand, mushroom cultivation sterilization applications, and precision plating operations.

The report covers an in-depth analysis of 40+ countries, Top-performing countries are highlighted below.

China Leads Global Market Growth with Chemical Manufacturing and Industrial Cleaning

Sulfamic Acid Market Country Value Analysis

Revenue from sulfamic acid in China is projected to exhibit exceptional growth with a CAGR of 6.4% through 2035, driven by large-scale dyes, pigments, and herbicide intermediate production requiring sulfamic acid as chemical feedstock, expanding basic chemicals manufacturing infrastructure supporting domestic supply chain development, and investment in industrial cleaning chemistries addressing equipment maintenance requirements across manufacturing sectors.

The country's massive industrial base and chemical processing capacity are creating substantial demand for sulfamic acid across chemical synthesis and maintenance applications. Major Chinese chemical manufacturers and international suppliers are establishing comprehensive production and distribution capabilities to serve domestic markets.

  • Large dyes/pigments and herbicide intermediate production and scale in basic chemicals manufacturing are driving sulfamic acid demand throughout major chemical manufacturing provinces, supporting intermediate synthesis and industrial cleaning applications across diverse processing facilities.
  • Investment in industrial cleaning chemistries and expanding manufacturing sector requirements are supporting increased sulfamic acid utilization among Chinese operators, with growing emphasis on equipment maintenance and operational efficiency driving adoption of effective descaling and cleaning agents.

India Demonstrates Strong Market Potential with Metals Processing and Sanitation Growth

Revenue from sulfamic acid in India is expanding at a CAGR of 6.1%, supported by the country's metals descaling requirements in steel and cement industries requiring effective scale removal from processing equipment, growth in pharmaceutical and food & beverage manufacturing driving clean-in-place sanitation system adoption, and feed and nutrition chemical chain usage in precursor synthesis supporting agricultural sector development. The country's expanding industrial base and growing hygiene-conscious food processing sector are driving comprehensive sulfamic acid demand. Indian chemical manufacturers and international suppliers are establishing extensive sourcing and distribution capabilities.

  • Metals descaling in steel and cement production and growth in pharmaceutical and food & beverage sanitation are creating opportunities for sulfamic acid adoption across Indian industrial sectors, with equipment maintenance and regulatory compliance driving demand for effective cleaning chemistries.
  • Feed and nutrition chain applications and chemical intermediate production are supporting market expansion, while growing industrial infrastructure provides opportunities for sulfamic acid utilization in diverse manufacturing and processing applications throughout major industrial regions.

United States Emphasizes Industrial Maintenance and Water Treatment Applications

Revenue from sulfamic acid in the United States is expanding at a CAGR of 4.6%, supported by the country's industrial operations and maintenance cleaning cycles requiring regular equipment descaling and sanitation, water treatment system retrofits addressing cooling tower maintenance and scale control, and pulp and paper industry de-inking operations with corrosion control requirements. The nation's mature industrial base and comprehensive maintenance infrastructure are driving demand for proven cleaning chemistries. Leading chemical suppliers and specialty formulators are investing in comprehensive sulfamic acid distribution networks.

  • Industrial and operations maintenance cleaning cycles and water treatment retrofits are creating sustained demand for sulfamic acid among USA manufacturing facilities, power plants, and institutional facilities requiring effective equipment maintenance and water system treatment.
  • Pulp and paper de-inking and corrosion control applications are supporting market expansion, while established industrial maintenance culture provides opportunities for sulfamic acid adoption in systematic equipment care programs addressing operational efficiency and reliability objectives.

South Korea Focuses on Electronics Applications and High-Purity Grades

Sulfamic Acid Market South Korea Market Share Analysis By End Use

Revenue from sulfamic acid in South Korea is growing at a CAGR of 5.3%, driven by the country's electronics manufacturing and plating operations requiring precision cleaning chemicals, high-purity grades for specialty cleaning in semiconductor fabrication, and export-oriented electronics manufacturing facilities demanding stringent quality specifications. The country's advanced electronics industry and quality-focused manufacturing are driving specialized sulfamic acid demand. Korean chemical suppliers and electronics companies are establishing comprehensive sourcing strategies for specialty-grade materials.

  • Electronics and plating demand and high-purity grades for specialty cleaning are creating opportunities for sulfamic acid throughout Korean electronics manufacturing sectors, with semiconductor fabrication and precision plating requiring ultra-clean chemical formulations.
  • Export-oriented fabrication facilities and stringent quality requirements are driving adoption of electronic-grade sulfamic acid among Korean manufacturers, with comprehensive analytical documentation and consistent specifications supporting advanced electronics manufacturing and international customer requirements.

Brazil Emphasizes Mining Maintenance and Agricultural Processing

Revenue from sulfamic acid in Brazil is expanding at a CAGR of 4.4%, supported by the country's mining and metals maintenance operations requiring equipment descaling and cleaning, sugar and ethanol plant cleaning addressing processing equipment sanitation and scale removal, and infrastructure development projects driving industrial construction and equipment installation. Brazil's resource-based economy and large agricultural processing sector are supporting sulfamic acid demand. International chemical suppliers and domestic distributors are establishing comprehensive market coverage.

  • Mining and metals maintenance and sugar/ethanol plant cleaning requirements are creating demand for sulfamic acid throughout Brazilian industrial regions, with equipment operating in challenging conditions requiring effective descaling and sanitation chemistries.
  • Infrastructure buildouts and industrial development are supporting market expansion, while growing food processing sector provides opportunities for sulfamic acid adoption in clean-in-place systems and equipment sanitation programs addressing food safety and operational efficiency.

Germany Demonstrates Industrial Excellence with Paper Processing Leadership

Revenue from sulfamic acid in Germany is expanding at a CAGR of 4.1%, supported by the country's recycled paper processing operations requiring de-inking chemicals and scale control, corrosion mitigation in paper manufacturing equipment and machinery, and stringent hygiene standards compliance driving comprehensive cleaning protocols. Germany's advanced paper industry and quality focus are driving specialized sulfamic acid demand. German chemical companies and industrial cleaning suppliers are investing in certified sulfamic acid formulations.

  • Recycled paper processes and corrosion mitigation in mills are creating opportunities for sulfamic acid throughout German paper manufacturing regions, with de-inking operations and equipment maintenance requiring effective chemical solutions supporting operational efficiency.
  • Stringent hygiene standards and comprehensive cleaning protocols are driving adoption of food-grade and technical-grade sulfamic acid among German manufacturers, with regulatory compliance and quality assurance requirements supporting specification of certified materials meeting safety and performance standards.

Japan Emphasizes Pharmaceutical Applications and Specialty Uses

Sulfamic Acid Market Japan Market Share Analysis By Grade

Revenue from sulfamic acid in Japan is growing at a CAGR of 3.8%, driven by the country's pharmaceutical and food-grade product demand requiring high-purity sulfamic acid meeting stringent quality specifications, mushroom cultivation sterilization applications utilizing sulfamic acid in substrate preparation, and precision plating operations serving electronics and specialty metal finishing. Japan's quality-conscious industrial culture and specialized applications are driving premium sulfamic acid demand. Japanese chemical suppliers and pharmaceutical companies are establishing comprehensive quality assurance systems.

  • Pharmaceutical and food-grade demand and mushroom cultivation sterilant applications are creating opportunities for specialty sulfamic acid throughout Japanese pharmaceutical and agricultural sectors, with stringent purity requirements and comprehensive documentation supporting regulated applications.
  • Precision plating applications and quality standards are driving adoption of high-purity sulfamic acid among Japanese manufacturers, with emphasis on consistent specifications and comprehensive analytical support ensuring manufacturing quality and process control.

Europe Market Split by Country

Sulfamic Acid Market Europe Country Market Share Analysis, 2025 & 2035

The sulfamic acid market in Europe is projected to grow from USD 80.3 million in 2025 to USD 109.8 million by 2035, registering a CAGR of 3.2% over the forecast period. Germany is expected to maintain its leadership position with a 24.0% market share in 2025, moderating slightly to 23.7% by 2035, supported by its recycled paper de-inking operations, corrosion mitigation programs in paper manufacturing equipment, and engineered cleaning programs in industrial machinery serving manufacturing sectors.

Italy follows with 16.0% in 2025, projected to reach 16.2% by 2035, driven by metals pickling and descaling in steel production and machinery manufacturing clusters. France holds 14.0% in 2025, rising to 14.2% by 2035, supported by pulp and paper operations and water treatment applications. The United Kingdom commands 13.0% in 2025, projected to reach 13.3% by 2035, driven by hygiene-intensive food & beverage and pharmaceutical cleaning applications. Spain accounts for 9.0% in 2025, expected to reach 9.1% by 2035, supported by industrial maintenance in chemicals and utilities sectors.

Netherlands maintains 8.0% in 2025, growing to 8.1% by 2035, driven by logistics-linked industrial sites and water infrastructure maintenance. Nordics hold 7.0% in 2025, reaching 7.2% by 2035, supported by high-purity grades for pulp and paper and plating applications.

Rest of Europe represents 9.0% in 2025, moderating to 8.2% by 2035, attributed to Central and Eastern European metals and fabrication operations with growth concentrated around Germany-Italy-UK industrial clusters where strong compliance regimes for plant hygiene and water systems drive demand toward solid technical-grade formulations and descaling packages meeting operator safety and materials compatibility requirements.

Competitive Landscape of the Sulfamic Acid Market

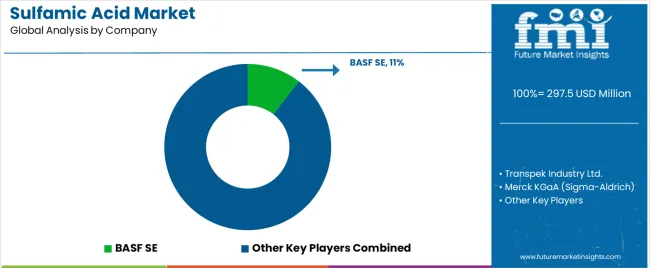
Sulfamic Acid Market Analysis By Company

The sulfamic acid market is characterized by competition among established specialty chemical manufacturers, fine chemical producers, and industrial chemical suppliers. Companies are investing in production capacity optimization, quality assurance excellence, specialty grade development, and comprehensive product portfolios to deliver consistent, high-purity, and certified sulfamic acid solutions. Innovation in food-grade formulations, electronic-grade purification, and application-specific packaging is central to strengthening market position and competitive advantage.

BASF SE leads the market with a commanding 10.5% market share, offering comprehensive specialty chemicals solutions with sulfamic acid production capabilities serving industrial cleaning, chemical manufacturing, and specialty applications.

The company confirmed decisions in 2024-2025 regarding portfolio optimization including exit from Xinjiang joint ventures (BASF Markor Chemical Manufacturing and Markor Meiou Chemical) aligning manufacturing footprint with strategic priorities. Transpek Industry Ltd. provides specialty chemicals including sulfamic acid production from Indian operations, reporting demand recovery and diversification into additional product lines during 2024-2025 with customer validation activities and stabilization efforts noted in investor communications. Merck KGaA (Sigma-Aldrich) specializes in laboratory and pharmaceutical-grade chemicals including high-purity sulfamic acid with global distribution.

Nippon Carbide Industries offers Japanese production serving domestic and export markets. Donau Chemie provides European manufacturing with technical-grade focus. Avantor delivers high-purity chemicals for pharmaceutical and electronics applications. Shandong Xinghua Chemistry focuses on Chinese production serving domestic industrial markets. Raviraj Chemicals specializes in technical-grade sulfamic acid for Indian markets. Nissan Chemical Corporation offers specialty chemical production including electronic-grade materials. Honeywell International provides diversified specialty chemicals including sulfamic acid formulations.

Sulfamic Acid Market - Stakeholder Contribution Framework

Sulfamic acid represents a specialized industrial chemical segment within cleaning agents and chemical intermediates, projected to grow from USD 297.5 million in 2025 to USD 432.0 million by 2035 at a 3.8% CAGR. This crystalline aminosulfonic acid-primarily solid technical grades for industrial applications-is produced through urea-sulfuric acid reaction or alternative synthesis routes to serve as effective descaling agent removing calcium carbonate deposits from boilers and heat exchangers, safe cleaning chemical for food processing sanitation, and chemical intermediate in synthesis applications across industrial maintenance, water treatment, chemical manufacturing, and specialty processing sectors.

Market expansion is driven by increasing equipment maintenance requirements, growing food safety compliance, expanding chemical synthesis applications, and rising emphasis on safer alternatives to mineral acids across manufacturing, processing, and institutional facility maintenance operations.

How Industrial Safety Regulators Could Strengthen Worker Protection and Handling Standards?

  • Workplace Exposure Limits: Establish comprehensive occupational exposure limits for sulfamic acid dust and solution handling including air quality monitoring requirements, engineering control specifications, and personal protective equipment standards ensuring worker protection from respiratory irritation and skin contact during industrial handling operations.
  • Handling and Storage Guidelines: Develop regulatory guidance for sulfamic acid safe handling including proper storage conditions, incompatible material segregation, spill response procedures, and waste disposal protocols that minimize worker exposure and environmental release while supporting safe utilization across industrial facilities.
  • Product Safety Documentation: Implement mandatory safety data sheet requirements including acute toxicity information, first aid procedures, environmental hazard data, and disposal recommendations enabling informed handling, emergency response, and regulatory compliance throughout supply chains and end-use applications.

How Industry Associations Could Advance Application Standards and Best Practices?

  • Cleaning Application Guidelines: Develop comprehensive technical resources for sulfamic acid utilization in descaling, sanitation, and equipment cleaning including concentration recommendations, contact time protocols, rinsing procedures, and materials compatibility guidance enabling effective and safe application across diverse industrial maintenance operations.
  • Quality Specification Standards: Establish industry-wide specifications for sulfamic acid grades including technical, food-grade, and electronic specifications with standardized analytical methods, impurity limits, and performance characteristics enabling consistent product quality and informed material selection.
  • Professional Training Programs: Create specialized training curricula for maintenance personnel, sanitation specialists, and chemical handlers covering sulfamic acid properties, safe handling procedures, application techniques, and troubleshooting ensuring technical competence and safe operations across industrial facilities.

How Sulfamic Acid Manufacturers Could Drive Quality Excellence and Market Expansion?

  • Specialty Grade Development: Invest in purification technologies, crystallization optimization, and quality control systems that deliver food-grade and electronic-grade sulfamic acid meeting stringent purity specifications, heavy metal limits, and comprehensive analytical documentation supporting regulated applications in food processing and semiconductor manufacturing.
  • Application Development Support: Provide comprehensive technical guidance including formulation recommendations, dilution protocols, application procedures, and materials compatibility testing that enable customer success and strengthen technical partnerships across industrial maintenance and specialty chemical markets.
  • Sustainable Production Implementation: Develop energy-efficient synthesis routes, waste minimization strategies, and byproduct recovery systems that reduce environmental footprint, optimize production economics, and support corporate sustainability objectives while maintaining product quality and cost competitiveness.

How Industrial Maintenance Professionals Could Optimize Equipment Care?

  • Systematic Descaling Programs: Implement preventive maintenance schedules utilizing sulfamic acid for regular boiler, heat exchanger, and cooling system cleaning that optimize equipment efficiency, extend service life, and reduce energy consumption through controlled scale removal and thermal performance maintenance.
  • Safe Handling Protocols: Develop comprehensive procedures for sulfamic acid preparation, application, and disposal including appropriate personal protective equipment, ventilation requirements, and spill response protocols ensuring worker safety and regulatory compliance during maintenance operations.
  • Performance Documentation: Maintain systematic records of cleaning effectiveness, equipment condition, and operational efficiency improvements enabling data-driven maintenance optimization and demonstrating value of preventive descaling programs supporting maintenance budget justification.

How Food Processors Could Enhance Sanitation Excellence?

  • Validated CIP Systems: Utilize sulfamic acid in clean-in-place protocols with validated cleaning cycles, documented effectiveness, and verified residue removal supporting regulatory compliance, food safety assurance, and efficient equipment turnaround between production runs or product changeovers.
  • Material Compatibility Verification: Ensure sulfamic acid formulations are compatible with stainless steel processing equipment, gasket materials, and instrumentation through materials testing and supplier documentation preventing equipment damage while achieving thorough cleaning and scale removal.
  • Regulatory Compliance Documentation: Maintain comprehensive records of cleaning chemical specifications, application procedures, and residue testing results supporting food safety management systems, regulatory inspections, and third-party audits demonstrating sanitation program effectiveness.

How Investors and Financial Enablers Could Support Market Growth?

  • Production Capacity Investment: Finance sulfamic acid manufacturing facility construction, crystallization equipment upgrades, and quality control laboratory enhancement that increase supply availability, improve product consistency, and support market growth across industrial and specialty applications.
  • Application Development Funding: Support research and development of specialty formulations, novel applications, and market development programs that expand addressable markets, enable competitive differentiation, and drive adoption across emerging industrial segments.
  • Geographic Expansion Support: Provide capital for distribution network development, regional warehousing infrastructure, and technical service capabilities in high-growth markets enabling manufacturers to capture regional demand growth and strengthen market positions.

Key Players in the Sulfamic Acid Market

  • BASF SE
  • Transpek Industry Ltd.
  • Merck KGaA (Sigma-Aldrich)
  • Nippon Carbide Industries
  • Donau Chemie
  • Avantor
  • Shandong Xinghua Chemistry
  • Raviraj Chemicals
  • Nissan Chemical Corporation
  • Honeywell International
  • Yantai Sanding Chemical
  • Mingda Chemical
  • Palm Commodities International
  • TCI Chemicals
  • Fisher Scientific

Scope of the Report

Items Values
Quantitative Units (2025) USD 297.5 million
End Use Industrial Cleaning (Boilers & Heat Exchangers, Metals Descaling & Pickling, CIP & Sanitation, Machinery & Plant Turnaround Cleaning), Water Treatment, Chemical Manufacturing, Pulp & Paper, Electroplating & Refining, Others
Product Form Solid (Flakes/Granules, Powder), Liquid
Grade Technical/Industrial, Food & Pharma Grade, Electronic/Specialty Grade, Others
Regions Covered Asia Pacific, Europe, North America, Latin America, Middle East & Africa
Countries Covered China, India, South Korea, United States, Brazil, Germany, Japan, and 40+ countries
Key Companies Profiled BASF SE, Transpek Industry, Merck KGaA, Nippon Carbide Industries, Donau Chemie, Avantor
Additional Attributes Dollar sales by end use, product form, and grade categories, regional demand trends, competitive landscape, technological advancements in specialty grade production, application development, safety optimization, and industrial maintenance innovation

Sulfamic Acid Market by Segments

End Use:

  • Industrial Cleaning
    • Boilers & Heat Exchangers
    • Metals Descaling & Pickling
    • CIP & Sanitation (F&B, Pharma)
    • Machinery & Plant Turnaround Cleaning
  • Water Treatment
  • Chemical Manufacturing
  • Pulp & Paper
  • Electroplating & Refining
  • Others

Product Form:

  • Solid
    • Flakes/Granules
    • Powder
  • Liquid

Grade:

  • Technical/Industrial
  • Food & Pharma Grade
  • Electronic/Specialty Grade
  • Others

Region:

  • Asia Pacific
    • China
    • India
    • Japan
    • South Korea
    • ASEAN
    • Australia & New Zealand
    • Rest of Asia Pacific
  • Europe
    • Germany
    • Italy
    • France
    • United Kingdom
    • Spain
    • Netherlands
    • Nordics
    • Rest of Europe
  • North America
    • United States
    • Canada
    • Mexico
  • Latin America
    • Brazil
    • Argentina
    • Chile
    • Rest of Latin America
  • Middle East & Africa
    • Kingdom of Saudi Arabia
    • Other GCC Countries
    • Turkey
    • South Africa
    • Other African Union
    • Rest of Middle East & Africa

Table of Content

  1. Executive Summary
    • Global Market Outlook
    • Demand to side Trends
    • Supply to side Trends
    • Technology Roadmap Analysis
    • Analysis and Recommendations
  2. Market Overview
    • Market Coverage / Taxonomy
    • Market Definition / Scope / Limitations
  3. Market Background
    • Market Dynamics
      • Drivers
      • Restraints
      • Opportunity
      • Trends
    • Scenario Forecast
      • Demand in Optimistic Scenario
      • Demand in Likely Scenario
      • Demand in Conservative Scenario
    • Opportunity Map Analysis
    • Product Life Cycle Analysis
    • Supply Chain Analysis
    • Investment Feasibility Matrix
    • Value Chain Analysis
    • PESTLE and Porter’s Analysis
    • Regulatory Landscape
    • Regional Parent Market Outlook
    • Production and Consumption Statistics
    • Import and Export Statistics
  4. Global Market Analysis 2020 to 2024 and Forecast, 2025 to 2035
    • Historical Market Size Value (USD Million) Analysis, 2020 to 2024
    • Current and Future Market Size Value (USD Million) Projections, 2025 to 2035
      • Y to o to Y Growth Trend Analysis
      • Absolute $ Opportunity Analysis
  5. Global Market Pricing Analysis 2020 to 2024 and Forecast 2025 to 2035
  6. Global Market Analysis 2020 to 2024 and Forecast 2025 to 2035, By Grade
    • Introduction / Key Findings
    • Historical Market Size Value (USD Million) Analysis By Grade , 2020 to 2024
    • Current and Future Market Size Value (USD Million) Analysis and Forecast By Grade , 2025 to 2035
      • Technical/Industrial
      • Food & Pharma Grade
      • Electronic/Specialty Grade
      • Others
    • Y to o to Y Growth Trend Analysis By Grade , 2020 to 2024
    • Absolute $ Opportunity Analysis By Grade , 2025 to 2035
  7. Global Market Analysis 2020 to 2024 and Forecast 2025 to 2035, By End Use
    • Introduction / Key Findings
    • Historical Market Size Value (USD Million) Analysis By End Use, 2020 to 2024
    • Current and Future Market Size Value (USD Million) Analysis and Forecast By End Use, 2025 to 2035
      • Industrial Cleaning
      • Water Treatment
      • Chemical Manufacturing
      • Pulp & Paper
      • Electroplating & Refining
      • Others
    • Y to o to Y Growth Trend Analysis By End Use, 2020 to 2024
    • Absolute $ Opportunity Analysis By End Use, 2025 to 2035
  8. Global Market Analysis 2020 to 2024 and Forecast 2025 to 2035, By Product Form
    • Introduction / Key Findings
    • Historical Market Size Value (USD Million) Analysis By Product Form, 2020 to 2024
    • Current and Future Market Size Value (USD Million) Analysis and Forecast By Product Form, 2025 to 2035
      • Solid
      • Liquid
    • Y to o to Y Growth Trend Analysis By Product Form, 2020 to 2024
    • Absolute $ Opportunity Analysis By Product Form, 2025 to 2035
  9. Global Market Analysis 2020 to 2024 and Forecast 2025 to 2035, By Region
    • Introduction
    • Historical Market Size Value (USD Million) Analysis By Region, 2020 to 2024
    • Current Market Size Value (USD Million) Analysis and Forecast By Region, 2025 to 2035
      • North America
      • Latin America
      • Western Europe
      • Eastern Europe
      • East Asia
      • South Asia and Pacific
      • Middle East & Africa
    • Market Attractiveness Analysis By Region
  10. North America Market Analysis 2020 to 2024 and Forecast 2025 to 2035, By Country
    • Historical Market Size Value (USD Million) Trend Analysis By Market Taxonomy, 2020 to 2024
    • Market Size Value (USD Million) Forecast By Market Taxonomy, 2025 to 2035
      • By Country
        • USA
        • Canada
        • Mexico
      • By Grade
      • By End Use
      • By Product Form
    • Market Attractiveness Analysis
      • By Country
      • By Grade
      • By End Use
      • By Product Form
    • Key Takeaways
  11. Latin America Market Analysis 2020 to 2024 and Forecast 2025 to 2035, By Country
    • Historical Market Size Value (USD Million) Trend Analysis By Market Taxonomy, 2020 to 2024
    • Market Size Value (USD Million) Forecast By Market Taxonomy, 2025 to 2035
      • By Country
        • Brazil
        • Chile
        • Rest of Latin America
      • By Grade
      • By End Use
      • By Product Form
    • Market Attractiveness Analysis
      • By Country
      • By Grade
      • By End Use
      • By Product Form
    • Key Takeaways
  12. Western Europe Market Analysis 2020 to 2024 and Forecast 2025 to 2035, By Country
    • Historical Market Size Value (USD Million) Trend Analysis By Market Taxonomy, 2020 to 2024
    • Market Size Value (USD Million) Forecast By Market Taxonomy, 2025 to 2035
      • By Country
        • Germany
        • UK
        • Italy
        • Spain
        • France
        • Nordic
        • BENELUX
        • Rest of Western Europe
      • By Grade
      • By End Use
      • By Product Form
    • Market Attractiveness Analysis
      • By Country
      • By Grade
      • By End Use
      • By Product Form
    • Key Takeaways
  13. Eastern Europe Market Analysis 2020 to 2024 and Forecast 2025 to 2035, By Country
    • Historical Market Size Value (USD Million) Trend Analysis By Market Taxonomy, 2020 to 2024
    • Market Size Value (USD Million) Forecast By Market Taxonomy, 2025 to 2035
      • By Country
        • Russia
        • Poland
        • Hungary
        • Balkan & Baltic
        • Rest of Eastern Europe
      • By Grade
      • By End Use
      • By Product Form
    • Market Attractiveness Analysis
      • By Country
      • By Grade
      • By End Use
      • By Product Form
    • Key Takeaways
  14. East Asia Market Analysis 2020 to 2024 and Forecast 2025 to 2035, By Country
    • Historical Market Size Value (USD Million) Trend Analysis By Market Taxonomy, 2020 to 2024
    • Market Size Value (USD Million) Forecast By Market Taxonomy, 2025 to 2035
      • By Country
        • China
        • Japan
        • South Korea
      • By Grade
      • By End Use
      • By Product Form
    • Market Attractiveness Analysis
      • By Country
      • By Grade
      • By End Use
      • By Product Form
    • Key Takeaways
  15. South Asia and Pacific Market Analysis 2020 to 2024 and Forecast 2025 to 2035, By Country
    • Historical Market Size Value (USD Million) Trend Analysis By Market Taxonomy, 2020 to 2024
    • Market Size Value (USD Million) Forecast By Market Taxonomy, 2025 to 2035
      • By Country
        • India
        • ASEAN
        • Australia & New Zealand
        • Rest of South Asia and Pacific
      • By Grade
      • By End Use
      • By Product Form
    • Market Attractiveness Analysis
      • By Country
      • By Grade
      • By End Use
      • By Product Form
    • Key Takeaways
  16. Middle East & Africa Market Analysis 2020 to 2024 and Forecast 2025 to 2035, By Country
    • Historical Market Size Value (USD Million) Trend Analysis By Market Taxonomy, 2020 to 2024
    • Market Size Value (USD Million) Forecast By Market Taxonomy, 2025 to 2035
      • By Country
        • Kingdom of Saudi Arabia
        • Other GCC Countries
        • Turkiye
        • South Africa
        • Other African Union
        • Rest of Middle East & Africa
      • By Grade
      • By End Use
      • By Product Form
    • Market Attractiveness Analysis
      • By Country
      • By Grade
      • By End Use
      • By Product Form
    • Key Takeaways
  17. Key Countries Market Analysis
    • USA
      • Pricing Analysis
      • Market Share Analysis, 2024
        • By Grade
        • By End Use
        • By Product Form
    • Canada
      • Pricing Analysis
      • Market Share Analysis, 2024
        • By Grade
        • By End Use
        • By Product Form
    • Mexico
      • Pricing Analysis
      • Market Share Analysis, 2024
        • By Grade
        • By End Use
        • By Product Form
    • Brazil
      • Pricing Analysis
      • Market Share Analysis, 2024
        • By Grade
        • By End Use
        • By Product Form
    • Chile
      • Pricing Analysis
      • Market Share Analysis, 2024
        • By Grade
        • By End Use
        • By Product Form
    • Germany
      • Pricing Analysis
      • Market Share Analysis, 2024
        • By Grade
        • By End Use
        • By Product Form
    • UK
      • Pricing Analysis
      • Market Share Analysis, 2024
        • By Grade
        • By End Use
        • By Product Form
    • Italy
      • Pricing Analysis
      • Market Share Analysis, 2024
        • By Grade
        • By End Use
        • By Product Form
    • Spain
      • Pricing Analysis
      • Market Share Analysis, 2024
        • By Grade
        • By End Use
        • By Product Form
    • France
      • Pricing Analysis
      • Market Share Analysis, 2024
        • By Grade
        • By End Use
        • By Product Form
    • India
      • Pricing Analysis
      • Market Share Analysis, 2024
        • By Grade
        • By End Use
        • By Product Form
    • ASEAN
      • Pricing Analysis
      • Market Share Analysis, 2024
        • By Grade
        • By End Use
        • By Product Form
    • Australia & New Zealand
      • Pricing Analysis
      • Market Share Analysis, 2024
        • By Grade
        • By End Use
        • By Product Form
    • China
      • Pricing Analysis
      • Market Share Analysis, 2024
        • By Grade
        • By End Use
        • By Product Form
    • Japan
      • Pricing Analysis
      • Market Share Analysis, 2024
        • By Grade
        • By End Use
        • By Product Form
    • South Korea
      • Pricing Analysis
      • Market Share Analysis, 2024
        • By Grade
        • By End Use
        • By Product Form
    • Russia
      • Pricing Analysis
      • Market Share Analysis, 2024
        • By Grade
        • By End Use
        • By Product Form
    • Poland
      • Pricing Analysis
      • Market Share Analysis, 2024
        • By Grade
        • By End Use
        • By Product Form
    • Hungary
      • Pricing Analysis
      • Market Share Analysis, 2024
        • By Grade
        • By End Use
        • By Product Form
    • Kingdom of Saudi Arabia
      • Pricing Analysis
      • Market Share Analysis, 2024
        • By Grade
        • By End Use
        • By Product Form
    • Turkiye
      • Pricing Analysis
      • Market Share Analysis, 2024
        • By Grade
        • By End Use
        • By Product Form
    • South Africa
      • Pricing Analysis
      • Market Share Analysis, 2024
        • By Grade
        • By End Use
        • By Product Form
  18. Market Structure Analysis
    • Competition Dashboard
    • Competition Benchmarking
    • Market Share Analysis of Top Players
      • By Regional
      • By Grade
      • By End Use
      • By Product Form
  19. Competition Analysis
    • Competition Deep Dive
      • BASF SE
        • Overview
        • Product Portfolio
        • Profitability by Market Segments (Product/Age /Sales Channel/Region)
        • Sales Footprint
        • Strategy Overview
          • Marketing Strategy
          • Product Strategy
          • Channel Strategy
      • Transpek Industry Ltd.
      • Merck KGaA (Sigma-Aldrich)
      • Nippon Carbide Industries
      • Donau Chemie
      • Avantor
      • Shandong Xinghua Chemistry
      • Raviraj Chemicals
      • Nissan Chemical Corporation
      • Honeywell International
      • Yantai Sanding Chemical
      • Mingda Chemical
      • Palm Commodities International
      • TCI Chemicals
      • Fisher Scientific
  20. Assumptions & Acronyms Used
  21. Research Methodology

List of Tables

  • Table 1: Global Market Value (USD Million) Forecast by Region, 2020 to 2035
  • Table 2: Global Market Value (USD Million) Forecast by Grade , 2020 to 2035
  • Table 3: Global Market Value (USD Million) Forecast by End Use, 2020 to 2035
  • Table 4: Global Market Value (USD Million) Forecast by Product Form, 2020 to 2035
  • Table 5: North America Market Value (USD Million) Forecast by Country, 2020 to 2035
  • Table 6: North America Market Value (USD Million) Forecast by Grade , 2020 to 2035
  • Table 7: North America Market Value (USD Million) Forecast by End Use, 2020 to 2035
  • Table 8: North America Market Value (USD Million) Forecast by Product Form, 2020 to 2035
  • Table 9: Latin America Market Value (USD Million) Forecast by Country, 2020 to 2035
  • Table 10: Latin America Market Value (USD Million) Forecast by Grade , 2020 to 2035
  • Table 11: Latin America Market Value (USD Million) Forecast by End Use, 2020 to 2035
  • Table 12: Latin America Market Value (USD Million) Forecast by Product Form, 2020 to 2035
  • Table 13: Western Europe Market Value (USD Million) Forecast by Country, 2020 to 2035
  • Table 14: Western Europe Market Value (USD Million) Forecast by Grade , 2020 to 2035
  • Table 15: Western Europe Market Value (USD Million) Forecast by End Use, 2020 to 2035
  • Table 16: Western Europe Market Value (USD Million) Forecast by Product Form, 2020 to 2035
  • Table 17: Eastern Europe Market Value (USD Million) Forecast by Country, 2020 to 2035
  • Table 18: Eastern Europe Market Value (USD Million) Forecast by Grade , 2020 to 2035
  • Table 19: Eastern Europe Market Value (USD Million) Forecast by End Use, 2020 to 2035
  • Table 20: Eastern Europe Market Value (USD Million) Forecast by Product Form, 2020 to 2035
  • Table 21: East Asia Market Value (USD Million) Forecast by Country, 2020 to 2035
  • Table 22: East Asia Market Value (USD Million) Forecast by Grade , 2020 to 2035
  • Table 23: East Asia Market Value (USD Million) Forecast by End Use, 2020 to 2035
  • Table 24: East Asia Market Value (USD Million) Forecast by Product Form, 2020 to 2035
  • Table 25: South Asia and Pacific Market Value (USD Million) Forecast by Country, 2020 to 2035
  • Table 26: South Asia and Pacific Market Value (USD Million) Forecast by Grade , 2020 to 2035
  • Table 27: South Asia and Pacific Market Value (USD Million) Forecast by End Use, 2020 to 2035
  • Table 28: South Asia and Pacific Market Value (USD Million) Forecast by Product Form, 2020 to 2035
  • Table 29: Middle East & Africa Market Value (USD Million) Forecast by Country, 2020 to 2035
  • Table 30: Middle East & Africa Market Value (USD Million) Forecast by Grade , 2020 to 2035
  • Table 31: Middle East & Africa Market Value (USD Million) Forecast by End Use, 2020 to 2035
  • Table 32: Middle East & Africa Market Value (USD Million) Forecast by Product Form, 2020 to 2035

List of Figures

  • Figure 1: Global Market Pricing Analysis
  • Figure 2: Global Market Value (USD Million) Forecast 2020-2035
  • Figure 3: Global Market Value Share and BPS Analysis by Grade , 2025 and 2035
  • Figure 4: Global Market Y to o to Y Growth Comparison by Grade , 2025-2035
  • Figure 5: Global Market Attractiveness Analysis by Grade
  • Figure 6: Global Market Value Share and BPS Analysis by End Use, 2025 and 2035
  • Figure 7: Global Market Y to o to Y Growth Comparison by End Use, 2025-2035
  • Figure 8: Global Market Attractiveness Analysis by End Use
  • Figure 9: Global Market Value Share and BPS Analysis by Product Form, 2025 and 2035
  • Figure 10: Global Market Y to o to Y Growth Comparison by Product Form, 2025-2035
  • Figure 11: Global Market Attractiveness Analysis by Product Form
  • Figure 12: Global Market Value (USD Million) Share and BPS Analysis by Region, 2025 and 2035
  • Figure 13: Global Market Y to o to Y Growth Comparison by Region, 2025-2035
  • Figure 14: Global Market Attractiveness Analysis by Region
  • Figure 15: North America Market Incremental Dollar Opportunity, 2025-2035
  • Figure 16: Latin America Market Incremental Dollar Opportunity, 2025-2035
  • Figure 17: Western Europe Market Incremental Dollar Opportunity, 2025-2035
  • Figure 18: Eastern Europe Market Incremental Dollar Opportunity, 2025-2035
  • Figure 19: East Asia Market Incremental Dollar Opportunity, 2025-2035
  • Figure 20: South Asia and Pacific Market Incremental Dollar Opportunity, 2025-2035
  • Figure 21: Middle East & Africa Market Incremental Dollar Opportunity, 2025-2035
  • Figure 22: North America Market Value Share and BPS Analysis by Country, 2025 and 2035
  • Figure 23: North America Market Value Share and BPS Analysis by Grade , 2025 and 2035
  • Figure 24: North America Market Y to o to Y Growth Comparison by Grade , 2025-2035
  • Figure 25: North America Market Attractiveness Analysis by Grade
  • Figure 26: North America Market Value Share and BPS Analysis by End Use, 2025 and 2035
  • Figure 27: North America Market Y to o to Y Growth Comparison by End Use, 2025-2035
  • Figure 28: North America Market Attractiveness Analysis by End Use
  • Figure 29: North America Market Value Share and BPS Analysis by Product Form, 2025 and 2035
  • Figure 30: North America Market Y to o to Y Growth Comparison by Product Form, 2025-2035
  • Figure 31: North America Market Attractiveness Analysis by Product Form
  • Figure 32: Latin America Market Value Share and BPS Analysis by Country, 2025 and 2035
  • Figure 33: Latin America Market Value Share and BPS Analysis by Grade , 2025 and 2035
  • Figure 34: Latin America Market Y to o to Y Growth Comparison by Grade , 2025-2035
  • Figure 35: Latin America Market Attractiveness Analysis by Grade
  • Figure 36: Latin America Market Value Share and BPS Analysis by End Use, 2025 and 2035
  • Figure 37: Latin America Market Y to o to Y Growth Comparison by End Use, 2025-2035
  • Figure 38: Latin America Market Attractiveness Analysis by End Use
  • Figure 39: Latin America Market Value Share and BPS Analysis by Product Form, 2025 and 2035
  • Figure 40: Latin America Market Y to o to Y Growth Comparison by Product Form, 2025-2035
  • Figure 41: Latin America Market Attractiveness Analysis by Product Form
  • Figure 42: Western Europe Market Value Share and BPS Analysis by Country, 2025 and 2035
  • Figure 43: Western Europe Market Value Share and BPS Analysis by Grade , 2025 and 2035
  • Figure 44: Western Europe Market Y to o to Y Growth Comparison by Grade , 2025-2035
  • Figure 45: Western Europe Market Attractiveness Analysis by Grade
  • Figure 46: Western Europe Market Value Share and BPS Analysis by End Use, 2025 and 2035
  • Figure 47: Western Europe Market Y to o to Y Growth Comparison by End Use, 2025-2035
  • Figure 48: Western Europe Market Attractiveness Analysis by End Use
  • Figure 49: Western Europe Market Value Share and BPS Analysis by Product Form, 2025 and 2035
  • Figure 50: Western Europe Market Y to o to Y Growth Comparison by Product Form, 2025-2035
  • Figure 51: Western Europe Market Attractiveness Analysis by Product Form
  • Figure 52: Eastern Europe Market Value Share and BPS Analysis by Country, 2025 and 2035
  • Figure 53: Eastern Europe Market Value Share and BPS Analysis by Grade , 2025 and 2035
  • Figure 54: Eastern Europe Market Y to o to Y Growth Comparison by Grade , 2025-2035
  • Figure 55: Eastern Europe Market Attractiveness Analysis by Grade
  • Figure 56: Eastern Europe Market Value Share and BPS Analysis by End Use, 2025 and 2035
  • Figure 57: Eastern Europe Market Y to o to Y Growth Comparison by End Use, 2025-2035
  • Figure 58: Eastern Europe Market Attractiveness Analysis by End Use
  • Figure 59: Eastern Europe Market Value Share and BPS Analysis by Product Form, 2025 and 2035
  • Figure 60: Eastern Europe Market Y to o to Y Growth Comparison by Product Form, 2025-2035
  • Figure 61: Eastern Europe Market Attractiveness Analysis by Product Form
  • Figure 62: East Asia Market Value Share and BPS Analysis by Country, 2025 and 2035
  • Figure 63: East Asia Market Value Share and BPS Analysis by Grade , 2025 and 2035
  • Figure 64: East Asia Market Y to o to Y Growth Comparison by Grade , 2025-2035
  • Figure 65: East Asia Market Attractiveness Analysis by Grade
  • Figure 66: East Asia Market Value Share and BPS Analysis by End Use, 2025 and 2035
  • Figure 67: East Asia Market Y to o to Y Growth Comparison by End Use, 2025-2035
  • Figure 68: East Asia Market Attractiveness Analysis by End Use
  • Figure 69: East Asia Market Value Share and BPS Analysis by Product Form, 2025 and 2035
  • Figure 70: East Asia Market Y to o to Y Growth Comparison by Product Form, 2025-2035
  • Figure 71: East Asia Market Attractiveness Analysis by Product Form
  • Figure 72: South Asia and Pacific Market Value Share and BPS Analysis by Country, 2025 and 2035
  • Figure 73: South Asia and Pacific Market Value Share and BPS Analysis by Grade , 2025 and 2035
  • Figure 74: South Asia and Pacific Market Y to o to Y Growth Comparison by Grade , 2025-2035
  • Figure 75: South Asia and Pacific Market Attractiveness Analysis by Grade
  • Figure 76: South Asia and Pacific Market Value Share and BPS Analysis by End Use, 2025 and 2035
  • Figure 77: South Asia and Pacific Market Y to o to Y Growth Comparison by End Use, 2025-2035
  • Figure 78: South Asia and Pacific Market Attractiveness Analysis by End Use
  • Figure 79: South Asia and Pacific Market Value Share and BPS Analysis by Product Form, 2025 and 2035
  • Figure 80: South Asia and Pacific Market Y to o to Y Growth Comparison by Product Form, 2025-2035
  • Figure 81: South Asia and Pacific Market Attractiveness Analysis by Product Form
  • Figure 82: Middle East & Africa Market Value Share and BPS Analysis by Country, 2025 and 2035
  • Figure 83: Middle East & Africa Market Value Share and BPS Analysis by Grade , 2025 and 2035
  • Figure 84: Middle East & Africa Market Y to o to Y Growth Comparison by Grade , 2025-2035
  • Figure 85: Middle East & Africa Market Attractiveness Analysis by Grade
  • Figure 86: Middle East & Africa Market Value Share and BPS Analysis by End Use, 2025 and 2035
  • Figure 87: Middle East & Africa Market Y to o to Y Growth Comparison by End Use, 2025-2035
  • Figure 88: Middle East & Africa Market Attractiveness Analysis by End Use
  • Figure 89: Middle East & Africa Market Value Share and BPS Analysis by Product Form, 2025 and 2035
  • Figure 90: Middle East & Africa Market Y to o to Y Growth Comparison by Product Form, 2025-2035
  • Figure 91: Middle East & Africa Market Attractiveness Analysis by Product Form
  • Figure 92: Global Market - Tier Structure Analysis
  • Figure 93: Global Market - Company Share Analysis

Frequently Asked Questions

How big is the sulfamic acid market in 2025?

The global sulfamic acid market is estimated to be valued at USD 297.5 million in 2025.

What will be the size of sulfamic acid market in 2035?

The market size for the sulfamic acid market is projected to reach USD 432.0 million by 2035.

How much will be the sulfamic acid market growth between 2025 and 2035?

The sulfamic acid market is expected to grow at a 3.8% CAGR between 2025 and 2035.

What are the key product types in the sulfamic acid market?

The key product types in sulfamic acid market are technical/industrial, food & pharma grade, electronic/specialty grade and others.

Which end use segment to contribute significant share in the sulfamic acid market in 2025?

In terms of end use, industrial cleaning segment to command 40.1% share in the sulfamic acid market in 2025.

Explore Similar Insights

Future Market Insights

Sulfamic Acid Market

Chat With MaRIA

Chat With

MaRIA

Hi There, I am MaRIA, Your Market Research Intelligence Assistant. How may I help you?