The Telecom Order Management Market is estimated to be valued at USD 3.9 billion in 2025 and is projected to reach USD 8.3 billion by 2035, registering a compound annual growth rate (CAGR) of 7.9% over the forecast period.
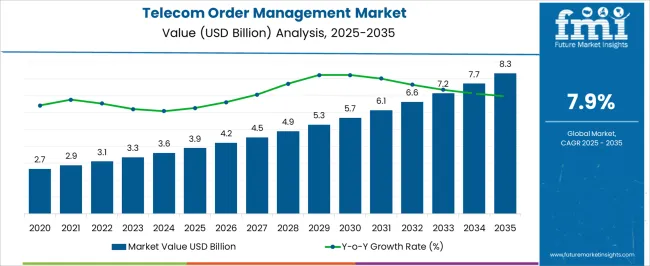
| Metric | Value |
|---|---|
| Telecom Order Management Market Estimated Value in (2025 E) | USD 3.9 billion |
| Telecom Order Management Market Forecast Value in (2035 F) | USD 8.3 billion |
| Forecast CAGR (2025 to 2035) | 7.9% |
The telecom order management market is undergoing rapid evolution as service providers embrace digitalization to streamline operations, reduce service delivery time, and improve customer satisfaction. Increasing demand for bundled services, complex product offerings, and multi-channel engagement is driving the need for agile and scalable order management platforms. Operators are prioritizing solutions that support zero-touch provisioning, real-time inventory visibility, and automated workflow orchestration.
The shift from legacy systems to cloud-native architectures is allowing for faster deployment cycles, operational flexibility, and cost optimization. With heightened competition in 5G, IoT, and fiber rollout initiatives, telecom companies are adopting platforms that can manage high-volume transactions with minimal latency.
Regulatory emphasis on consumer rights and service transparency is also influencing investments in order orchestration and fulfillment accuracy. As operators look to future-proof their business models, order management is becoming central to enabling unified service experiences across B2B and B2C channels.
The market is segmented by Component and Deployment Type and region. By Component, the market is divided into Solutions and Services. In terms of Deployment Type, the market is classified into Cloud Based and On-premise. Regionally, the market is classified into North America, Latin America, Western Europe, Eastern Europe, Balkan & Baltic Countries, Russia & Belarus, Central Asia, East Asia, South Asia & Pacific, and the Middle East & Africa.
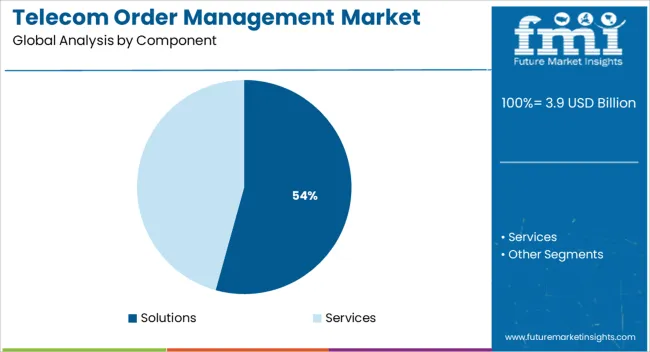
The solutions subsegment is expected to hold 54.3% of the total market revenue in 2025 within the component category, establishing its lead over services. This leadership is being driven by increasing telecom provider investment in configurable, modular software platforms that automate the entire order lifecycle from capture to activation.
These solutions offer out-of-the-box integrations with billing, CRM, inventory, and network systems, enabling real-time order orchestration across hybrid networks. Operators are prioritizing scalable order management engines that support multi-play services, dynamic pricing models, and on-demand provisioning.
The need for personalized offerings and seamless omni-channel order capture is further strengthening the demand for solution-centric deployments. Enhanced analytics, AI-driven decision engines, and support for digital marketplaces are being embedded within these platforms, reinforcing their value and widespread adoption across Tier 1 and Tier 2 operators.
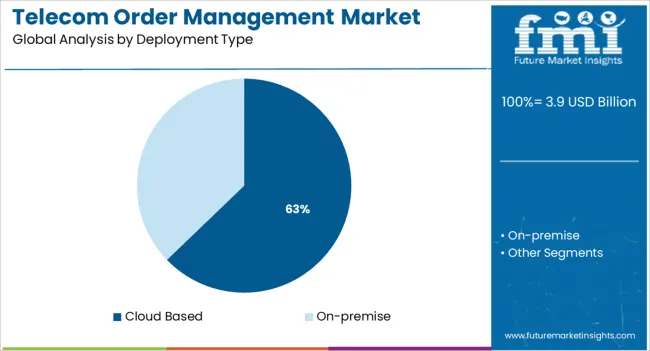
The cloud based deployment model is projected to command 62.8% of the telecom order management market revenue in 2025, making it the dominant deployment type. This dominance is being supported by telecom operators’ increasing preference for elastic infrastructure that supports rapid service rollout and cost-efficient scalability.
Cloud deployments are enabling continuous delivery, system resilience, and accelerated time-to-market, which are crucial in competitive 5G and fiber-to-the-home rollouts. The ability to dynamically adjust capacity and integrate seamlessly with external ecosystems is allowing cloud-based platforms to support complex, multi-tenant use cases.
Additionally, vendors are offering order management as a service with built-in compliance, reducing IT overhead and maintenance burden for telecom clients. These benefits, combined with lower total cost of ownership and real-time upgrade pathways, are expected to sustain the leadership of cloud-based models well into the forecast period.
As per the Telecom Order Management Market research by Future Market Insights - a market research and competitive intelligence provider, historically, from 2020 to 2024, market value of the Telecom Order Management Market increased at around 8.4% CAGR.
Telecom order management systems help firms automate service fulfilment operations and improve customer service delivery. Other growth-inducing elements include numerous technology breakthroughs, such as the creation of next-generation telecommunications order management technologies.
Service providers are also utilizing artificial intelligence, machine learning, and big data to promote standardization and compatibility with existing systems. As per an analysis done in India, the population of internet users in the country is likely to surge by 40% by 2025, while the figure is projected to expand by 50% in the forecast years. The usage of telecom order management has risen in tandem with the development in smartphone penetration and internet purchasing.
Nokia has introduced a new cloud-native IMS Voice Core solution to assist communication service providers in streamlining network operations, increasing operational agility, and lowering network management costs. Focusing on a modular architecture consisting of independent functions vastly facilitates IMS Voice Core deployment as well as operability, thus drastically reducing installation and improvement time; ensuring greater deployment and configuration, and reducing footprint and cost through successful quality management operational savings.
Its software architecture enhances common resource use and internal message performance, using less infrastructure for the IMS voice service, resulting in a 10%-20% increase in energy efficiency compared to existing IMS voice cores.
Communication service providers are extensively embracing sophisticated order management technologies to develop individualized client orders and services and allow the flexible running of enterprises, as networks and connectivity devices become more converged.
Furthermore, the widespread use of internet-enabled smartphones, as well as rising consumer demand for online purchasing via e-commerce platforms, are boosting market development. As per a study, 49% of the global population remains online, with an estimated USD 8.4 Billion connected devices in use globally. As a response, the number of connected devices and users has increased, propelling the telecommunication order management industry forward.
TPG Telecom claimed to be the first operator to introduce G.Fast technology, which offers downloading levels by up to one gigabit per second through its fiber-to-the-premises network. G.Fast is being deployed on twisted pair cable at frequencies higher than those utilized by VDSL.
This is to avoid interference with and degrading the performance of competing VDSL services on the same cable. To attain Gbit speeds, G.Fast may be introduced across a larger band when there are no co-located VDSL connections.
Nokia has introduced the commercial entry of new software as a service (SaaS) that aims to improve network efficiency and control home devices. It is a machine learning solution that identifies and corrects network abnormalities before they cause problems for network consumers.
Moreover, Nokia Analytic Virtualisation and Automate for energy SaaS use Artificial Intelligence that closely monitors traffic patterns in order to decrease connectivity resources during periods of low usage. When compared to non-AI systems, Nokia claims that this tool can save almost five times the amount of energy.
Order management is vital for every company's performance, but it is highly important for telecom carriers. Telecom order management is a very complicated process that frequently involves hundreds of sub-processes involving different systems, departments, and partner companies.
When telecom carriers sell to the business sector, orders might be highly customized and multifarious, adding to the complexity of order administration.
Order management methods have a range of effects on suppliers' business prospects. They are a potential source of considerable efficiency gains and cost reductions.
Furthermore, the efficacy of order management operations has a direct influence on revenues since order fallout can result in lost sales and customers. The ability of a provider to execute transactions in a timely and precise way shapes new consumers' initial perceptions of service.
DesignTrack, the virtualized Sales Order Management platform for trade showrooms, has been released by Showroom Software. With the debut of DesignTrack, Showroom Software, a provider of technology innovations for the trade industry, is reinventing sales order administration.
The new platform allows showrooms to ditch out-of-date order management systems in favor of more effectively managing and processing orders.
Geographically, North America dominates the global telecom order management market owing to the rising need for client retention and highly competitive industry. The increase in awareness about the benefits that telecommunications order management solutions providers, such as assisting in timely order fulfillment necessary for early revenue generation and improving end-user happiness, has contributed to the constant rise of the North American telecom order management market.
Flytxt's consumer value management accelerator will be used by Lyca Mobile. Lyca Mobile will use Flytxt's artificial intelligence powered consumer value management accelerator throughout its seven major markets. Lyca Mobile uses Salesforce to combine consumer data and interactions in order to provide a more personalized experience. The accelerator uses real-world insights and trends from over a billion people and billions of data points to leverage analytics and AI. The accelerator will be used for the first time in the United States and Europe owing to the agreement with Lyca Mobile.
Asia Pacific is predicted to develop at a substantially faster rate than other regional markets, with a high CAGR. The Asia Pacific telecommunication order management industry is anticipated to increase due to fast digitalization and rising cloud adoption across the region.
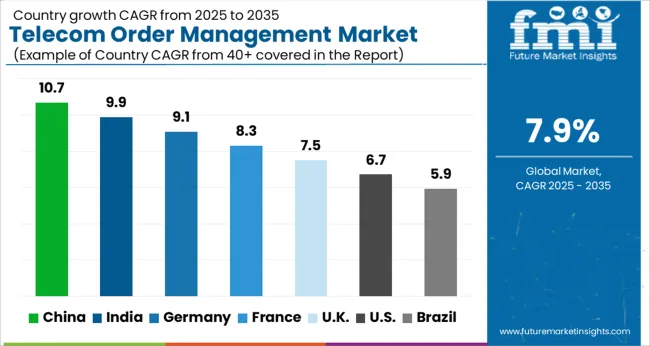
The United States is expected to account for the highest market share of USD 8.3 Billion by the end of 2035. Communication Support Providers are searching for new creative solutions to standardize their 4G/LTE business models, deliver better customer service, and monitor service quality and performance, owing to the proliferation of long-term evolution systems in the country.
TimelyBill is a telecommunication billing & revenue management software that helps service providers present goods, issue invoices, receive payments, offer packages, share profits with partners, identify fraud, and do a variety of other revenue-related tasks.
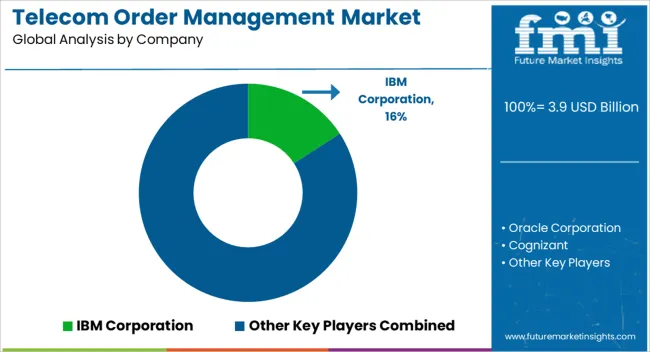
Among the leading players in the global Telecom Order Management market are Ericsson AB, Amdocs Corp., Cerillion Plc, IBM Corp., ChikPea Inc., Comarch SA, Fujitsu Ltd., Neustar Inc., Pegasystems Inc., and Oracle Corp.
Similarly, recent developments related to companies in Telecom Order Management Market have been tracked by the team at Future Market Insights, which are available in the full report.
The global telecom order management market is estimated to be valued at USD 3.9 billion in 2025.
The market size for the telecom order management market is projected to reach USD 8.3 billion by 2035.
The telecom order management market is expected to grow at a 7.9% CAGR between 2025 and 2035.
The key product types in telecom order management market are solutions and services.
In terms of deployment type, cloud based segment to command 62.8% share in the telecom order management market in 2025.


Our Research Products

The "Full Research Suite" delivers actionable market intel, deep dives on markets or technologies, so clients act faster, cut risk, and unlock growth.

The Leaderboard benchmarks and ranks top vendors, classifying them as Established Leaders, Leading Challengers, or Disruptors & Challengers.

Locates where complements amplify value and substitutes erode it, forecasting net impact by horizon

We deliver granular, decision-grade intel: market sizing, 5-year forecasts, pricing, adoption, usage, revenue, and operational KPIs—plus competitor tracking, regulation, and value chains—across 60 countries broadly.

Spot the shifts before they hit your P&L. We track inflection points, adoption curves, pricing moves, and ecosystem plays to show where demand is heading, why it is changing, and what to do next across high-growth markets and disruptive tech

Real-time reads of user behavior. We track shifting priorities, perceptions of today’s and next-gen services, and provider experience, then pace how fast tech moves from trial to adoption, blending buyer, consumer, and channel inputs with social signals (#WhySwitch, #UX).

Partner with our analyst team to build a custom report designed around your business priorities. From analysing market trends to assessing competitors or crafting bespoke datasets, we tailor insights to your needs.
Supplier Intelligence
Discovery & Profiling
Capacity & Footprint
Performance & Risk
Compliance & Governance
Commercial Readiness
Who Supplies Whom
Scorecards & Shortlists
Playbooks & Docs
Category Intelligence
Definition & Scope
Demand & Use Cases
Cost Drivers
Market Structure
Supply Chain Map
Trade & Policy
Operating Norms
Deliverables
Buyer Intelligence
Account Basics
Spend & Scope
Procurement Model
Vendor Requirements
Terms & Policies
Entry Strategy
Pain Points & Triggers
Outputs
Pricing Analysis
Benchmarks
Trends
Should-Cost
Indexation
Landed Cost
Commercial Terms
Deliverables
Brand Analysis
Positioning & Value Prop
Share & Presence
Customer Evidence
Go-to-Market
Digital & Reputation
Compliance & Trust
KPIs & Gaps
Outputs
Full Research Suite comprises of:
Market outlook & trends analysis
Interviews & case studies
Strategic recommendations
Vendor profiles & capabilities analysis
5-year forecasts
8 regions and 60+ country-level data splits
Market segment data splits
12 months of continuous data updates
DELIVERED AS:
PDF EXCEL ONLINE
Telecom Tower Power System Market Size and Share Forecast Outlook 2025 to 2035
Telecom Mounting Hardware Market Size and Share Forecast Outlook 2025 to 2035
Telecom Testing Equipment Market Size and Share Forecast Outlook 2025 to 2035
Telecom Analytics Market Size and Share Forecast Outlook 2025 to 2035
Telecom Internet Of Things (IoT) Market Size and Share Forecast Outlook 2025 to 2035
Telecom Tower Power System Market Analysis - Size, Share, and Forecast Outlook 2025 to 2035
Telecom Network Infrastructure Market Analysis - Size, Share, and Forecast Outlook 2025 to 2035
Telecom Generator Market Size and Share Forecast Outlook 2025 to 2035
Telecom Power Rental Market Size and Share Forecast Outlook 2025 to 2035
Telecom Millimeter Wave Technology Market Size and Share Forecast Outlook 2025 to 2035
Telecom Equipment Market Size and Share Forecast Outlook 2025 to 2035
Telecom Cloud Market Size and Share Forecast Outlook 2025 to 2035
Telecom Power Systems Market Size and Share Forecast Outlook 2025 to 2035
Telecom Wireless Data Market Size and Share Forecast Outlook 2025 to 2035
Telecom Managed Service Market Trends - Growth & Forecast 2025 to 2035
Telecommunications Services Market - Growth & Forecast 2025 to 2035
Telecom Enterprise Services Market Analysis - Growth & Forecast through 2034
Telecom Service Assurance Market Trends – Size, Demand & Forecast 2023-2033
Telecom API Platform Market Growth – Trends & Forecast 2023-2033
telecom-expense-management-market-market-value-analysis

Thank you!
You will receive an email from our Business Development Manager. Please be sure to check your SPAM/JUNK folder too.
Chat With
MaRIA