Reports

- Global Locations -

Headquarters

Future Market Insights, Inc.

Christiana Corporate, 200
Continental Drive, Suite 401,
Newark, Delaware - 19713,
United States

T: +1-845-579-5705

Americas

Future Market Insights, Inc.

616 Corporate Way, Suite 2-9018,
Valley Cottage, NY 10989, United States

T: +1-347-918-3531

MEA

Future Market Insights

1602-6 Jumeirah Bay X2 Tower, Plot No: JLT-PH2-X2A,
Jumeirah Lakes Towers, Dubai,
United Arab Emirates

Europe

Future Market Insights

3rd Floor, 207 Regent Street,
W1B 3HH London
United Kingdom

T: + 44 (0) 20 8123 9659
D: +44 (0) 20 3287 4268

Asia Pacific

Future Market Insights

IndiaLand Global Tech Park, Unit UG-1, Behind Grand HighStreet, Phase 1, Hinjawadi, MH, Pune – 411057, India

Telecom Power Systems Market Outlook (2022-2032)

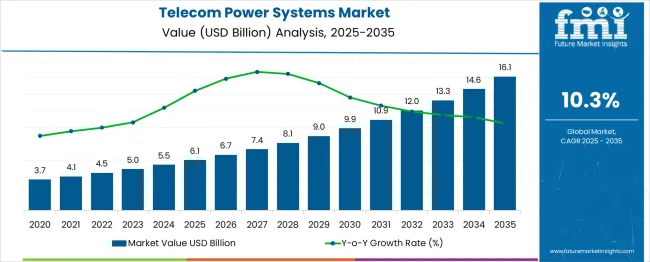
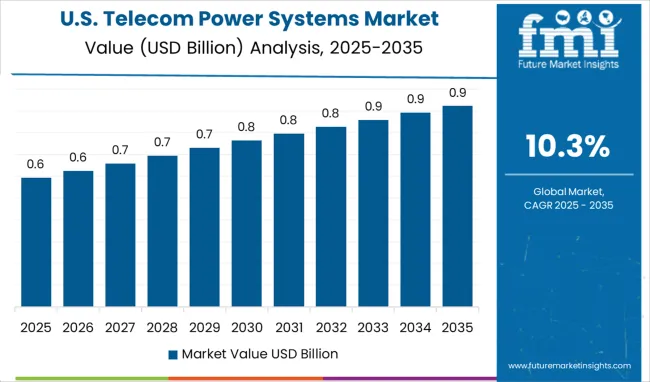
[250 Pages Report] The telecom power systems market is likely to record a strong CAGR of 10.26% during the forecast period. The telecom power systems market is currently valued at US$ 4.53 Bn in 2022 and is likely to reach US$ 12.03 Bn by 2032.

The global demand for telecom power systems is supported by the following factors:

  • The deployment of femtocells and picocells require telecom power systems which has accelerated owing to the rapid increase in the adoption of a range of connected devices.
  • The demand for telecom power systems is expected to rise owing to telecom operators consolidating their products with next-generation Wi-Fi-6, 5G networks, and other advanced technologies.
  • To minimize power system life-cycle costs and carbon footprint, hybrid power systems are being designed which is driving the global market growth.
  • Products equipped with precise location sensing, increased data capacities, lower latency, and greater device density are further being offered by telecom operators.
Report Attribute Details
Estimated Base Year Value (2022) US$ 4.53 Bn
Anticipated Forecast Value (2032) US$ 12.03 Bn
Projected Growth Rate (2022-2032) 10.26% CAGR

Although the market growth is expected to be healthy, the high initial and installation costs, as well as construction and maintenance of telecom towers and the power system components or devices may be a major hindrance which may affect the market, and challenge the key providers.

Don't pay for what you don't need

Customize your report by selecting specific countries or regions and save 30%!

Advancement & Expansion of Telecom Power Systems in Different Regions: North America & Asia Pacific

North America is currently the most dominating telecom power systems market. This is attributed to the region's strong telecommunication infrastructure and various telecom power system providers. The mobile penetration in this region is 94%, and the penetration for 4G-LTE was more than 73% as of January 2018. North America has been one of the early adopters of most of the most innovative technologies, including telecom technologies.

End users have a high demand for increased internet speeds which can be achieved by the usage of higher frequencies. Moreover, increasing the adoption of mobile towers is likely to assist in reducing the network coverage and ultimately reach the entire consumer base. Hence, this region witnesses an incredible advancement in these technologies, which is expected to eventually expand the global telecom power systems market size.

On the other hand, Asia Pacific is a growing market for telecom power systems, owing to the rapid digital transformation of several industries in developing economies. Furthermore, the growing cellular subscriber base in this region is surging telecom service providers to focus on expanding the telecommunication networks. Being the region that accounts for the highest number of smartphone users for the past few years, owing to the increased deployment of telecom towers in rural and remote locations, it is evidently anticipated to drive the demand for telecom power systems.

Scopes of Telecom Power Systems being Offered by Key Manufacturers

Renewable energy-powered telecom power systems are an innovation that manufacturers focus on as businesses are increasing their focus on reducing the environmental impact and carbon footprint of their operations and creating growth avenues for the same. This power system allows businesses to reduce operational costs while meeting carbon emission targets significantly.

Several key manufacturers are offering various benefits expected to increase the demand for telecom power systems. For instance, the facility to add additional batteries has been implemented to provide power to the load for an extended period in the event of utility supply failure. Another interesting feature is the “automatic battery voltage temperature compensation”, which further extends the battery life and performance. Moreover, integral over-current protection devices are being administered, which protect the system against overload faults.

End users can enjoy additional features such as LED indicators which provide easy-to-read status of the unit and utility power conditions, along with automatic periodic self-test, which ensures early detection of a battery that needs to be replaced. Regarding its serviceability, manufacturers provide the installation and maintenance of all components without access to the rear or sides of the cabinet. Additionally, if the UPS shuts down, the connected equipment automatically starts up upon the return of utility power. These factors are anticipated to contribute to the global telecom power systems market growth.

Sales of telecom power systems have risen due to a continuous rise in demand for uninterrupted telecom services.

Increased focus of telecom operators in their networks and long-established relationships with enterprise customers is also projected to contribute to the growth of the telecom power systems market share.

The report sheds light on the factors improving the sales of telecom power systems, and, in turn, the opportunities for market players. However, the telecom power systems market also faces some challenges, which might limit the telecom power systems market share from reaching its potential.

Some of the key telecom power systems market trends promoting the demand for telecom power systems include increasing demand for energy efficient devices coupled with the growing adoption of automation systems.

Sudip Saha
Sudip Saha

Principal Consultant

Talk to Analyst

Find your sweet spots for generating winning opportunities in this market.

What are the Key Dynamics to the Telecom Power Systems Market Share

The large installation of telecom towers even in rural and remote areas is one of the key factors driving the growth of the sales of telecom power systems

Also, the growing requirement for grid-based power solutions and wide implementation of green telecom power systems are the factors fueling the growth of the telecom power systems market.
Moreover, the increasing use of hybrid power systems by using renewable sources of energy like solar and wind to reduce the amount of radiation of greenhouse gases is supporting the growth of telecom power systems.

The rapid growth in telecommunication infrastructure, especially in emerging economies, is the key factor driving the demand for telecom power systems

Also, the deployment of telecom towers is increasing in order to meet the growing subscriber base, which is creating significant growth opportunities for telecom power systems market.

Apart from this, the rising adoption of small cell power systems for LTE and LTE advances and upcoming telecommunication technologies are some of the key factors which are expected to drive the growth of the sales of telecom power systems

In addition, the rising number of mobile data traffic and telecom operators approaches towards the improvement of network coverage in rural as well as metropolitan areas are supporting the growth of the telecom power systems market.

Which Region holds the Highest Growth Potential in the Telecom Power Systems Market

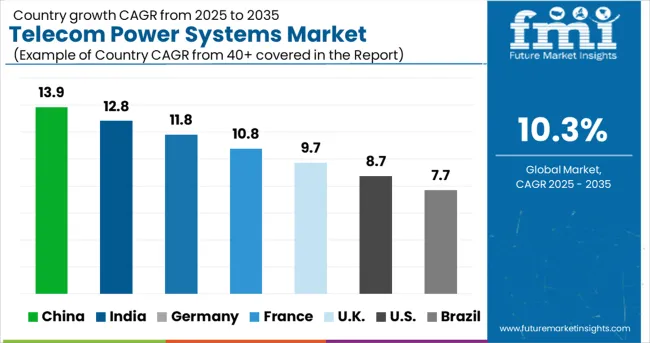
On the basis of geography, North America is expected to capture a significant market share in the telecom power systems market, owing to the presence of various key telecom power systems providers in the region and strong telecommunication infrastructure in countries of the region.

The telecom power systems market in Europe and the Asia Pacific is expected to capture significant growth rates due to the increasing investment by countries of the region in improving telecom infrastructure and increasing number of telecom towers due to the high population growth rate established by a vast number of mobile users.

The telecom power systems market in Latin America and Middle East & Africa is also expected to witness high growth as the subscriber base is continuously increasing in these regions.

The telecom power systems market report is a compilation of first-hand information, qualitative and quantitative assessments by industry analysts, and inputs from industry experts and industry participants across the value chain.

The report provides an in-depth analysis of parent market trends, macro-economic indicators, and governing factors, along with market attractiveness as per segment. The market report also maps the qualitative impact of various market factors on market segments and geographies.
Get the data you need at a Fraction of the cost

Personalize your report by choosing insights you need
and save 40%!

How is the Competitive Landscape in the Telecom Power Systems Market

The key players of the telecom power systems market are focusing on enhancing and adopting strategies like enhancing the durability, sizes and its use to thrive business. This is driving down the sales of telecom power systems.  

Some of the key participating players indulged in the sales of telecom power systems are:

  • ABB
  • Schneider Electric
  • Huawei
  • Eaton
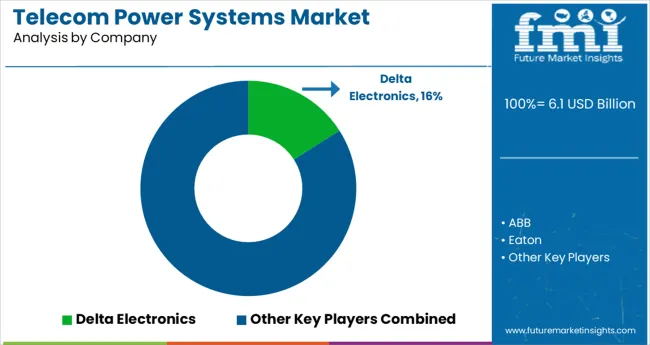
  • Delta Electronics

These leading players in the telecom power systems market are continuously focusing on introducing new products and upgrading their existing product lines in order to cater with the changing customer demands and to strengthen product differentiation strategy.

These market players are anticipated to drive the telecom power systems market by introducing new products and expanding geographically.

Scope of Report

Report Attribute Details
Growth Rate CAGR of 10.26% from 2022 to 2032
Base year for estimation 2022
Historical data 2015 – 2021
Forecast period 2023 – 2032
Quantitative units Revenue in USD Million and CAGR from 2022 to 2032
Report coverage Revenue forecast, volume forecast, company ranking, competitive landscape, growth factors, and trends, Pricing Analysis
Segments covered Type, Component, Region
Regional scope North America; Latin America; Western Europe; Eastern Europe; Japan; Asia Pacific; Middle East and Africa (MEA)
Country scope U.S., Canada, Mexico, Brazil, Germany, Italy, U.K, Spain, France, Nordic countries, BENELUX, Russia, Poland, Japan, China, India, South Korea, ASEAN, Australia & New Zealand, GCC Countries, Turkey, Northern Africa, South Africa
Key companies profiled ABB, Schneider Electric, Huawei, Eaton, and Delta Electronics
Customization scope Free report customization (equivalent to up to 8 analysts working days) with purchase. Addition or alteration to country, regional & segment scope.
Pricing and purchase options Avail customized purchase options to meet your exact research needs. 

Frequently Asked Questions

What is the Growth Outlook of the Telecom Power Systems Market?

The telecom power systems market grows at a rate of 10.26% CAGR during the forecast period 2022 to 2032.

Who are the Key Players in the Telecom Power Systems Market?

Key players holding a substantial telecom power systems market share include ABB, Schneider Electric, Huawei, Eaton, and Delta Electronics.

What is the Key Driver in the Telecom Power Systems Market?

Demand for telecom power systems is likely to rise on the back of increased focus of telecom operators in their networks and long-established relationships with enterprise customers.

Table of Content

1. Executive Summary

    1.1. Global Market Outlook

    1.2. Demand-side Trends

    1.3. Supply-side Trends

    1.4. Technology Roadmap Analysis

    1.5. Analysis and Recommendations

2. Market Overview

    2.1. Market Coverage / Taxonomy

    2.2. Market Definition / Scope / Limitations

3. Market Background

    3.1. Market Dynamics

        3.1.1. Drivers

        3.1.2. Restraints

        3.1.3. Opportunity

        3.1.4. Trends

    3.2. Scenario Forecast

        3.2.1. Demand in Optimistic Scenario

        3.2.2. Demand in Likely Scenario

        3.2.3. Demand in Conservative Scenario

    3.3. Opportunity Map Analysis

    3.4. Product Life Cycle Analysis

    3.5. Supply Chain Analysis

        3.5.1. Supply Side Participants and their Roles

            3.5.1.1. Producers

            3.5.1.2. Mid-Level Participants (Traders/ Agents/ Brokers)

            3.5.1.3. Wholesalers and Distributors

        3.5.2. Value Added and Value Created at Node in the Supply Chain

        3.5.3. List of Raw Material Suppliers

        3.5.4. List of Existing and Potential Buyer’s

    3.6. Investment Feasibility Matrix

    3.7. Value Chain Analysis

        3.7.1. Profit Margin Analysis

        3.7.2. Wholesalers and Distributors

        3.7.3. Retailers

    3.8. PESTLE and Porter’s Analysis

    3.9. Regulatory Landscape

        3.9.1. By Key Regions

        3.9.2. By Key Countries

    3.10. Regional Parent Market Outlook

    3.11. Production and Consumption Statistics

    3.12. Import and Export Statistics

4. Global Market Analysis 2017-2021 and Forecast, 2022-2032

    4.1. Historical Market Size Value (US$ Mn) & Volume (Units) Analysis, 2017-2021

    4.2. Current and Future Market Size Value (US$ Mn) & Volume (Units) Projections, 2022-2032

        4.2.1. Y-o-Y Growth Trend Analysis

        4.2.2. Absolute $ Opportunity Analysis

5. Global Market Analysis 2017-2021 and Forecast 2022-2032, By Product Category

    5.1. Introduction / Key Findings

    5.2. Historical Market Size Value (US$ Mn) & Volume (Units) Analysis By Product Category, 2017-2021

    5.3. Current and Future Market Size Value (US$ Mn) & Volume (Units) Analysis and Forecast By Product Category, 2022-2032

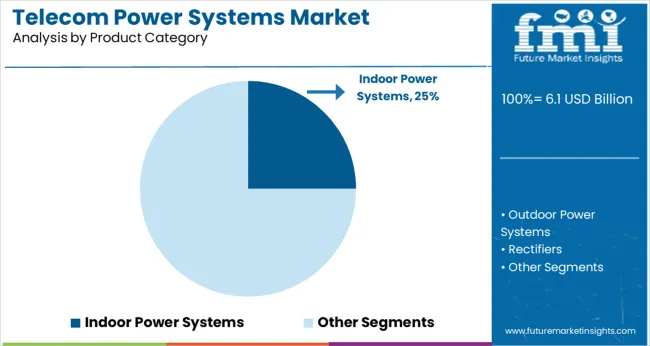
        5.3.1. Indoor Power Systems

        5.3.2. Outdoor Power Systems

        5.3.3. Rectifiers

        5.3.4. DC/DC Converters

        5.3.5. Controllers

        5.3.6. Generators

        5.3.7. Heat Management Systems

        5.3.8. Other Product Categories

    5.4. Y-o-Y Growth Trend Analysis By Product Category, 2017-2021

    5.5. Absolute $ Opportunity Analysis By Product Category, 2022-2032

Deep-dive segmentation will be available in the sample on request

6. Global Market Analysis 2017-2021 and Forecast 2022-2032, By Power Source

    6.1. Introduction / Key Findings

    6.2. Historical Market Size Value (US$ Mn) & Volume (Units) Analysis By Power Source, 2017-2021

    6.3. Current and Future Market Size Value (US$ Mn) & Volume (Units) Analysis and Forecast By Power Source, 2022-2032

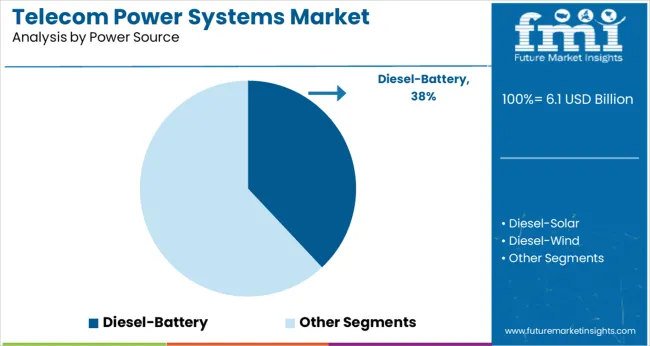
        6.3.1. Diesel-Battery

        6.3.2. Diesel-Solar

        6.3.3. Diesel-Wind

        6.3.4. Multiple Sources

    6.4. Y-o-Y Growth Trend Analysis By Power Source, 2017-2021

    6.5. Absolute $ Opportunity Analysis By Power Source, 2022-2032

Deep-dive segmentation will be available in the sample on request

7. Global Market Analysis 2017-2021 and Forecast 2022-2032, By Application

    7.1. Introduction / Key Findings

    7.2. Historical Market Size Value (US$ Mn) & Volume (Units) Analysis By Application, 2017-2021

    7.3. Current and Future Market Size Value (US$ Mn) & Volume (Units) Analysis and Forecast By Application, 2022-2032

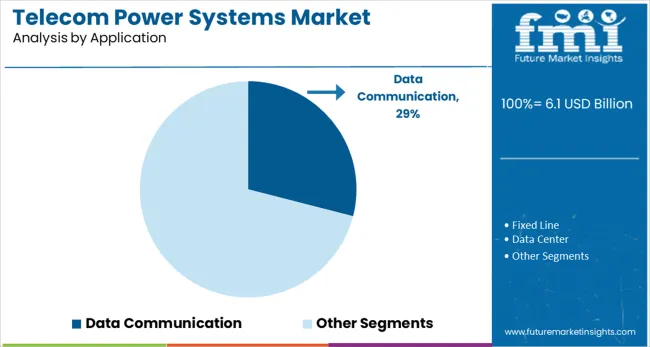
        7.3.1. Fixed Line

        7.3.2. Data Communication

        7.3.3. Data Center

        7.3.4. Internet & Broadband Access

        7.3.5. Other Applications

    7.4. Y-o-Y Growth Trend Analysis By Application, 2017-2021

    7.5. Absolute $ Opportunity Analysis By Application, 2022-2032

Deep-dive segmentation will be available in the sample on request

8. Global Market Analysis 2017-2021 and Forecast 2022-2032, By Region

    8.1. Introduction

    8.2. Historical Market Size Value (US$ Mn) & Volume (Units) Analysis By Region, 2017-2021

    8.3. Current Market Size Value (US$ Mn) & Volume (Units) Analysis and Forecast By Region, 2022-2032

        8.3.1. North America

        8.3.2. Latin America

        8.3.3. Europe

        8.3.4. East Asia

        8.3.5. South Asia & Pacific

        8.3.6. MEA

    8.4. Market Attractiveness Analysis By Region

9. North America Market Analysis 2017-2021 and Forecast 2022-2032, By Country

    9.1. Historical Market Size Value (US$ Mn) & Volume (Units) Trend Analysis By Market Taxonomy, 2017-2021

    9.2. Market Size Value (US$ Mn) & Volume (Units) Forecast By Market Taxonomy, 2022-2032

        9.2.1. By Country

            9.2.1.1. U.S.

            9.2.1.2. Canada

        9.2.2. By Product Category

        9.2.3. By Power Source

        9.2.4. By Application

    9.3. Market Attractiveness Analysis

        9.3.1. By Country

        9.3.2. By Product Category

        9.3.3. By Power Source

        9.3.4. By Application

    9.4. Key Takeaways

10. Latin America Market Analysis 2017-2021 and Forecast 2022-2032, By Country

    10.1. Historical Market Size Value (US$ Mn) & Volume (Units) Trend Analysis By Market Taxonomy, 2017-2021

    10.2. Market Size Value (US$ Mn) & Volume (Units) Forecast By Market Taxonomy, 2022-2032

        10.2.1. By Country

            10.2.1.1. Mexico

            10.2.1.2. Brazil

            10.2.1.3. Rest of Latin America

        10.2.2. By Product Category

        10.2.3. By Power Source

        10.2.4. By Application

    10.3. Market Attractiveness Analysis

        10.3.1. By Country

        10.3.2. By Product Category

        10.3.3. By Power Source

        10.3.4. By Application

    10.4. Key Takeaways

11. Europe Market Analysis 2017-2021 and Forecast 2022-2032, By Country

    11.1. Historical Market Size Value (US$ Mn) & Volume (Units) Trend Analysis By Market Taxonomy, 2017-2021

    11.2. Market Size Value (US$ Mn) & Volume (Units) Forecast By Market Taxonomy, 2022-2032

        11.2.1. By Country

            11.2.1.1. Germany

            11.2.1.2. Italy

            11.2.1.3. France

            11.2.1.4. U.K.

            11.2.1.5. Spain

            11.2.1.6. BENELUX

            11.2.1.7. Russia

            11.2.1.8. Rest of Europe

        11.2.2. By Product Category

        11.2.3. By Power Source

        11.2.4. By Application

    11.3. Market Attractiveness Analysis

        11.3.1. By Country

        11.3.2. By Product Category

        11.3.3. By Power Source

        11.3.4. By Application

    11.4. Key Takeaways

12. East Asia Market Analysis 2017-2021 and Forecast 2022-2032, By Country

    12.1. Historical Market Size Value (US$ Mn) & Volume (Units) Trend Analysis By Market Taxonomy, 2017-2021

    12.2. Market Size Value (US$ Mn) & Volume (Units) Forecast By Market Taxonomy, 2022-2032

        12.2.1. By Country

            12.2.1.1. China

            12.2.1.2. Japan

            12.2.1.3. South Korea

        12.2.2. By Product Category

        12.2.3. By Power Source

        12.2.4. By Application

    12.3. Market Attractiveness Analysis

        12.3.1. By Country

        12.3.2. By Product Category

        12.3.3. By Power Source

        12.3.4. By Application

    12.4. Key Takeaways

13. South Asia & Pacific Market Analysis 2017-2021 and Forecast 2022-2032, By Country

    13.1. Historical Market Size Value (US$ Mn) & Volume (Units) Trend Analysis By Market Taxonomy, 2017-2021

    13.2. Market Size Value (US$ Mn) & Volume (Units) Forecast By Market Taxonomy, 2022-2032

        13.2.1. By Country

            13.2.1.1. India

            13.2.1.2. ASEAN

            13.2.1.3. Australia and New Zealand

            13.2.1.4. Rest of South Asia & Pacific

        13.2.2. By Product Category

        13.2.3. By Power Source

        13.2.4. By Application

    13.3. Market Attractiveness Analysis

        13.3.1. By Country

        13.3.2. By Product Category

        13.3.3. By Power Source

        13.3.4. By Application

    13.4. Key Takeaways

14. MEA Market Analysis 2017-2021 and Forecast 2022-2032, By Country

    14.1. Historical Market Size Value (US$ Mn) & Volume (Units) Trend Analysis By Market Taxonomy, 2017-2021

    14.2. Market Size Value (US$ Mn) & Volume (Units) Forecast By Market Taxonomy, 2022-2032

        14.2.1. By Country

            14.2.1.1. GCC Countries

            14.2.1.2. Turkey

            14.2.1.3. South Africa

            14.2.1.4. Rest of MEA

        14.2.2. By Product Category

        14.2.3. By Power Source

        14.2.4. By Application

    14.3. Market Attractiveness Analysis

        14.3.1. By Country

        14.3.2. By Product Category

        14.3.3. By Power Source

        14.3.4. By Application

    14.4. Key Takeaways

15. Key Countries Market Analysis

    15.1. U.S.

        15.1.1. Pricing Analysis

        15.1.2. Market Share Analysis, 2021

            15.1.2.1. By Product Category

            15.1.2.2. By Power Source

            15.1.2.3. By Application

    15.2. Canada

        15.2.1. Pricing Analysis

        15.2.2. Market Share Analysis, 2021

            15.2.2.1. By Product Category

            15.2.2.2. By Power Source

            15.2.2.3. By Application

    15.3. Mexico

        15.3.1. Pricing Analysis

        15.3.2. Market Share Analysis, 2021

            15.3.2.1. By Product Category

            15.3.2.2. By Power Source

            15.3.2.3. By Application

    15.4. Brazil

        15.4.1. Pricing Analysis

        15.4.2. Market Share Analysis, 2021

            15.4.2.1. By Product Category

            15.4.2.2. By Power Source

            15.4.2.3. By Application

    15.5. Germany

        15.5.1. Pricing Analysis

        15.5.2. Market Share Analysis, 2021

            15.5.2.1. By Product Category

            15.5.2.2. By Power Source

            15.5.2.3. By Application

    15.6. Italy

        15.6.1. Pricing Analysis

        15.6.2. Market Share Analysis, 2021

            15.6.2.1. By Product Category

            15.6.2.2. By Power Source

            15.6.2.3. By Application

    15.7. France

        15.7.1. Pricing Analysis

        15.7.2. Market Share Analysis, 2021

            15.7.2.1. By Product Category

            15.7.2.2. By Power Source

            15.7.2.3. By Application

    15.8. U.K.

        15.8.1. Pricing Analysis

        15.8.2. Market Share Analysis, 2021

            15.8.2.1. By Product Category

            15.8.2.2. By Power Source

            15.8.2.3. By Application

    15.9. Spain

        15.9.1. Pricing Analysis

        15.9.2. Market Share Analysis, 2021

            15.9.2.1. By Product Category

            15.9.2.2. By Power Source

            15.9.2.3. By Application

    15.10. BENELUX

        15.10.1. Pricing Analysis

        15.10.2. Market Share Analysis, 2021

            15.10.2.1. By Product Category

            15.10.2.2. By Power Source

            15.10.2.3. By Application

    15.11. Russia

        15.11.1. Pricing Analysis

        15.11.2. Market Share Analysis, 2021

            15.11.2.1. By Product Category

            15.11.2.2. By Power Source

            15.11.2.3. By Application

    15.12. China

        15.12.1. Pricing Analysis

        15.12.2. Market Share Analysis, 2021

            15.12.2.1. By Product Category

            15.12.2.2. By Power Source

            15.12.2.3. By Application

    15.13. Japan

        15.13.1. Pricing Analysis

        15.13.2. Market Share Analysis, 2021

            15.13.2.1. By Product Category

            15.13.2.2. By Power Source

            15.13.2.3. By Application

    15.14. South Korea

        15.14.1. Pricing Analysis

        15.14.2. Market Share Analysis, 2021

            15.14.2.1. By Product Category

            15.14.2.2. By Power Source

            15.14.2.3. By Application

    15.15. India

        15.15.1. Pricing Analysis

        15.15.2. Market Share Analysis, 2021

            15.15.2.1. By Product Category

            15.15.2.2. By Power Source

            15.15.2.3. By Application

    15.16. ASEAN

        15.16.1. Pricing Analysis

        15.16.2. Market Share Analysis, 2021

            15.16.2.1. By Product Category

            15.16.2.2. By Power Source

            15.16.2.3. By Application

    15.17. Australia and New Zealand

        15.17.1. Pricing Analysis

        15.17.2. Market Share Analysis, 2021

            15.17.2.1. By Product Category

            15.17.2.2. By Power Source

            15.17.2.3. By Application

    15.18. GCC Countries

        15.18.1. Pricing Analysis

        15.18.2. Market Share Analysis, 2021

            15.18.2.1. By Product Category

            15.18.2.2. By Power Source

            15.18.2.3. By Application

    15.19. Turkey

        15.19.1. Pricing Analysis

        15.19.2. Market Share Analysis, 2021

            15.19.2.1. By Product Category

            15.19.2.2. By Power Source

            15.19.2.3. By Application

    15.20. South Africa

        15.20.1. Pricing Analysis

        15.20.2. Market Share Analysis, 2021

            15.20.2.1. By Product Category

            15.20.2.2. By Power Source

            15.20.2.3. By Application

16. Market Structure Analysis

    16.1. Competition Dashboard

    16.2. Competition Benchmarking

    16.3. Market Share Analysis of Top Players

        16.3.1. By Regional

        16.3.2. By Product Category

        16.3.3. By Power Source

        16.3.4. By Application

17. Competition Analysis

    17.1. Competition Deep Dive

        17.1.1. ABB

            17.1.1.1. Overview

            17.1.1.2. Product Portfolio

            17.1.1.3. Profitability by Market Segments

            17.1.1.4. Sales Footprint

            17.1.1.5. Strategy Overview

                17.1.1.5.1. Marketing Strategy

                17.1.1.5.2. Product Strategy

                17.1.1.5.3. Channel Strategy

        17.1.2. Delta Electronics

            17.1.2.1. Overview

            17.1.2.2. Product Portfolio

            17.1.2.3. Profitability by Market Segments

            17.1.2.4. Sales Footprint

            17.1.2.5. Strategy Overview

                17.1.2.5.1. Marketing Strategy

                17.1.2.5.2. Product Strategy

                17.1.2.5.3. Channel Strategy

        17.1.3. Eaton

            17.1.3.1. Overview

            17.1.3.2. Product Portfolio

            17.1.3.3. Profitability by Market Segments

            17.1.3.4. Sales Footprint

            17.1.3.5. Strategy Overview

                17.1.3.5.1. Marketing Strategy

                17.1.3.5.2. Product Strategy

                17.1.3.5.3. Channel Strategy

        17.1.4. Schneider Electric

            17.1.4.1. Overview

            17.1.4.2. Product Portfolio

            17.1.4.3. Profitability by Market Segments

            17.1.4.4. Sales Footprint

            17.1.4.5. Strategy Overview

                17.1.4.5.1. Marketing Strategy

                17.1.4.5.2. Product Strategy

                17.1.4.5.3. Channel Strategy

        17.1.5. Huawei Technologies Co., Ltd.

            17.1.5.1. Overview

            17.1.5.2. Product Portfolio

            17.1.5.3. Profitability by Market Segments

            17.1.5.4. Sales Footprint

            17.1.5.5. Strategy Overview

                17.1.5.5.1. Marketing Strategy

                17.1.5.5.2. Product Strategy

                17.1.5.5.3. Channel Strategy

        17.1.6. Cummins Inc.

            17.1.6.1. Overview

            17.1.6.2. Product Portfolio

            17.1.6.3. Profitability by Market Segments

            17.1.6.4. Sales Footprint

            17.1.6.5. Strategy Overview

                17.1.6.5.1. Marketing Strategy

                17.1.6.5.2. Product Strategy

                17.1.6.5.3. Channel Strategy

        17.1.7. Alpha Technologies

            17.1.7.1. Overview

            17.1.7.2. Product Portfolio

            17.1.7.3. Profitability by Market Segments

            17.1.7.4. Sales Footprint

            17.1.7.5. Strategy Overview

                17.1.7.5.1. Marketing Strategy

                17.1.7.5.2. Product Strategy

                17.1.7.5.3. Channel Strategy

        17.1.8. Vertiv Co.

            17.1.8.1. Overview

            17.1.8.2. Product Portfolio

            17.1.8.3. Profitability by Market Segments

            17.1.8.4. Sales Footprint

            17.1.8.5. Strategy Overview

                17.1.8.5.1. Marketing Strategy

                17.1.8.5.2. Product Strategy

                17.1.8.5.3. Channel Strategy

        17.1.9. ZTE Corporation

            17.1.9.1. Overview

            17.1.9.2. Product Portfolio

            17.1.9.3. Profitability by Market Segments

            17.1.9.4. Sales Footprint

            17.1.9.5. Strategy Overview

                17.1.9.5.1. Marketing Strategy

                17.1.9.5.2. Product Strategy

                17.1.9.5.3. Channel Strategy

        17.1.10. Ascot Industrial S.R.L.

            17.1.10.1. Overview

            17.1.10.2. Product Portfolio

            17.1.10.3. Profitability by Market Segments

            17.1.10.4. Sales Footprint

            17.1.10.5. Strategy Overview

                17.1.10.5.1. Marketing Strategy

                17.1.10.5.2. Product Strategy

                17.1.10.5.3. Channel Strategy

        17.1.11. Beijing Dynamic Power Co. Ltd.

            17.1.11.1. Overview

            17.1.11.2. Product Portfolio

            17.1.11.3. Profitability by Market Segments

            17.1.11.4. Sales Footprint

            17.1.11.5. Strategy Overview

                17.1.11.5.1. Marketing Strategy

                17.1.11.5.2. Product Strategy

                17.1.11.5.3. Channel Strategy

        17.1.12. Staticon Ltd.

            17.1.12.1. Overview

            17.1.12.2. Product Portfolio

            17.1.12.3. Profitability by Market Segments

            17.1.12.4. Sales Footprint

            17.1.12.5. Strategy Overview

                17.1.12.5.1. Marketing Strategy

                17.1.12.5.2. Product Strategy

                17.1.12.5.3. Channel Strategy

        17.1.13. AEG Power Solutions

            17.1.13.1. Overview

            17.1.13.2. Product Portfolio

            17.1.13.3. Profitability by Market Segments

            17.1.13.4. Sales Footprint

            17.1.13.5. Strategy Overview

                17.1.13.5.1. Marketing Strategy

                17.1.13.5.2. Product Strategy

                17.1.13.5.3. Channel Strategy

        17.1.14. Myers Power Products, Inc.

            17.1.14.1. Overview

            17.1.14.2. Product Portfolio

            17.1.14.3. Profitability by Market Segments

            17.1.14.4. Sales Footprint

            17.1.14.5. Strategy Overview

                17.1.14.5.1. Marketing Strategy

                17.1.14.5.2. Product Strategy

                17.1.14.5.3. Channel Strategy

        17.1.15. Unipower

            17.1.15.1. Overview

            17.1.15.2. Product Portfolio

            17.1.15.3. Profitability by Market Segments

            17.1.15.4. Sales Footprint

            17.1.15.5. Strategy Overview

                17.1.15.5.1. Marketing Strategy

                17.1.15.5.2. Product Strategy

                17.1.15.5.3. Channel Strategy

18. Assumptions & Acronyms Used

19. Research Methodology

List of Tables

Table 1: Global Market Value (US$ Mn) Forecast by Region, 2017-2032

Table 2: Global Market Volume (Units) Forecast by Region, 2017-2032

Table 3: Global Market Value (US$ Mn) Forecast by Product Category, 2017-2032

Table 4: Global Market Volume (Units) Forecast by Product Category, 2017-2032

Table 5: Global Market Value (US$ Mn) Forecast by Power Source, 2017-2032

Table 6: Global Market Volume (Units) Forecast by Power Source, 2017-2032

Table 7: Global Market Value (US$ Mn) Forecast by Application, 2017-2032

Table 8: Global Market Volume (Units) Forecast by Application, 2017-2032

Table 9: North America Market Value (US$ Mn) Forecast by Country, 2017-2032

Table 10: North America Market Volume (Units) Forecast by Country, 2017-2032

Table 11: North America Market Value (US$ Mn) Forecast by Product Category, 2017-2032

Table 12: North America Market Volume (Units) Forecast by Product Category, 2017-2032

Table 13: North America Market Value (US$ Mn) Forecast by Power Source, 2017-2032

Table 14: North America Market Volume (Units) Forecast by Power Source, 2017-2032

Table 15: North America Market Value (US$ Mn) Forecast by Application, 2017-2032

Table 16: North America Market Volume (Units) Forecast by Application, 2017-2032

Table 17: Latin America Market Value (US$ Mn) Forecast by Country, 2017-2032

Table 18: Latin America Market Volume (Units) Forecast by Country, 2017-2032

Table 19: Latin America Market Value (US$ Mn) Forecast by Product Category, 2017-2032

Table 20: Latin America Market Volume (Units) Forecast by Product Category, 2017-2032

Table 21: Latin America Market Value (US$ Mn) Forecast by Power Source, 2017-2032

Table 22: Latin America Market Volume (Units) Forecast by Power Source, 2017-2032

Table 23: Latin America Market Value (US$ Mn) Forecast by Application, 2017-2032

Table 24: Latin America Market Volume (Units) Forecast by Application, 2017-2032

Table 25: Europe Market Value (US$ Mn) Forecast by Country, 2017-2032

Table 26: Europe Market Volume (Units) Forecast by Country, 2017-2032

Table 27: Europe Market Value (US$ Mn) Forecast by Product Category, 2017-2032

Table 28: Europe Market Volume (Units) Forecast by Product Category, 2017-2032

Table 29: Europe Market Value (US$ Mn) Forecast by Power Source, 2017-2032

Table 30: Europe Market Volume (Units) Forecast by Power Source, 2017-2032

Table 31: Europe Market Value (US$ Mn) Forecast by Application, 2017-2032

Table 32: Europe Market Volume (Units) Forecast by Application, 2017-2032

Table 33: East Asia Market Value (US$ Mn) Forecast by Country, 2017-2032

Table 34: East Asia Market Volume (Units) Forecast by Country, 2017-2032

Table 35: East Asia Market Value (US$ Mn) Forecast by Product Category, 2017-2032

Table 36: East Asia Market Volume (Units) Forecast by Product Category, 2017-2032

Table 37: East Asia Market Value (US$ Mn) Forecast by Power Source, 2017-2032

Table 38: East Asia Market Volume (Units) Forecast by Power Source, 2017-2032

Table 39: East Asia Market Value (US$ Mn) Forecast by Application, 2017-2032

Table 40: East Asia Market Volume (Units) Forecast by Application, 2017-2032

Table 41: South Asia & Pacific Market Value (US$ Mn) Forecast by Country, 2017-2032

Table 42: South Asia & Pacific Market Volume (Units) Forecast by Country, 2017-2032

Table 43: South Asia & Pacific Market Value (US$ Mn) Forecast by Product Category, 2017-2032

Table 44: South Asia & Pacific Market Volume (Units) Forecast by Product Category, 2017-2032

Table 45: South Asia & Pacific Market Value (US$ Mn) Forecast by Power Source, 2017-2032

Table 46: South Asia & Pacific Market Volume (Units) Forecast by Power Source, 2017-2032

Table 47: South Asia & Pacific Market Value (US$ Mn) Forecast by Application, 2017-2032

Table 48: South Asia & Pacific Market Volume (Units) Forecast by Application, 2017-2032

Table 49: MEA Market Value (US$ Mn) Forecast by Country, 2017-2032

Table 50: MEA Market Volume (Units) Forecast by Country, 2017-2032

Table 51: MEA Market Value (US$ Mn) Forecast by Product Category, 2017-2032

Table 52: MEA Market Volume (Units) Forecast by Product Category, 2017-2032

Table 53: MEA Market Value (US$ Mn) Forecast by Power Source, 2017-2032

Table 54: MEA Market Volume (Units) Forecast by Power Source, 2017-2032

Table 55: MEA Market Value (US$ Mn) Forecast by Application, 2017-2032

Table 56: MEA Market Volume (Units) Forecast by Application, 2017-2032

List of Charts

Figure 1: Global Market Value (US$ Mn) by Product Category, 2022-2032

Figure 2: Global Market Value (US$ Mn) by Power Source, 2022-2032

Figure 3: Global Market Value (US$ Mn) by Application, 2022-2032

Figure 4: Global Market Value (US$ Mn) by Region, 2022-2032

Figure 5: Global Market Value (US$ Mn) Analysis by Region, 2017-2032

Figure 6: Global Market Volume (Units) Analysis by Region, 2017-2032

Figure 7: Global Market Value Share (%) and BPS Analysis by Region, 2022-2032

Figure 8: Global Market Y-o-Y Growth (%) Projections by Region, 2022-2032

Figure 9: Global Market Value (US$ Mn) Analysis by Product Category, 2017-2032

Figure 10: Global Market Volume (Units) Analysis by Product Category, 2017-2032

Figure 11: Global Market Value Share (%) and BPS Analysis by Product Category, 2022-2032

Figure 12: Global Market Y-o-Y Growth (%) Projections by Product Category, 2022-2032

Figure 13: Global Market Value (US$ Mn) Analysis by Power Source, 2017-2032

Figure 14: Global Market Volume (Units) Analysis by Power Source, 2017-2032

Figure 15: Global Market Value Share (%) and BPS Analysis by Power Source, 2022-2032

Figure 16: Global Market Y-o-Y Growth (%) Projections by Power Source, 2022-2032

Figure 17: Global Market Value (US$ Mn) Analysis by Application, 2017-2032

Figure 18: Global Market Volume (Units) Analysis by Application, 2017-2032

Figure 19: Global Market Value Share (%) and BPS Analysis by Application, 2022-2032

Figure 20: Global Market Y-o-Y Growth (%) Projections by Application, 2022-2032

Figure 21: Global Market Attractiveness by Product Category, 2022-2032

Figure 22: Global Market Attractiveness by Power Source, 2022-2032

Figure 23: Global Market Attractiveness by Application, 2022-2032

Figure 24: Global Market Attractiveness by Region, 2022-2032

Figure 25: North America Market Value (US$ Mn) by Product Category, 2022-2032

Figure 26: North America Market Value (US$ Mn) by Power Source, 2022-2032

Figure 27: North America Market Value (US$ Mn) by Application, 2022-2032

Figure 28: North America Market Value (US$ Mn) by Country, 2022-2032

Figure 29: North America Market Value (US$ Mn) Analysis by Country, 2017-2032

Figure 30: North America Market Volume (Units) Analysis by Country, 2017-2032

Figure 31: North America Market Value Share (%) and BPS Analysis by Country, 2022-2032

Figure 32: North America Market Y-o-Y Growth (%) Projections by Country, 2022-2032

Figure 33: North America Market Value (US$ Mn) Analysis by Product Category, 2017-2032

Figure 34: North America Market Volume (Units) Analysis by Product Category, 2017-2032

Figure 35: North America Market Value Share (%) and BPS Analysis by Product Category, 2022-2032

Figure 36: North America Market Y-o-Y Growth (%) Projections by Product Category, 2022-2032

Figure 37: North America Market Value (US$ Mn) Analysis by Power Source, 2017-2032

Figure 38: North America Market Volume (Units) Analysis by Power Source, 2017-2032

Figure 39: North America Market Value Share (%) and BPS Analysis by Power Source, 2022-2032

Figure 40: North America Market Y-o-Y Growth (%) Projections by Power Source, 2022-2032

Figure 41: North America Market Value (US$ Mn) Analysis by Application, 2017-2032

Figure 42: North America Market Volume (Units) Analysis by Application, 2017-2032

Figure 43: North America Market Value Share (%) and BPS Analysis by Application, 2022-2032

Figure 44: North America Market Y-o-Y Growth (%) Projections by Application, 2022-2032

Figure 45: North America Market Attractiveness by Product Category, 2022-2032

Figure 46: North America Market Attractiveness by Power Source, 2022-2032

Figure 47: North America Market Attractiveness by Application, 2022-2032

Figure 48: North America Market Attractiveness by Country, 2022-2032

Figure 49: Latin America Market Value (US$ Mn) by Product Category, 2022-2032

Figure 50: Latin America Market Value (US$ Mn) by Power Source, 2022-2032

Figure 51: Latin America Market Value (US$ Mn) by Application, 2022-2032

Figure 52: Latin America Market Value (US$ Mn) by Country, 2022-2032

Figure 53: Latin America Market Value (US$ Mn) Analysis by Country, 2017-2032

Figure 54: Latin America Market Volume (Units) Analysis by Country, 2017-2032

Figure 55: Latin America Market Value Share (%) and BPS Analysis by Country, 2022-2032

Figure 56: Latin America Market Y-o-Y Growth (%) Projections by Country, 2022-2032

Figure 57: Latin America Market Value (US$ Mn) Analysis by Product Category, 2017-2032

Figure 58: Latin America Market Volume (Units) Analysis by Product Category, 2017-2032

Figure 59: Latin America Market Value Share (%) and BPS Analysis by Product Category, 2022-2032

Figure 60: Latin America Market Y-o-Y Growth (%) Projections by Product Category, 2022-2032

Figure 61: Latin America Market Value (US$ Mn) Analysis by Power Source, 2017-2032

Figure 62: Latin America Market Volume (Units) Analysis by Power Source, 2017-2032

Figure 63: Latin America Market Value Share (%) and BPS Analysis by Power Source, 2022-2032

Figure 64: Latin America Market Y-o-Y Growth (%) Projections by Power Source, 2022-2032

Figure 65: Latin America Market Value (US$ Mn) Analysis by Application, 2017-2032

Figure 66: Latin America Market Volume (Units) Analysis by Application, 2017-2032

Figure 67: Latin America Market Value Share (%) and BPS Analysis by Application, 2022-2032

Figure 68: Latin America Market Y-o-Y Growth (%) Projections by Application, 2022-2032

Figure 69: Latin America Market Attractiveness by Product Category, 2022-2032

Figure 70: Latin America Market Attractiveness by Power Source, 2022-2032

Figure 71: Latin America Market Attractiveness by Application, 2022-2032

Figure 72: Latin America Market Attractiveness by Country, 2022-2032

Figure 73: Europe Market Value (US$ Mn) by Product Category, 2022-2032

Figure 74: Europe Market Value (US$ Mn) by Power Source, 2022-2032

Figure 75: Europe Market Value (US$ Mn) by Application, 2022-2032

Figure 76: Europe Market Value (US$ Mn) by Country, 2022-2032

Figure 77: Europe Market Value (US$ Mn) Analysis by Country, 2017-2032

Figure 78: Europe Market Volume (Units) Analysis by Country, 2017-2032

Figure 79: Europe Market Value Share (%) and BPS Analysis by Country, 2022-2032

Figure 80: Europe Market Y-o-Y Growth (%) Projections by Country, 2022-2032

Figure 81: Europe Market Value (US$ Mn) Analysis by Product Category, 2017-2032

Figure 82: Europe Market Volume (Units) Analysis by Product Category, 2017-2032

Figure 83: Europe Market Value Share (%) and BPS Analysis by Product Category, 2022-2032

Figure 84: Europe Market Y-o-Y Growth (%) Projections by Product Category, 2022-2032

Figure 85: Europe Market Value (US$ Mn) Analysis by Power Source, 2017-2032

Figure 86: Europe Market Volume (Units) Analysis by Power Source, 2017-2032

Figure 87: Europe Market Value Share (%) and BPS Analysis by Power Source, 2022-2032

Figure 88: Europe Market Y-o-Y Growth (%) Projections by Power Source, 2022-2032

Figure 89: Europe Market Value (US$ Mn) Analysis by Application, 2017-2032

Figure 90: Europe Market Volume (Units) Analysis by Application, 2017-2032

Figure 91: Europe Market Value Share (%) and BPS Analysis by Application, 2022-2032

Figure 92: Europe Market Y-o-Y Growth (%) Projections by Application, 2022-2032

Figure 93: Europe Market Attractiveness by Product Category, 2022-2032

Figure 94: Europe Market Attractiveness by Power Source, 2022-2032

Figure 95: Europe Market Attractiveness by Application, 2022-2032

Figure 96: Europe Market Attractiveness by Country, 2022-2032

Figure 97: East Asia Market Value (US$ Mn) by Product Category, 2022-2032

Figure 98: East Asia Market Value (US$ Mn) by Power Source, 2022-2032

Figure 99: East Asia Market Value (US$ Mn) by Application, 2022-2032

Figure 100: East Asia Market Value (US$ Mn) by Country, 2022-2032

Figure 101: East Asia Market Value (US$ Mn) Analysis by Country, 2017-2032

Figure 102: East Asia Market Volume (Units) Analysis by Country, 2017-2032

Figure 103: East Asia Market Value Share (%) and BPS Analysis by Country, 2022-2032

Figure 104: East Asia Market Y-o-Y Growth (%) Projections by Country, 2022-2032

Figure 105: East Asia Market Value (US$ Mn) Analysis by Product Category, 2017-2032

Figure 106: East Asia Market Volume (Units) Analysis by Product Category, 2017-2032

Figure 107: East Asia Market Value Share (%) and BPS Analysis by Product Category, 2022-2032

Figure 108: East Asia Market Y-o-Y Growth (%) Projections by Product Category, 2022-2032

Figure 109: East Asia Market Value (US$ Mn) Analysis by Power Source, 2017-2032

Figure 110: East Asia Market Volume (Units) Analysis by Power Source, 2017-2032

Figure 111: East Asia Market Value Share (%) and BPS Analysis by Power Source, 2022-2032

Figure 112: East Asia Market Y-o-Y Growth (%) Projections by Power Source, 2022-2032

Figure 113: East Asia Market Value (US$ Mn) Analysis by Application, 2017-2032

Figure 114: East Asia Market Volume (Units) Analysis by Application, 2017-2032

Figure 115: East Asia Market Value Share (%) and BPS Analysis by Application, 2022-2032

Figure 116: East Asia Market Y-o-Y Growth (%) Projections by Application, 2022-2032

Figure 117: East Asia Market Attractiveness by Product Category, 2022-2032

Figure 118: East Asia Market Attractiveness by Power Source, 2022-2032

Figure 119: East Asia Market Attractiveness by Application, 2022-2032

Figure 120: East Asia Market Attractiveness by Country, 2022-2032

Figure 121: South Asia & Pacific Market Value (US$ Mn) by Product Category, 2022-2032

Figure 122: South Asia & Pacific Market Value (US$ Mn) by Power Source, 2022-2032

Figure 123: South Asia & Pacific Market Value (US$ Mn) by Application, 2022-2032

Figure 124: South Asia & Pacific Market Value (US$ Mn) by Country, 2022-2032

Figure 125: South Asia & Pacific Market Value (US$ Mn) Analysis by Country, 2017-2032

Figure 126: South Asia & Pacific Market Volume (Units) Analysis by Country, 2017-2032

Figure 127: South Asia & Pacific Market Value Share (%) and BPS Analysis by Country, 2022-2032

Figure 128: South Asia & Pacific Market Y-o-Y Growth (%) Projections by Country, 2022-2032

Figure 129: South Asia & Pacific Market Value (US$ Mn) Analysis by Product Category, 2017-2032

Figure 130: South Asia & Pacific Market Volume (Units) Analysis by Product Category, 2017-2032

Figure 131: South Asia & Pacific Market Value Share (%) and BPS Analysis by Product Category, 2022-2032

Figure 132: South Asia & Pacific Market Y-o-Y Growth (%) Projections by Product Category, 2022-2032

Figure 133: South Asia & Pacific Market Value (US$ Mn) Analysis by Power Source, 2017-2032

Figure 134: South Asia & Pacific Market Volume (Units) Analysis by Power Source, 2017-2032

Figure 135: South Asia & Pacific Market Value Share (%) and BPS Analysis by Power Source, 2022-2032

Figure 136: South Asia & Pacific Market Y-o-Y Growth (%) Projections by Power Source, 2022-2032

Figure 137: South Asia & Pacific Market Value (US$ Mn) Analysis by Application, 2017-2032

Figure 138: South Asia & Pacific Market Volume (Units) Analysis by Application, 2017-2032

Figure 139: South Asia & Pacific Market Value Share (%) and BPS Analysis by Application, 2022-2032

Figure 140: South Asia & Pacific Market Y-o-Y Growth (%) Projections by Application, 2022-2032

Figure 141: South Asia & Pacific Market Attractiveness by Product Category, 2022-2032

Figure 142: South Asia & Pacific Market Attractiveness by Power Source, 2022-2032

Figure 143: South Asia & Pacific Market Attractiveness by Application, 2022-2032

Figure 144: South Asia & Pacific Market Attractiveness by Country, 2022-2032

Figure 145: MEA Market Value (US$ Mn) by Product Category, 2022-2032

Figure 146: MEA Market Value (US$ Mn) by Power Source, 2022-2032

Figure 147: MEA Market Value (US$ Mn) by Application, 2022-2032

Figure 148: MEA Market Value (US$ Mn) by Country, 2022-2032

Figure 149: MEA Market Value (US$ Mn) Analysis by Country, 2017-2032

Figure 150: MEA Market Volume (Units) Analysis by Country, 2017-2032

Figure 151: MEA Market Value Share (%) and BPS Analysis by Country, 2022-2032

Figure 152: MEA Market Y-o-Y Growth (%) Projections by Country, 2022-2032

Figure 153: MEA Market Value (US$ Mn) Analysis by Product Category, 2017-2032

Figure 154: MEA Market Volume (Units) Analysis by Product Category, 2017-2032

Figure 155: MEA Market Value Share (%) and BPS Analysis by Product Category, 2022-2032

Figure 156: MEA Market Y-o-Y Growth (%) Projections by Product Category, 2022-2032

Figure 157: MEA Market Value (US$ Mn) Analysis by Power Source, 2017-2032

Figure 158: MEA Market Volume (Units) Analysis by Power Source, 2017-2032

Figure 159: MEA Market Value Share (%) and BPS Analysis by Power Source, 2022-2032

Figure 160: MEA Market Y-o-Y Growth (%) Projections by Power Source, 2022-2032

Figure 161: MEA Market Value (US$ Mn) Analysis by Application, 2017-2032

Figure 162: MEA Market Volume (Units) Analysis by Application, 2017-2032

Figure 163: MEA Market Value Share (%) and BPS Analysis by Application, 2022-2032

Figure 164: MEA Market Y-o-Y Growth (%) Projections by Application, 2022-2032

Figure 165: MEA Market Attractiveness by Product Category, 2022-2032

Figure 166: MEA Market Attractiveness by Power Source, 2022-2032

Figure 167: MEA Market Attractiveness by Application, 2022-2032

Figure 168: MEA Market Attractiveness by Country, 2022-2032

Recommendations

Technology

Green Power Market

Published : January 2023

Technology

Wireless Power Transmission Market

Published : September 2022

Technology

Digital Power Conversion Market

Published : June 2022

Explore Technology Insights

View Reports

Telecom Power Systems Market