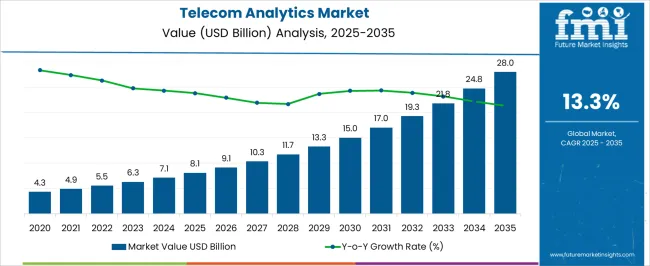
The telecom analytics market analysis report by Future Market Insights shows that the global telecom analytics market is estimated to reach USD 6.21 billion in 2023. The projected market growth from 2023 to 2033 is expected to be 13.9%.
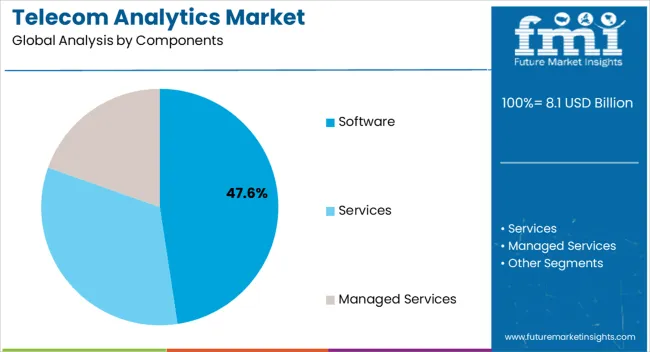
Telecom analytics software is expected to be the highest revenue-generating segment, projected to record a CAGR of over 13.5% from 2023 to 2033.
Attributes | Details |
---|---|
Global Telecom Analytics Market Size (2023) | USD 6.21 billion |
Global Telecom Analytics Market Size (2033) | USD 22.91 billion |
Global Telecom Analytics Market CAGR (2023 to 2033) | 13.9% |
United States Telecom Analytics Market Size (2033) | USD 7.1 billion |
United States Telecom Analytics Market CAGR (2023 to 2033) | 13.4% |
Key Companies Covered | SAP; Oracle; IBM; SAS Institute; Adobe; Cisco; Teradata; Micro Focus; TIBCO; MicroStrategy; Tableau; Panorama Software; Qlik; OpenText; Alteryx; Sisense |
As per the telecom analytics market research by Future Market Insights - a market research and competitive intelligence provider, historically, from 2018 to 2022, the value of the telecom analytics market increased at around 11.8% CAGR.
The rising need for customer churn prevention, demand for better revenue control, increased cyber threats, and unusual activities are projected to drive market expansion. However, telecom operators' lack of understanding of telecom analytics is projected to limit market growth.
Furthermore, the importance of Private Branch Exchange (PBX) in internal systems, mobile device vulnerabilities, and customer and network data analytics to develop a focused upselling plan for successful subscriber engagement is projected to offer growth to the market.
The adoption of analytics products and services by telecom providers has been enormously successful. One of the primary reasons predicted to fuel the market's development prospects during the projected period is the increased implementation of telecom analytics for lowering churn and enhancing customer loyalty.
As per Quantzig, telecom businesses may cut customer turnover by 50% while increasing recurring customers by 15%. Therefore, telecom service providers employ analytics tools to improve customer service, minimize revenue losses, and cut sales and marketing expenses.
The demand to optimize corporate activities that influence revenue is also driving the expansion of the telecom analytics industry. Telecom firms' revenue is primarily determined by customers, the sale of value-added solutions, billing rates, and other factors.
Telecom analytics systems may offer qualitative and quantitative metrics and subjective Key Performance Indicators (KPIs) measures to various applications for business, network, or consumer use cases.
This may assist in monitoring crucial subscriber decisions, which affect revenues, by calculating propensity scores from pertinent information such as subscriber experiences (xDRs), region, associates (TAP), network (probes), and activities (logs). Owing to these features, the market is likely to develop throughout the forecast period.
Furthermore, IoT, Data Science, and Big Data technologies provide significant prospects for data-driven company optimization in terms of revenue maximization, customer comprehension, and cost efficiency. In today's data-heavy environment, communication, social media platforms, phone data records, consumer habits, payment details, and government websites generate massive amounts of data.
Telecom providers need help managing this increase in data volume. When data is acquired properly and correctly evaluated, it can provide important insights. Consequently, the increasing adoption of new technologies in the telecom industry is projected to boost market development possibilities in the near future.
Telecommunications firms are focusing on enhancing network resilience and determining how COVID-19 may affect their planned investments, notably in 5G. These companies are also constantly improving to help customers needing internet connectivity more than ever. Data is being used as a tool in certain nations to track and restrict the transmission of the virus.
Some potential impact includes increased network usage, with several telecom companies reporting significant surges. The frequency of voice calls is also expanding significantly in some nations. Network reliability has also become a constant concern. Europe's network infrastructure is seeing spikes in connection loss rates, decreased audio quality, and connection rate decreases.
The European Union has attempted to prevent potential disruptions by requesting that streaming services limit image quality. In the United States, operators are growing capacities by leasing spectrum from competitors.
Due to the wide environment and huge mobile population in China, good connectivity and data sharing have been critical in checking for infected persons and managing the outbreak.
During the projected period, North America held the largest share in the global telecom analytics market, with a market size of USD 7.1 billion by 2033. The telecom industry in North America is primarily growing owing to significant expenditure on analytics solutions.
The existence of some industry's most notable firms, such as IBM Corporation and Oracle Corporation, is another factor affecting regional growth. Furthermore, the telecom business in North America is widespread, with the growing use of communication products.
This widespread distribution of the telecom business creates massive amounts of data, which aids market expansion in the region.
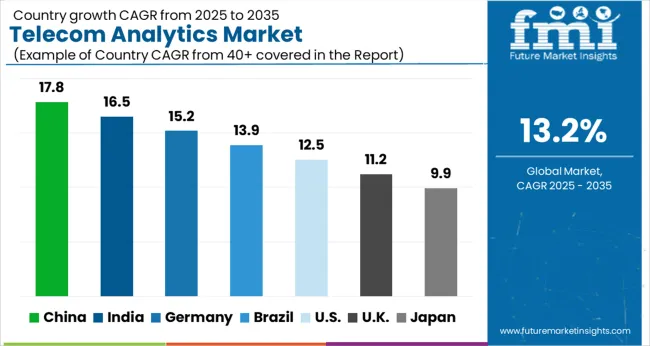
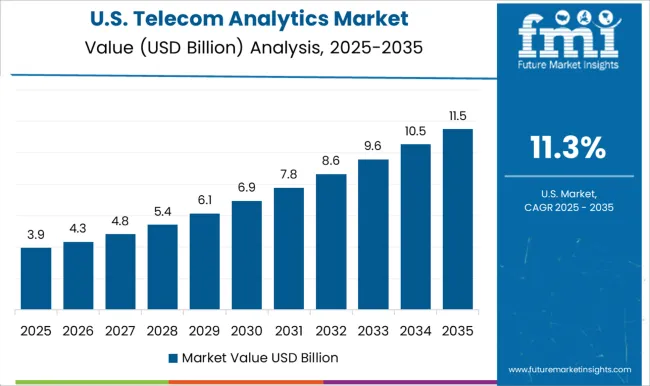
The United States is expected to account for the leading market share of USD 7.1 billion by the end of 2033 with an expected CAGR of 13.4% by the end of 2033.
Constant progressions in IT technology and infrastructures used for customer support, the presence of a large variety of market vendors, and the availability of skilled technical knowledge related to managing modern consumer needs and helpdesk software are the key factors fuelling the telecom analytics market in the country.
The United States is home to some world's key cellular service providers, which rely heavily on client feedback. Thus, by utilizing telecom analytics, communications service providers (CSPs) in the region may deliver higher-quality service while reducing costs. Verizon, a large telecommunications firm in the United States has established several AI and analytics units.
The Data Science and Artificial Intelligence department, for example, is concerned with bringing analytics and cognitive technologies to Verizon's interactions with consumers. The need for consumer analytics solutions is projected to rise as more organizations follow suit.
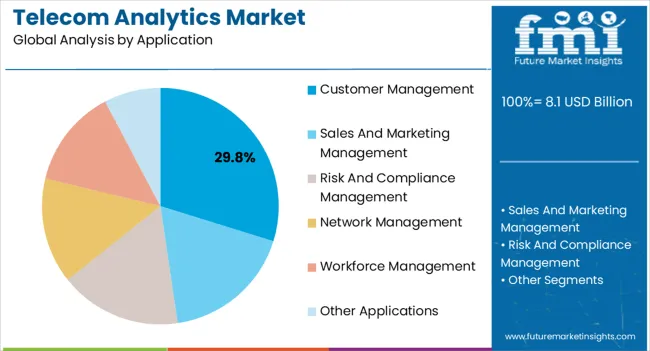
Customer Management segment is forecasted to record a CAGR of over 13.4% from 2023 to 2033. Telecom companies are spending more on client maintenance and retention.
However, the price opinion of offering solutions and services to clients has remained the same, resulting in flat revenues. Despite the industry's effective customer-first management model, consumer requirements have rapidly evolved.
The demand for telecom analytics software is forecasted to register a CAGR of around 13.5% from 2023 to 2033.
Telecom Analytics Software is being deployed in the telecom sector to meet their complex business intelligence needs, including risk management, churn reduction, fraud identification, up-sell, and cross-sell product and service plans.
Telecom analytics software assists in reducing risk and making sound business decisions. Furthermore, it helps businesses differentiate themselves through a competitive strategy and brings forth subscriber-focused scores to aid in revenue growth. As a result of the advantages of telecom analytics, the industry is expected to grow significantly during the projected period.
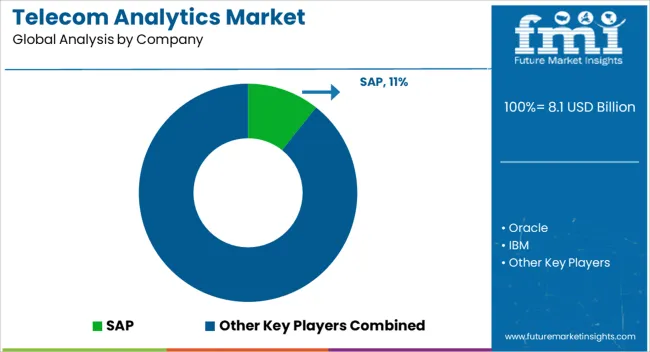
The industry is segmented and characterized by intense rivalry among key operational firms. The leading companies are concentrating on increasing their market presence through various tactics such as acquisitions, mergers, and joint ventures or partnerships.
These techniques also assist firms in regionally expanding their business operations and improving their regional offers.
The industry rivalry is expected to heat up even further as more businesses focus on developing innovative, cost-effective telecom analytics products and services. As a result, the market's leading players are looking forward to developing solutions that best fulfill the needs of telecom operators.
Recent Developments
Table 1: Global Market Value (US$ Million) Forecast by Region, 2018 to 2033
Table 2: Global Market Value (US$ Million) Forecast by Components, 2018 to 2033
Table 3: Global Market Value (US$ Million) Forecast by Application, 2018 to 2033
Table 4: Global Market Value (US$ Million) Forecast by Deployment Mode , 2018 to 2033
Table 5: Global Market Value (US$ Million) Forecast by Organization Size, 2018 to 2033
Table 6: North America Market Value (US$ Million) Forecast by Country, 2018 to 2033
Table 7: North America Market Value (US$ Million) Forecast by Components, 2018 to 2033
Table 8: North America Market Value (US$ Million) Forecast by Application, 2018 to 2033
Table 9: North America Market Value (US$ Million) Forecast by Deployment Mode , 2018 to 2033
Table 10: North America Market Value (US$ Million) Forecast by Organization Size, 2018 to 2033
Table 11: Latin America Market Value (US$ Million) Forecast by Country, 2018 to 2033
Table 12: Latin America Market Value (US$ Million) Forecast by Components, 2018 to 2033
Table 13: Latin America Market Value (US$ Million) Forecast by Application, 2018 to 2033
Table 14: Latin America Market Value (US$ Million) Forecast by Deployment Mode , 2018 to 2033
Table 15: Latin America Market Value (US$ Million) Forecast by Organization Size, 2018 to 2033
Table 16: Western Europe Market Value (US$ Million) Forecast by Country, 2018 to 2033
Table 17: Western Europe Market Value (US$ Million) Forecast by Components, 2018 to 2033
Table 18: Western Europe Market Value (US$ Million) Forecast by Application, 2018 to 2033
Table 19: Western Europe Market Value (US$ Million) Forecast by Deployment Mode , 2018 to 2033
Table 20: Western Europe Market Value (US$ Million) Forecast by Organization Size, 2018 to 2033
Table 21: Eastern Europe Market Value (US$ Million) Forecast by Country, 2018 to 2033
Table 22: Eastern Europe Market Value (US$ Million) Forecast by Components, 2018 to 2033
Table 23: Eastern Europe Market Value (US$ Million) Forecast by Application, 2018 to 2033
Table 24: Eastern Europe Market Value (US$ Million) Forecast by Deployment Mode , 2018 to 2033
Table 25: Eastern Europe Market Value (US$ Million) Forecast by Organization Size, 2018 to 2033
Table 26: South Asia and Pacific Market Value (US$ Million) Forecast by Country, 2018 to 2033
Table 27: South Asia and Pacific Market Value (US$ Million) Forecast by Components, 2018 to 2033
Table 28: South Asia and Pacific Market Value (US$ Million) Forecast by Application, 2018 to 2033
Table 29: South Asia and Pacific Market Value (US$ Million) Forecast by Deployment Mode , 2018 to 2033
Table 30: South Asia and Pacific Market Value (US$ Million) Forecast by Organization Size, 2018 to 2033
Table 31: East Asia Market Value (US$ Million) Forecast by Country, 2018 to 2033
Table 32: East Asia Market Value (US$ Million) Forecast by Components, 2018 to 2033
Table 33: East Asia Market Value (US$ Million) Forecast by Application, 2018 to 2033
Table 34: East Asia Market Value (US$ Million) Forecast by Deployment Mode , 2018 to 2033
Table 35: East Asia Market Value (US$ Million) Forecast by Organization Size, 2018 to 2033
Table 36: Middle East and Africa Market Value (US$ Million) Forecast by Country, 2018 to 2033
Table 37: Middle East and Africa Market Value (US$ Million) Forecast by Components, 2018 to 2033
Table 38: Middle East and Africa Market Value (US$ Million) Forecast by Application, 2018 to 2033
Table 39: Middle East and Africa Market Value (US$ Million) Forecast by Deployment Mode , 2018 to 2033
Table 40: Middle East and Africa Market Value (US$ Million) Forecast by Organization Size, 2018 to 2033
Figure 1: Global Market Value (US$ Million) by Components, 2023 to 2033
Figure 2: Global Market Value (US$ Million) by Application, 2023 to 2033
Figure 3: Global Market Value (US$ Million) by Deployment Mode , 2023 to 2033
Figure 4: Global Market Value (US$ Million) by Organization Size, 2023 to 2033
Figure 5: Global Market Value (US$ Million) by Region, 2023 to 2033
Figure 6: Global Market Value (US$ Million) Analysis by Region, 2018 to 2033
Figure 7: Global Market Value Share (%) and BPS Analysis by Region, 2023 to 2033
Figure 8: Global Market Y-o-Y Growth (%) Projections by Region, 2023 to 2033
Figure 9: Global Market Value (US$ Million) Analysis by Components, 2018 to 2033
Figure 10: Global Market Value Share (%) and BPS Analysis by Components, 2023 to 2033
Figure 11: Global Market Y-o-Y Growth (%) Projections by Components, 2023 to 2033
Figure 12: Global Market Value (US$ Million) Analysis by Application, 2018 to 2033
Figure 13: Global Market Value Share (%) and BPS Analysis by Application, 2023 to 2033
Figure 14: Global Market Y-o-Y Growth (%) Projections by Application, 2023 to 2033
Figure 15: Global Market Value (US$ Million) Analysis by Deployment Mode , 2018 to 2033
Figure 16: Global Market Value Share (%) and BPS Analysis by Deployment Mode , 2023 to 2033
Figure 17: Global Market Y-o-Y Growth (%) Projections by Deployment Mode , 2023 to 2033
Figure 18: Global Market Value (US$ Million) Analysis by Organization Size, 2018 to 2033
Figure 19: Global Market Value Share (%) and BPS Analysis by Organization Size, 2023 to 2033
Figure 20: Global Market Y-o-Y Growth (%) Projections by Organization Size, 2023 to 2033
Figure 21: Global Market Attractiveness by Components, 2023 to 2033
Figure 22: Global Market Attractiveness by Application, 2023 to 2033
Figure 23: Global Market Attractiveness by Deployment Mode , 2023 to 2033
Figure 24: Global Market Attractiveness by Organization Size, 2023 to 2033
Figure 25: Global Market Attractiveness by Region, 2023 to 2033
Figure 26: North America Market Value (US$ Million) by Components, 2023 to 2033
Figure 27: North America Market Value (US$ Million) by Application, 2023 to 2033
Figure 28: North America Market Value (US$ Million) by Deployment Mode , 2023 to 2033
Figure 29: North America Market Value (US$ Million) by Organization Size, 2023 to 2033
Figure 30: North America Market Value (US$ Million) by Country, 2023 to 2033
Figure 31: North America Market Value (US$ Million) Analysis by Country, 2018 to 2033
Figure 32: North America Market Value Share (%) and BPS Analysis by Country, 2023 to 2033
Figure 33: North America Market Y-o-Y Growth (%) Projections by Country, 2023 to 2033
Figure 34: North America Market Value (US$ Million) Analysis by Components, 2018 to 2033
Figure 35: North America Market Value Share (%) and BPS Analysis by Components, 2023 to 2033
Figure 36: North America Market Y-o-Y Growth (%) Projections by Components, 2023 to 2033
Figure 37: North America Market Value (US$ Million) Analysis by Application, 2018 to 2033
Figure 38: North America Market Value Share (%) and BPS Analysis by Application, 2023 to 2033
Figure 39: North America Market Y-o-Y Growth (%) Projections by Application, 2023 to 2033
Figure 40: North America Market Value (US$ Million) Analysis by Deployment Mode , 2018 to 2033
Figure 41: North America Market Value Share (%) and BPS Analysis by Deployment Mode , 2023 to 2033
Figure 42: North America Market Y-o-Y Growth (%) Projections by Deployment Mode , 2023 to 2033
Figure 43: North America Market Value (US$ Million) Analysis by Organization Size, 2018 to 2033
Figure 44: North America Market Value Share (%) and BPS Analysis by Organization Size, 2023 to 2033
Figure 45: North America Market Y-o-Y Growth (%) Projections by Organization Size, 2023 to 2033
Figure 46: North America Market Attractiveness by Components, 2023 to 2033
Figure 47: North America Market Attractiveness by Application, 2023 to 2033
Figure 48: North America Market Attractiveness by Deployment Mode , 2023 to 2033
Figure 49: North America Market Attractiveness by Organization Size, 2023 to 2033
Figure 50: North America Market Attractiveness by Country, 2023 to 2033
Figure 51: Latin America Market Value (US$ Million) by Components, 2023 to 2033
Figure 52: Latin America Market Value (US$ Million) by Application, 2023 to 2033
Figure 53: Latin America Market Value (US$ Million) by Deployment Mode , 2023 to 2033
Figure 54: Latin America Market Value (US$ Million) by Organization Size, 2023 to 2033
Figure 55: Latin America Market Value (US$ Million) by Country, 2023 to 2033
Figure 56: Latin America Market Value (US$ Million) Analysis by Country, 2018 to 2033
Figure 57: Latin America Market Value Share (%) and BPS Analysis by Country, 2023 to 2033
Figure 58: Latin America Market Y-o-Y Growth (%) Projections by Country, 2023 to 2033
Figure 59: Latin America Market Value (US$ Million) Analysis by Components, 2018 to 2033
Figure 60: Latin America Market Value Share (%) and BPS Analysis by Components, 2023 to 2033
Figure 61: Latin America Market Y-o-Y Growth (%) Projections by Components, 2023 to 2033
Figure 62: Latin America Market Value (US$ Million) Analysis by Application, 2018 to 2033
Figure 63: Latin America Market Value Share (%) and BPS Analysis by Application, 2023 to 2033
Figure 64: Latin America Market Y-o-Y Growth (%) Projections by Application, 2023 to 2033
Figure 65: Latin America Market Value (US$ Million) Analysis by Deployment Mode , 2018 to 2033
Figure 66: Latin America Market Value Share (%) and BPS Analysis by Deployment Mode , 2023 to 2033
Figure 67: Latin America Market Y-o-Y Growth (%) Projections by Deployment Mode , 2023 to 2033
Figure 68: Latin America Market Value (US$ Million) Analysis by Organization Size, 2018 to 2033
Figure 69: Latin America Market Value Share (%) and BPS Analysis by Organization Size, 2023 to 2033
Figure 70: Latin America Market Y-o-Y Growth (%) Projections by Organization Size, 2023 to 2033
Figure 71: Latin America Market Attractiveness by Components, 2023 to 2033
Figure 72: Latin America Market Attractiveness by Application, 2023 to 2033
Figure 73: Latin America Market Attractiveness by Deployment Mode , 2023 to 2033
Figure 74: Latin America Market Attractiveness by Organization Size, 2023 to 2033
Figure 75: Latin America Market Attractiveness by Country, 2023 to 2033
Figure 76: Western Europe Market Value (US$ Million) by Components, 2023 to 2033
Figure 77: Western Europe Market Value (US$ Million) by Application, 2023 to 2033
Figure 78: Western Europe Market Value (US$ Million) by Deployment Mode , 2023 to 2033
Figure 79: Western Europe Market Value (US$ Million) by Organization Size, 2023 to 2033
Figure 80: Western Europe Market Value (US$ Million) by Country, 2023 to 2033
Figure 81: Western Europe Market Value (US$ Million) Analysis by Country, 2018 to 2033
Figure 82: Western Europe Market Value Share (%) and BPS Analysis by Country, 2023 to 2033
Figure 83: Western Europe Market Y-o-Y Growth (%) Projections by Country, 2023 to 2033
Figure 84: Western Europe Market Value (US$ Million) Analysis by Components, 2018 to 2033
Figure 85: Western Europe Market Value Share (%) and BPS Analysis by Components, 2023 to 2033
Figure 86: Western Europe Market Y-o-Y Growth (%) Projections by Components, 2023 to 2033
Figure 87: Western Europe Market Value (US$ Million) Analysis by Application, 2018 to 2033
Figure 88: Western Europe Market Value Share (%) and BPS Analysis by Application, 2023 to 2033
Figure 89: Western Europe Market Y-o-Y Growth (%) Projections by Application, 2023 to 2033
Figure 90: Western Europe Market Value (US$ Million) Analysis by Deployment Mode , 2018 to 2033
Figure 91: Western Europe Market Value Share (%) and BPS Analysis by Deployment Mode , 2023 to 2033
Figure 92: Western Europe Market Y-o-Y Growth (%) Projections by Deployment Mode , 2023 to 2033
Figure 93: Western Europe Market Value (US$ Million) Analysis by Organization Size, 2018 to 2033
Figure 94: Western Europe Market Value Share (%) and BPS Analysis by Organization Size, 2023 to 2033
Figure 95: Western Europe Market Y-o-Y Growth (%) Projections by Organization Size, 2023 to 2033
Figure 96: Western Europe Market Attractiveness by Components, 2023 to 2033
Figure 97: Western Europe Market Attractiveness by Application, 2023 to 2033
Figure 98: Western Europe Market Attractiveness by Deployment Mode , 2023 to 2033
Figure 99: Western Europe Market Attractiveness by Organization Size, 2023 to 2033
Figure 100: Western Europe Market Attractiveness by Country, 2023 to 2033
Figure 101: Eastern Europe Market Value (US$ Million) by Components, 2023 to 2033
Figure 102: Eastern Europe Market Value (US$ Million) by Application, 2023 to 2033
Figure 103: Eastern Europe Market Value (US$ Million) by Deployment Mode , 2023 to 2033
Figure 104: Eastern Europe Market Value (US$ Million) by Organization Size, 2023 to 2033
Figure 105: Eastern Europe Market Value (US$ Million) by Country, 2023 to 2033
Figure 106: Eastern Europe Market Value (US$ Million) Analysis by Country, 2018 to 2033
Figure 107: Eastern Europe Market Value Share (%) and BPS Analysis by Country, 2023 to 2033
Figure 108: Eastern Europe Market Y-o-Y Growth (%) Projections by Country, 2023 to 2033
Figure 109: Eastern Europe Market Value (US$ Million) Analysis by Components, 2018 to 2033
Figure 110: Eastern Europe Market Value Share (%) and BPS Analysis by Components, 2023 to 2033
Figure 111: Eastern Europe Market Y-o-Y Growth (%) Projections by Components, 2023 to 2033
Figure 112: Eastern Europe Market Value (US$ Million) Analysis by Application, 2018 to 2033
Figure 113: Eastern Europe Market Value Share (%) and BPS Analysis by Application, 2023 to 2033
Figure 114: Eastern Europe Market Y-o-Y Growth (%) Projections by Application, 2023 to 2033
Figure 115: Eastern Europe Market Value (US$ Million) Analysis by Deployment Mode , 2018 to 2033
Figure 116: Eastern Europe Market Value Share (%) and BPS Analysis by Deployment Mode , 2023 to 2033
Figure 117: Eastern Europe Market Y-o-Y Growth (%) Projections by Deployment Mode , 2023 to 2033
Figure 118: Eastern Europe Market Value (US$ Million) Analysis by Organization Size, 2018 to 2033
Figure 119: Eastern Europe Market Value Share (%) and BPS Analysis by Organization Size, 2023 to 2033
Figure 120: Eastern Europe Market Y-o-Y Growth (%) Projections by Organization Size, 2023 to 2033
Figure 121: Eastern Europe Market Attractiveness by Components, 2023 to 2033
Figure 122: Eastern Europe Market Attractiveness by Application, 2023 to 2033
Figure 123: Eastern Europe Market Attractiveness by Deployment Mode , 2023 to 2033
Figure 124: Eastern Europe Market Attractiveness by Organization Size, 2023 to 2033
Figure 125: Eastern Europe Market Attractiveness by Country, 2023 to 2033
Figure 126: South Asia and Pacific Market Value (US$ Million) by Components, 2023 to 2033
Figure 127: South Asia and Pacific Market Value (US$ Million) by Application, 2023 to 2033
Figure 128: South Asia and Pacific Market Value (US$ Million) by Deployment Mode , 2023 to 2033
Figure 129: South Asia and Pacific Market Value (US$ Million) by Organization Size, 2023 to 2033
Figure 130: South Asia and Pacific Market Value (US$ Million) by Country, 2023 to 2033
Figure 131: South Asia and Pacific Market Value (US$ Million) Analysis by Country, 2018 to 2033
Figure 132: South Asia and Pacific Market Value Share (%) and BPS Analysis by Country, 2023 to 2033
Figure 133: South Asia and Pacific Market Y-o-Y Growth (%) Projections by Country, 2023 to 2033
Figure 134: South Asia and Pacific Market Value (US$ Million) Analysis by Components, 2018 to 2033
Figure 135: South Asia and Pacific Market Value Share (%) and BPS Analysis by Components, 2023 to 2033
Figure 136: South Asia and Pacific Market Y-o-Y Growth (%) Projections by Components, 2023 to 2033
Figure 137: South Asia and Pacific Market Value (US$ Million) Analysis by Application, 2018 to 2033
Figure 138: South Asia and Pacific Market Value Share (%) and BPS Analysis by Application, 2023 to 2033
Figure 139: South Asia and Pacific Market Y-o-Y Growth (%) Projections by Application, 2023 to 2033
Figure 140: South Asia and Pacific Market Value (US$ Million) Analysis by Deployment Mode , 2018 to 2033
Figure 141: South Asia and Pacific Market Value Share (%) and BPS Analysis by Deployment Mode , 2023 to 2033
Figure 142: South Asia and Pacific Market Y-o-Y Growth (%) Projections by Deployment Mode , 2023 to 2033
Figure 143: South Asia and Pacific Market Value (US$ Million) Analysis by Organization Size, 2018 to 2033
Figure 144: South Asia and Pacific Market Value Share (%) and BPS Analysis by Organization Size, 2023 to 2033
Figure 145: South Asia and Pacific Market Y-o-Y Growth (%) Projections by Organization Size, 2023 to 2033
Figure 146: South Asia and Pacific Market Attractiveness by Components, 2023 to 2033
Figure 147: South Asia and Pacific Market Attractiveness by Application, 2023 to 2033
Figure 148: South Asia and Pacific Market Attractiveness by Deployment Mode , 2023 to 2033
Figure 149: South Asia and Pacific Market Attractiveness by Organization Size, 2023 to 2033
Figure 150: South Asia and Pacific Market Attractiveness by Country, 2023 to 2033
Figure 151: East Asia Market Value (US$ Million) by Components, 2023 to 2033
Figure 152: East Asia Market Value (US$ Million) by Application, 2023 to 2033
Figure 153: East Asia Market Value (US$ Million) by Deployment Mode , 2023 to 2033
Figure 154: East Asia Market Value (US$ Million) by Organization Size, 2023 to 2033
Figure 155: East Asia Market Value (US$ Million) by Country, 2023 to 2033
Figure 156: East Asia Market Value (US$ Million) Analysis by Country, 2018 to 2033
Figure 157: East Asia Market Value Share (%) and BPS Analysis by Country, 2023 to 2033
Figure 158: East Asia Market Y-o-Y Growth (%) Projections by Country, 2023 to 2033
Figure 159: East Asia Market Value (US$ Million) Analysis by Components, 2018 to 2033
Figure 160: East Asia Market Value Share (%) and BPS Analysis by Components, 2023 to 2033
Figure 161: East Asia Market Y-o-Y Growth (%) Projections by Components, 2023 to 2033
Figure 162: East Asia Market Value (US$ Million) Analysis by Application, 2018 to 2033
Figure 163: East Asia Market Value Share (%) and BPS Analysis by Application, 2023 to 2033
Figure 164: East Asia Market Y-o-Y Growth (%) Projections by Application, 2023 to 2033
Figure 165: East Asia Market Value (US$ Million) Analysis by Deployment Mode , 2018 to 2033
Figure 166: East Asia Market Value Share (%) and BPS Analysis by Deployment Mode , 2023 to 2033
Figure 167: East Asia Market Y-o-Y Growth (%) Projections by Deployment Mode , 2023 to 2033
Figure 168: East Asia Market Value (US$ Million) Analysis by Organization Size, 2018 to 2033
Figure 169: East Asia Market Value Share (%) and BPS Analysis by Organization Size, 2023 to 2033
Figure 170: East Asia Market Y-o-Y Growth (%) Projections by Organization Size, 2023 to 2033
Figure 171: East Asia Market Attractiveness by Components, 2023 to 2033
Figure 172: East Asia Market Attractiveness by Application, 2023 to 2033
Figure 173: East Asia Market Attractiveness by Deployment Mode , 2023 to 2033
Figure 174: East Asia Market Attractiveness by Organization Size, 2023 to 2033
Figure 175: East Asia Market Attractiveness by Country, 2023 to 2033
Figure 176: Middle East and Africa Market Value (US$ Million) by Components, 2023 to 2033
Figure 177: Middle East and Africa Market Value (US$ Million) by Application, 2023 to 2033
Figure 178: Middle East and Africa Market Value (US$ Million) by Deployment Mode , 2023 to 2033
Figure 179: Middle East and Africa Market Value (US$ Million) by Organization Size, 2023 to 2033
Figure 180: Middle East and Africa Market Value (US$ Million) by Country, 2023 to 2033
Figure 181: Middle East and Africa Market Value (US$ Million) Analysis by Country, 2018 to 2033
Figure 182: Middle East and Africa Market Value Share (%) and BPS Analysis by Country, 2023 to 2033
Figure 183: Middle East and Africa Market Y-o-Y Growth (%) Projections by Country, 2023 to 2033
Figure 184: Middle East and Africa Market Value (US$ Million) Analysis by Components, 2018 to 2033
Figure 185: Middle East and Africa Market Value Share (%) and BPS Analysis by Components, 2023 to 2033
Figure 186: Middle East and Africa Market Y-o-Y Growth (%) Projections by Components, 2023 to 2033
Figure 187: Middle East and Africa Market Value (US$ Million) Analysis by Application, 2018 to 2033
Figure 188: Middle East and Africa Market Value Share (%) and BPS Analysis by Application, 2023 to 2033
Figure 189: Middle East and Africa Market Y-o-Y Growth (%) Projections by Application, 2023 to 2033
Figure 190: Middle East and Africa Market Value (US$ Million) Analysis by Deployment Mode , 2018 to 2033
Figure 191: Middle East and Africa Market Value Share (%) and BPS Analysis by Deployment Mode , 2023 to 2033
Figure 192: Middle East and Africa Market Y-o-Y Growth (%) Projections by Deployment Mode , 2023 to 2033
Figure 193: Middle East and Africa Market Value (US$ Million) Analysis by Organization Size, 2018 to 2033
Figure 194: Middle East and Africa Market Value Share (%) and BPS Analysis by Organization Size, 2023 to 2033
Figure 195: Middle East and Africa Market Y-o-Y Growth (%) Projections by Organization Size, 2023 to 2033
Figure 196: Middle East and Africa Market Attractiveness by Components, 2023 to 2033
Figure 197: Middle East and Africa Market Attractiveness by Application, 2023 to 2033
Figure 198: Middle East and Africa Market Attractiveness by Deployment Mode , 2023 to 2033
Figure 199: Middle East and Africa Market Attractiveness by Organization Size, 2023 to 2033
Figure 200: Middle East and Africa Market Attractiveness by Country, 2023 to 2033
The market is valued at USD 6.21 billion in 2023.
The market is expected to expand at a CAGR of 13.9% from 2023 to 2033.
The telecom analytics software segment is projected to record a CAGR of 13.5% through 2033.
North America, specifically the United States, holds a leading market share.
Increased adoption for customer churn prevention and enhanced customer service.
Explore Telecommunication Insights
Thank you!
You will receive an email from our Business Development Manager. Please be sure to check your SPAM/JUNK folder too.