Textured Milk Protein Market Forecast and Outlook 2025 to 2035

The textured milk protein market is estimated to be valued at USD 3.1 billion in 2025 and is projected to reach USD 4.6 billion by 2035, registering a compound annual growth rate (CAGR) of 4.1% over the forecast period.
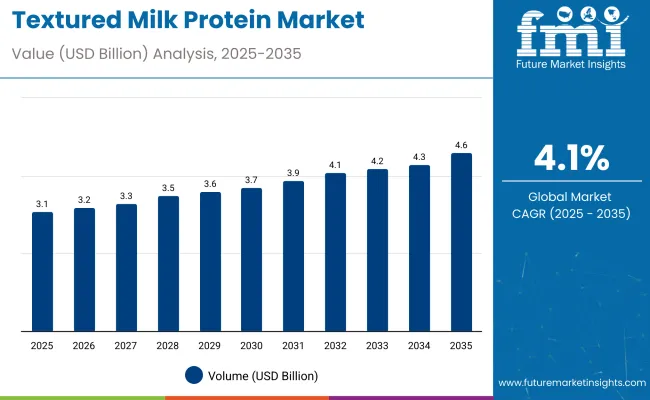
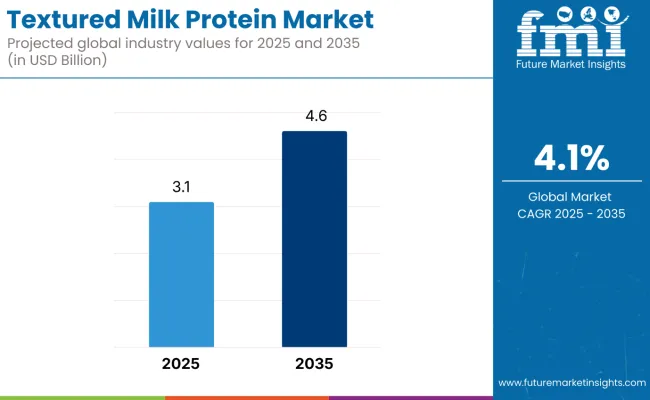
Textured Milk Protein Market

Quick Stats for Textured Milk Protein Market

  • Textured Milk Protein Market Value (2025): USD 3.1 billion
  • Textured Milk Protein Market Forecast Value (2035): USD 4.6 billion
  • Textured Milk Protein Market Forecast CAGR: 4.1%
  • Leading Segment in Textured Milk Protein Market in 2025: Powder (61%)
  • Key Growth Regions in Textured Milk Protein Market: North America and Asia Pacific
  • Key Players in Textured Milk Protein Market: Fonterra Co-Operative Group, Société FIT, Ingredia SA, Kerry Group plc, and Socius Ingredients

Textured Milk Protein Market 2

Metric Value
Estimated Value in 2025 (E) USD 3.1 billion
Forecast Value in 2035 (F) USD 4.6 billion
Forecast CAGR (2025 to 2035) 4.1%

The market is expected to add an absolute dollar opportunity of USD 1.5 billion during this period. This reflects a 1.48 times growth at a compound annual growth rate of 4.1%. The market evolution is expected to be shaped by increasing demand for high-quality protein ingredients in food and beverage formulations, rising health awareness, and expanding applications in dairy and meat analog products. The market demonstrates a consistent upward trend, supported by innovations in processing technologies and product texture enhancement that appeal to health-conscious consumers and clean-label preferences.

By 2030, the market is forecast to reach USD 3.9 billion, showing steady growth through the first half of the forecast period. Growth is anticipated to accelerate toward the latter half of the timeline owing to broader adoption in functional foods, nutritional supplements, and plant-based dairy alternatives.

Companies such as Fonterra Co-Operative Group, Société FIT, Ingredia SA, Kerry Group plc, and Socius Ingredients are strengthening their market presence by scaling production capacity and investing in advanced milk protein technologies. Their focus on clean-label solutions, textured protein variants, and value-added formulations positions them well for tapping niche and mainstream segments. Market performance will be strongly influenced by quality standards, responsible sourcing practices, and regulatory compliance, shaping competitive dynamics across key geographic regions including the USA, Japan, and South Korea.

The market holds a strong position across its parent industries, reflecting its rising adoption in dairy alternatives, sports nutrition, and functional food applications. Within the meat analog and alternative protein market, textured milk proteins account for 35%, driven by their functional role in enhancing texture and nutritional value. In the dairy ingredient market, textured milk proteins contribute about 30%, supported by rising demand for protein-enriched and clean-label products. In nutritional supplements, textured milk proteins represent nearly 25% of ingredient usage, owing to their high protein content and versatile formulation benefits. In the bakery and confectionery ingredients segment, they hold around 20%, enhancing texture, moisture retention, and overall product quality.

The market is being driven by advancements in processing technologies that enhance protein functionality and sensory attributes. Manufacturers are expanding applications into plant-based meat alternatives, functional snacks, and fortified dairy products, supported by innovations in clean-label and organic protein ingredients. Strategic partnerships with food manufacturers and retailers, alongside growing consumer preference for high-protein and healthier foods, are broadening distribution channels and fueling market expansion, positioning textured milk protein as a key player disrupting traditional protein sources.

Why is the Textured Milk Protein Market Growing?

The market is expanding due to increasing consumer demand for high-quality, functional protein ingredients in food and beverage products. Rising awareness of health and wellness, alongside growing preference for clean-label and protein-enriched foods, is fueling market growth. Advances in processing technologies have improved the texture, solubility, and nutritional profile of milk proteins, making them more versatile and appealing across diverse applications such as meat analogs, dairy alternatives, and nutritional supplements.

Furthermore, strategic collaborations between ingredient manufacturers, foodservice operators, and retail channels are broadening market reach and strengthening distribution networks. With continuous focus on product quality, responsible sourcing, and nutritional enhancement, the textured milk protein market is positioned for sustained growth across global regions.

Textured Milk Protein Market Analysis by Top Investment Segments

The market is segmented by form, type, end use, and region. By form, the market is bifurcated into powder and liquid. By type, the market is divided into whey protein concentrate and milk protein concentrate. Based on end use, the market is categorized into bars, smoothies & milkshakes, dairy, yogurt, cheese, cream, ice creams, functional food, sports nutrition, breakfast cereals, and bakery. Regionally, the market spans across North America, Latin America, Europe, East Asia, South Asia, Oceania, and the Middle East & Africa.
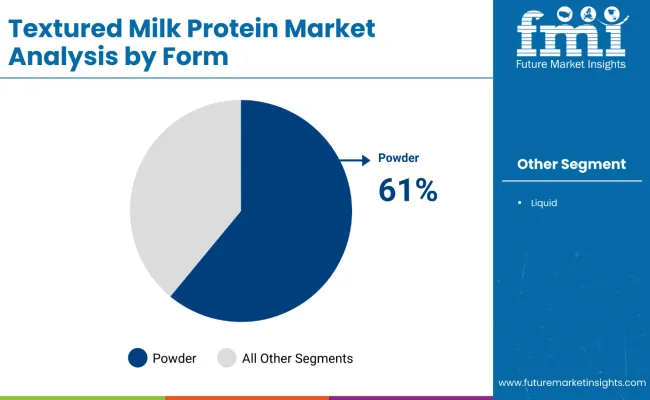
By Form, Powder Segment Accounts for 61% of the Market Share

Textured Milk Protein Market By Form

The powder segment dominates the textured milk protein market, accounting for 61% of the market share in 2025. This segment’s prominence is largely due to its versatility, longer shelf life, and ease of integration into various food and beverage products. Powdered textured milk protein is widely used in nutritional supplements, sports nutrition, bakery, dairy, and functional foods to enhance texture, protein content, and overall product quality.

The ability to customize the powder’s properties, such as solubility, texture, and flavor, makes it highly attractive to manufacturers aiming to meet evolving consumer demands for clean-label and high-protein products. Additionally, powdered proteins offer logistical advantages such as easier storage and transportation compared to liquid forms, contributing to cost-efficiency in production. While the liquid form is growing, especially in ready-to-drink formulations, the powder segment’s well-established presence and broad application base solidify its position as the most lucrative form in the textured milk protein market, driving steady growth globally from 2025 to 2035.
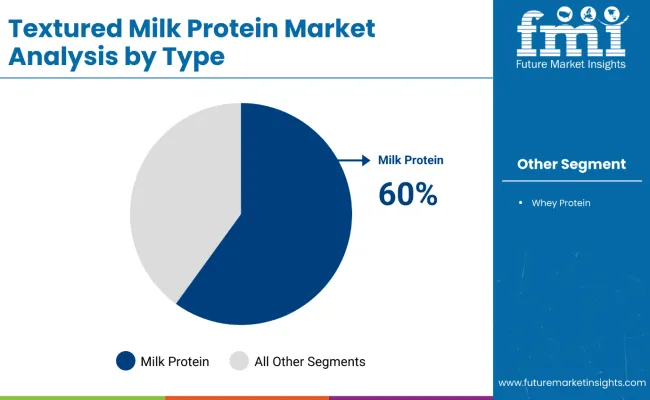
By Type, Milk Protein Concentrate Accounts for 60% of the Market Share

Textured Milk Protein Market By Type

The milk protein concentrate (MPC) segment holds a commanding 60% share of the textured milk protein market in 2025, making it the leading type within this sector. MPC is prized for its balanced composition of both casein and whey proteins, which imparts excellent functional properties such as improved texture, moisture retention, and gelation in food products. These characteristics make MPC highly suitable for diverse applications, including bakery, dairy, meat analogs, and nutritional supplements.

The ability of milk protein concentrate to enhance mouthfeel and stability, while providing a high protein content, drives its widespread use among manufacturers seeking to develop clean-label, high-protein foods. Additionally, MPC’s nutritional benefits and versatility in formulation contribute to its dominant market position. As consumer demand for protein-enriched and functional foods continues to rise globally, the milk protein concentrate segment is expected to sustain robust growth, supported by technological advancements and expanding applications across the food and beverage industry. This strong presence underscores MPC’s critical role in the textured milk protein market’s outlook.

What are the Drivers, Restraints, and Key Trends of the Textured Milk Protein Market?

From 2025 to 2035, the textured milk protein market is expected to witness significant growth driven by increasing consumer demand for high-quality, functional protein ingredients. Consumers are becoming more health-conscious and focusing on protein-enriched foods to support active lifestyles and wellness goals. This rising preference for clean-label, nutrient-rich, and protein-fortified products is encouraging manufacturers to invest heavily in advanced processing technologies. Companies are expanding their product portfolios to include innovative textured milk protein variants that cater to evolving dietary trends like plant-based diets, muscle recovery, and weight management, thus broadening market opportunities.

Growing Consumer Health Awareness Drives Market Growth

The growing emphasis on health and wellness among consumers is a primary factor propelling the textured milk protein market’s expansion. There is a substantial increase in demand for protein-fortified products across several categories, including sports nutrition, bakery, dairy alternatives, and functional foods. Consumers are seeking products that not only provide nutrition but also improve product quality through enhanced texture and taste. Manufacturers are responding by improving processing methods to optimize protein functionality, texture, and nutritional value, aiming to meet rising expectations for natural, clean-label, and effective protein sources within diverse food applications.

Innovation in Product Development Expands Market Opportunities

Innovation remains central to the textured milk protein market’s growth story as manufacturers focus on developing advanced protein formulations and processing techniques. These innovations include organic, specialty, and responsibly sourced protein variants that deliver better solubility, improved texture, and enhanced nutritional profiles. By leveraging these advances, companies are extending the market reach beyond traditional applications to emerging sectors such as meat analogs, functional foods, bakery, and nutritional supplements. Additionally, companies emphasizing responsible sourcing and obtaining quality certifications strengthen their market position by appealing to environmentally conscious and health-driven consumers, ensuring long-term growth and competitive advantage.
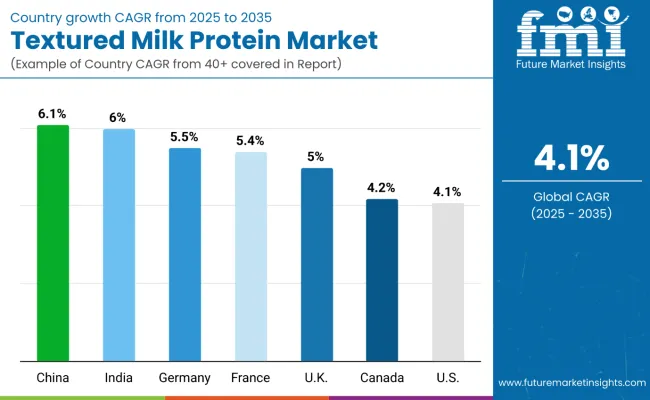
Textured Milk Protein Market Analysis by Key Countries

Textured Milk Protein Market By Country

Countries CAGR (%)
China 6.1
India 6.0
Germany 5.5
France 5.4
UK 5.0
Canada 4.2
USA 4.1

The market shows diverse growth rates across key countries. India leads with a 6% CAGR, driven by rising health awareness and urbanization. China closely follows at 6.1%, supported by increasing incomes and government initiatives. Germany and France exhibit stable growth of 5.5% and 5.4%, focusing on responsible sourcing and functional foods. The UK and Canada grow at 5% and 4.2%, benefiting from health-conscious consumers and retail expansion. The USA market, growing at 4.1%, is fueled by demand for clean-label, high-protein products and processing innovations.

The report covers an in-depth analysis of 40+ countries; seven top-performing OECD countries are highlighted below.

Dynamics of the China Textured Milk Protein Market

Sales of textured milk protein in China are expected to grow at a CAGR of 6.1% from 2025 to 2035, driven by rising disposable incomes and urbanization. Production capacity is expanding rapidly to meet growing consumer demand for dairy and functional foods enriched with high-quality protein. There is considerable investment in modern processing technologies and innovations tailored to local tastes.

Government initiatives to improve nutrition further stimulate market growth. E-commerce platforms and modern retail distribution channels provide broad access to textured milk protein products. Manufacturers are increasingly focusing on clean-label and organic options to satisfy health-conscious consumers. The convergence of technological advancements and consumer trends supports sustained output expansion and innovation in the textured milk protein industry in China.

  • Increasing disposable income and urbanization
  • Expansion of e-commerce and modern retail channels
  • Growing preference for clean-label products

Growth Outlook of the Textured Milk Protein Market in India

Revenue from textured milk protein in India is projected to grow at a CAGR of 6% from 2025 to 2035, driven by rising health awareness and rapid urbanization. The expanding middle class and increasing disposable income are shifting consumer preferences toward protein-rich diets and functional foods. Production capacity expansion is underway as local and multinational companies invest in modern processing facilities.

Growth in the dairy sector, coupled with innovations in textured milk protein applications, supports increased output. Affordability and accessibility remain key drivers, with companies tailoring products to suit regional tastes. The government’s initiatives promoting nutrition and food safety enhance industry confidence. The market is expected to benefit from rising demand in sports nutrition, bakery, and dairy alternatives, facilitating sustained capacity growth in the coming years.
  • Rising protein awareness in urban consumers
  • Growing demand for affordable nutritious products
  • Increasing presence of multinational players

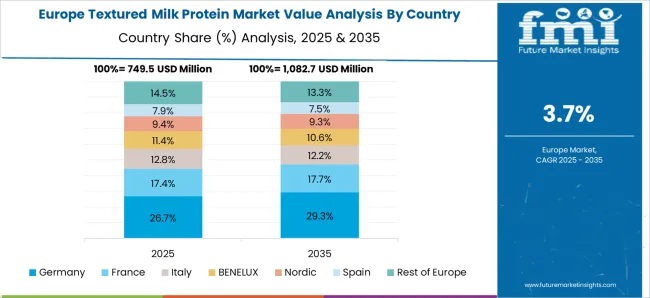
Germany Textured Milk Protein Market Outlook

Demand for textured milk protein in Germany is expected to grow at a CAGR of 5.5% from 2025 to 2035, driven by rising demand for functional and health-oriented foods. Manufacturers are adopting new production structures focusing on responsible sourcing and organic protein variants to align with consumer preferences. This shift includes upgrading processing lines to improve product texture, solubility, and nutritional efficacy. The market in Germany benefits from strong food safety regulations and emphasis on high-quality standards.

Demand for protein-enriched bakery, dairy, and sports nutrition products supports structural investment in manufacturing facilities. Companies are also forging collaborations for responsible sourcing, driving competitive advantage. The integration of advanced automation and quality control systems enhances production efficiency, positioning Germany as a key player in the European textured milk protein market.

  • Focus on organic and ethically sourced protein products
  • Upgrading production facilities for improved texture
  • Collaborative efforts for responsible sourcing

Clean-Label Demand of the Textured Milk Protein Market in France

Demand for textured milk protein in France is expected to grow at a CAGR of 5.4% from 2025 to 2035, driven by regulatory frameworks strongly influencing production and market growth. Manufacturers are adapting by enhancing product quality and ensuring compliance with stringent food safety standards. Investment in research and development supports product innovation, including organic and fortified protein ingredients.

Demand for high-protein dairy alternatives and functional foods is rising, encouraging expansion of production capacities. The growing preference among French consumers for natural and clean-label products drives market trends. Companies are incorporating responsible sourcing and traceability practices to maintain competitive advantage while meeting regulatory requirements.

  • Strict food safety and quality regulations
  • Expansion of functional food applications
  • Emphasis on responsible sourcing and traceability

Growth Opportunities in the Textured Milk Protein Market in the UK

The textured milk protein market in the UK is expected to expand at a CAGR of 5% from 2025 to 2035, supported by rising consumer interest in high-protein foods and supplements. Producers are expanding manufacturing capabilities to meet growing demand, with increased focus on innovative formulations and clean-label protein solutions. Retail expansion, including health-focused stores and e-commerce, enhances product accessibility.

The market benefits from strong partnerships between ingredient suppliers and food manufacturers to accelerate new product development. Emphasis on organic and responsibly sourced protein ingredients aligns with evolving consumer preferences. The integration of manufacturing advancements and retail distribution ensures effective market penetration and sustained growth in the UK

  • Expansion of manufacturing capacities
  • Rising consumer demand for protein-enriched foods
  • Growth of health-focused retail and e-commerce

Expansion of Textured Milk Protein Market in Canada

Revenue from textured milk protein in Canada is anticipated to grow at a CAGR of 4.2% from 2025 to 2035, driven by expanding health awareness and robust dairy and bakery industries. Market players are strategically increasing production capacities and adopting innovation-driven growth approaches. Technological advancements in protein extraction and formulation are central to enhancing product appeal. The demand for clean-label and fortified protein ingredients encourages investment in scalable manufacturing solutions.

Canadian companies emphasize responsible sourcing and traceability, meeting evolving consumer expectations. The expansion of retail and online distribution channels facilitates wider market penetration. Collaboration between ingredient suppliers and food manufacturers is fostering new product development, supporting the country’s role as a growing producer and consumer of textured milk protein.
  • Innovation in protein extraction and formulation
  • Emphasis on clean-label and fortified products
  • Collaboration within the food supply chain

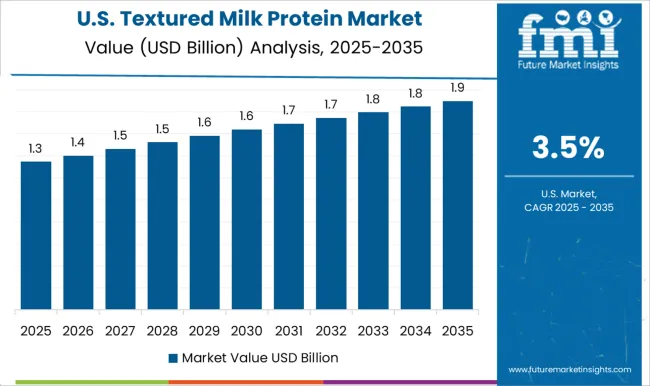
Production Capacity Trends in Textured Milk Protein Market in the USA

Demand for textured milk protein in the USA is expected to grow at a CAGR of 4.1%from 2025 to 2035, driven by strong consumer preference for high-protein and clean-label food products. Innovation in protein formulations and expanded applications in sports nutrition and functional foods propel this growth. Manufacturers are increasing production capacities to meet the surging demand, investing in advanced technologies for enhanced texture and nutritional quality.

The rising health-conscious population, combined with expanding e-commerce and retail channels, further supports market penetration. Additionally, partnerships between ingredient suppliers and food manufacturers are fostering new product development. The clean-label trend and emphasis on responsible sourcing are also key factors shaping production strategies. With continuous R&D and government support, the USA remains a leading hub for textured milk protein innovation and output expansion.
  • Increasing demand for protein-enriched foods
  • Growth in sports nutrition and supplements
  • Rapid innovation in formulation and processing

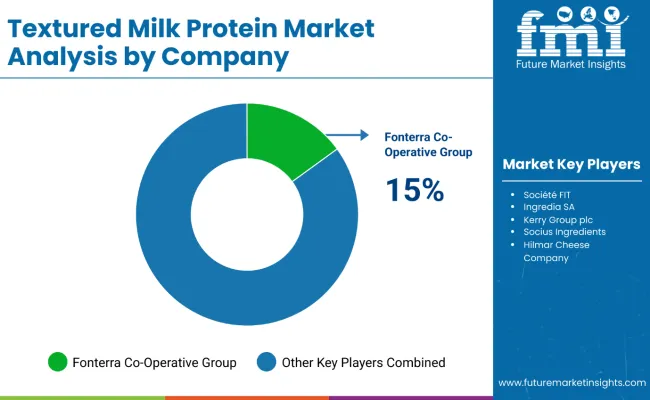
Competitive Landscape of Textured Milk Protein Market

Textured Milk Protein Market By Comapny

The market is moderately consolidated, with key players distinguishing themselves through advanced processing capabilities, product innovation, and strong regional market penetration. Leading companies such as Fonterra Co-Operative Group, Société FIT, Ingredia SA, Kerry Group plc, and Socius Ingredients maintain their competitive edge by leveraging large-scale production facilities and diverse product portfolios focused on clean-label, high-protein textured milk ingredients for various food applications. Their strengths include technological expertise in protein texturization, quality assurance, and robust distribution networks.

Companies like these emphasize cost-efficient production methods and supply chain optimization to meet the increasing global demand for functional, organic, and responsibly sourced protein ingredients. Regional players prioritize local sourcing, authentic ingredient quality, and tailored product formulations to serve niche markets, especially in North America, Europe, and Asia-Pacific.

Barriers to entry remain moderate due to the need for sophisticated processing technology, strict compliance with food safety and nutritional standards, and the challenge to innovate continuously. Market competitiveness is driven by advancements in processing, responsible sourcing commitments, and responsiveness to evolving consumer preferences and regulatory landscapes.

Report Scope - Textured Milk Protein Market

Items Values
Quantitative Units (2025) USD 3.1 billion
Form Powder and Liquid
Type Whey Protein Concentrate and Milk Protein Concentrate
End Use Bars, Smoothies & Milkshakes, Dairy, Yogurt, Cheese, Cream, Ice Creams, Functional Food, Sports Nutrition, and Breakfast Cereals, Bakery
Regions Covered North America, Latin America, Europe, East Asia, South Asia, Oceania, and Middle East & Africa
Countries Covered United States, Canada, United Kingdom, Germany, France, China, Japan, South Korea, Brazil, Australia and 40+ countries
Key Companies Profiled Fonterra Co-Operative Group, Société FIT, Ingredia SA, Kerry Group plc, Socius Ingredients, and Hilmar Cheese Company.
Additional Attributes Dollar sales by form, type, and end use; rising demand for clean-label and high-protein products; expansion in sports nutrition and functional food sectors; innovations in protein texturization and formulation; focus on responsible sourcing and nutritional quality

Key Segments

By Form:

  • Powder
  • Liquid

By Type:

  • Whey Protein Concentrate
  • Milk Protein Concentrate

By End Use:

  • Bars
  • Smoothies & Milkshakes
  • Dairy
  • Yogurt
  • Cheese
  • Cream
  • Ice Creams
  • Functional Food
  • Sports Nutrition
  • Breakfast Cereals
  • Bakery

By Region:

  • North America
  • Latin America
  • Europe
  • East Asia
  • South Asia
  • Oceania
  • Middle East & Africa

Table of Content

  1. Executive Summary
    • Global Market Outlook
    • Demand-side Trends
    • Supply-side Trends
    • Technology Roadmap Analysis
    • Analysis and Recommendations
  2. Market Overview
    • Market Coverage / Taxonomy
    • Market Definition / Scope / Limitations
  3. Market Background
    • Market Dynamics
      • Drivers
      • Restraints
      • Opportunity
      • Trends
    • Scenario Forecast
      • Demand in Optimistic Scenario
      • Demand in Likely Scenario
      • Demand in Conservative Scenario
    • Opportunity Map Analysis
    • Product Life Cycle Analysis
    • Supply Chain Analysis
      • Supply Side Participants and their Roles
        • Producers
        • Mid-Level Participants (Traders/ Agents/ Brokers)
        • Wholesalers and Distributors
      • Value Added and Value Created at Node in the Supply Chain
      • List of Raw Material Suppliers
      • List of Existing and Potential Buyer’s
    • Investment Feasibility Matrix
    • Value Chain Analysis
      • Profit Margin Analysis
      • Wholesalers and Distributors
      • Retailers
    • PESTLE and Porter’s Analysis
    • Regulatory Landscape
      • By Key Regions
      • By Key Countries
    • Regional Parent Market Outlook
    • Production and Consumption Statistics
    • Import and Export Statistics
  4. Global Market Analysis 2020 to 2024 and Forecast, 2025 to 2035
    • Historical Market Size Value (USD Billion) & Volume (Metric Tons) Analysis, 2020 to 2024
    • Current and Future Market Size Value (USD Billion) & Volume (Metric Tons) Projections, 2025 to 2035
      • Y-o-Y Growth Trend Analysis
      • Absolute $ Opportunity Analysis
  5. Global Market Pricing Analysis 2020 to 2024 and Forecast 2025 to 2035
  6. Global Market Analysis 2020 to 2024 and Forecast 2025 to 2035, By Form
    • Introduction / Key Findings
    • Historical Market Size Value (USD Billion) & Volume (Metric Tons) Analysis By Form, 2020 to 2024
    • Current and Future Market Size Value (USD Billion) & Volume (Metric Tons) Analysis and Forecast By Form, 2025 to 2035
      • Powder
      • Liquid
    • Y-o-Y Growth Trend Analysis By Form, 2020 to 2024
    • Absolute $ Opportunity Analysis By Form, 2025 to 2035
  7. Global Market Analysis 2020 to 2024 and Forecast 2025 to 2035, By Type
    • Introduction / Key Findings
    • Historical Market Size Value (USD Billion) & Volume (Metric Tons) Analysis By Type, 2020 to 2024
    • Current and Future Market Size Value (USD Billion) & Volume (Metric Tons) Analysis and Forecast By Type, 2025 to 2035
      • Whey Protein Concentrate
      • Milk Protein Concentrate
    • Y-o-Y Growth Trend Analysis By Type, 2020 to 2024
    • Absolute $ Opportunity Analysis By Type, 2025 to 2035
  8. Global Market Analysis 2020 to 2024 and Forecast 2025 to 2035, By End Use
    • Introduction / Key Findings
    • Historical Market Size Value (USD Billion) & Volume (Metric Tons) Analysis By End Use, 2020 to 2024
    • Current and Future Market Size Value (USD Billion) & Volume (Metric Tons) Analysis and Forecast By End Use, 2025 to 2035
      • Bars
      • Smoothies & Milkshakes
      • Dairy
      • Yogurt
      • Cheese
      • Cream
      • Ice Creams
      • Functional Food
      • Sports Nutrition
      • Breakfast Cereals
      • Bakery
    • Y-o-Y Growth Trend Analysis By End Use, 2020 to 2024
    • Absolute $ Opportunity Analysis By End Use, 2025 to 2035
  9. Global Market Analysis 2020 to 2024 and Forecast 2025 to 2035, By Region
    • Introduction
    • Historical Market Size Value (USD Billion) & Volume (Metric Tons) Analysis By Region, 2020 to 2024
    • Current Market Size Value (USD Billion) & Volume (Metric Tons) Analysis and Forecast By Region, 2025 to 2035
      • North America
      • Latin America
      • Western Europe
      • Eastern Europe
      • East Asia
      • South Asia & Pacific
      • Middle East and Africa
    • Market Attractiveness Analysis By Region
  10. North America Market Analysis 2020 to 2024 and Forecast 2025 to 2035, By Country
    • Historical Market Size Value (USD Billion) & Volume (Metric Tons) Trend Analysis By Market Taxonomy, 2020 to 2024
    • Market Size Value (USD Billion) & Volume (Metric Tons) Forecast By Market Taxonomy, 2025 to 2035
      • By Country
        • USA
        • Canada
        • Mexico
      • By Form
      • By Type
      • By End Use
    • Market Attractiveness Analysis
      • By Country
      • By Form
      • By Type
      • By End Use
    • Key Takeaways
  11. Latin America Market Analysis 2020 to 2024 and Forecast 2025 to 2035, By Country
    • Historical Market Size Value (USD Billion) & Volume (Metric Tons) Trend Analysis By Market Taxonomy, 2020 to 2024
    • Market Size Value (USD Billion) & Volume (Metric Tons) Forecast By Market Taxonomy, 2025 to 2035
      • By Country
        • Brazil
        • Argentina
        • Rest of LATAM
      • By Form
      • By Type
      • By End Use
    • Market Attractiveness Analysis
      • By Country
      • By Form
      • By Type
      • By End Use
    • Key Takeaways
  12. Western Europe Market Analysis 2020 to 2024 and Forecast 2025 to 2035, By Country
    • Historical Market Size Value (USD Billion) & Volume (Metric Tons) Trend Analysis By Market Taxonomy, 2020 to 2024
    • Market Size Value (USD Billion) & Volume (Metric Tons) Forecast By Market Taxonomy, 2025 to 2035
      • By Country
        • Germany
        • Italy
        • France
        • UK
        • Spain
        • BENELUX
        • Nordic
        • Rest of W.Europe
      • By Form
      • By Type
      • By End Use
    • Market Attractiveness Analysis
      • By Country
      • By Form
      • By Type
      • By End Use
    • Key Takeaways
  13. Eastern Europe Market Analysis 2020 to 2024 and Forecast 2025 to 2035, By Country
    • Historical Market Size Value (USD Billion) & Volume (Metric Tons) Trend Analysis By Market Taxonomy, 2020 to 2024
    • Market Size Value (USD Billion) & Volume (Metric Tons) Forecast By Market Taxonomy, 2025 to 2035
      • By Country
        • Russia
        • Hungary
        • Poland
        • Balkan & Baltics
        • Rest of E. Europe
      • By Form
      • By Type
      • By End Use
    • Market Attractiveness Analysis
      • By Country
      • By Form
      • By Type
      • By End Use
    • Key Takeaways
  14. East Asia Market Analysis 2020 to 2024 and Forecast 2025 to 2035, By Country
    • Historical Market Size Value (USD Billion) & Volume (Metric Tons) Trend Analysis By Market Taxonomy, 2020 to 2024
    • Market Size Value (USD Billion) & Volume (Metric Tons) Forecast By Market Taxonomy, 2025 to 2035
      • By Country
        • China
        • Japan
        • South Korea
      • By Form
      • By Type
      • By End Use
    • Market Attractiveness Analysis
      • By Country
      • By Form
      • By Type
      • By End Use
    • Key Takeaways
  15. South Asia & Pacific Market Analysis 2020 to 2024 and Forecast 2025 to 2035, By Country
    • Historical Market Size Value (USD Billion) & Volume (Metric Tons) Trend Analysis By Market Taxonomy, 2020 to 2024
    • Market Size Value (USD Billion) & Volume (Metric Tons) Forecast By Market Taxonomy, 2025 to 2035
      • By Country
        • India
        • Australia & New Zealand
        • ASEAN
        • Rest of SAP
      • By Form
      • By Type
      • By End Use
    • Market Attractiveness Analysis
      • By Country
      • By Form
      • By Type
      • By End Use
    • Key Takeaways
  16. Middle East and Africa Market Analysis 2020 to 2024 and Forecast 2025 to 2035, By Country
    • Historical Market Size Value (USD Billion) & Volume (Metric Tons) Trend Analysis By Market Taxonomy, 2020 to 2024
    • Market Size Value (USD Billion) & Volume (Metric Tons) Forecast By Market Taxonomy, 2025 to 2035
      • By Country
        • GCC Countries
        • Northern Africa
        • South Africa
        • Turkiye
        • Rest of MEA
      • By Form
      • By Type
      • By End Use
    • Market Attractiveness Analysis
      • By Country
      • By Form
      • By Type
      • By End Use
    • Key Takeaways
  17. Key Countries Market Analysis
    • USA
      • Pricing Analysis
      • Market Share Analysis, 2024
        • By Form
        • By Type
        • By End Use
    • Canada
      • Pricing Analysis
      • Market Share Analysis, 2024
        • By Form
        • By Type
        • By End Use
    • Brazil
      • Pricing Analysis
      • Market Share Analysis, 2024
        • By Form
        • By Type
        • By End Use
    • Mexico
      • Pricing Analysis
      • Market Share Analysis, 2024
        • By Form
        • By Type
        • By End Use
    • Argentina
      • Pricing Analysis
      • Market Share Analysis, 2024
        • By Form
        • By Type
        • By End Use
  18. Market Structure Analysis
    • Competition Dashboard
    • Competition Benchmarking
    • Market Share Analysis of Top Players
      • By Regional
      • By Form
      • By Type
      • By End Use
  19. Competition Analysis
    • Competition Deep Dive
      • Fonterra Co-Operative Group
        • Overview
        • Product Portfolio
        • Profitability by Market Segments (Product/Age /Sales Channel/Region)
        • Sales Footprint
        • Strategy Overview
          • Marketing Strategy
          • Product Strategy
          • Channel Strategy
      • Société FIT
        • Overview
        • Product Portfolio
        • Profitability by Market Segments (Product/Age /Sales Channel/Region)
        • Sales Footprint
        • Strategy Overview
          • Marketing Strategy
          • Product Strategy
          • Channel Strategy
      • Ingredia SA
        • Overview
        • Product Portfolio
        • Profitability by Market Segments (Product/Age /Sales Channel/Region)
        • Sales Footprint
        • Strategy Overview
          • Marketing Strategy
          • Product Strategy
          • Channel Strategy
      • Kerry Group plc
        • Overview
        • Product Portfolio
        • Profitability by Market Segments (Product/Age /Sales Channel/Region)
        • Sales Footprint
        • Strategy Overview
          • Marketing Strategy
          • Product Strategy
          • Channel Strategy
      • Socius Ingredients
        • Overview
        • Product Portfolio
        • Profitability by Market Segments (Product/Age /Sales Channel/Region)
        • Sales Footprint
        • Strategy Overview
          • Marketing Strategy
          • Product Strategy
          • Channel Strategy
      • Hilmar Cheese Company
        • Overview
        • Product Portfolio
        • Profitability by Market Segments (Product/Age /Sales Channel/Region)
        • Sales Footprint
        • Strategy Overview
          • Marketing Strategy
          • Product Strategy
          • Channel Strategy
  20. Assumptions & Acronyms Used
  21. Research Methodology

List of Tables

  • Table 1: Global Market Value (USD Billion) Forecast by Region, 2020-2035
  • Table 2: Global Market Volume (Metric Tons) Forecast by Region, 2020-2035
  • Table 3: Global Market Value (USD Billion) Forecast by Form, 2020-2035
  • Table 4: Global Market Volume (Metric Tons) Forecast by Form, 2020-2035
  • Table 5: Global Market Value (USD Billion) Forecast by Type, 2020-2035
  • Table 6: Global Market Volume (Metric Tons) Forecast by Type, 2020-2035
  • Table 7: Global Market Value (USD Billion) Forecast by End Use, 2020-2035
  • Table 8: Global Market Volume (Metric Tons) Forecast by End Use, 2020-2035
  • Table 9: North America Market Value (USD Billion) Forecast by Country, 2020-2035
  • Table 10: North America Market Volume (Metric Tons) Forecast by Country, 2020-2035
  • Table 11: North America Market Value (USD Billion) Forecast by Form, 2020-2035
  • Table 12: North America Market Volume (Metric Tons) Forecast by Form, 2020-2035
  • Table 13: North America Market Value (USD Billion) Forecast by Type, 2020-2035
  • Table 14: North America Market Volume (Metric Tons) Forecast by Type, 2020-2035
  • Table 15: North America Market Value (USD Billion) Forecast by End Use, 2020-2035
  • Table 16: North America Market Volume (Metric Tons) Forecast by End Use, 2020-2035
  • Table 17: Latin America Market Value (USD Billion) Forecast by Country, 2020-2035
  • Table 18: Latin America Market Volume (Metric Tons) Forecast by Country, 2020-2035
  • Table 19: Latin America Market Value (USD Billion) Forecast by Form, 2020-2035
  • Table 20: Latin America Market Volume (Metric Tons) Forecast by Form, 2020-2035
  • Table 21: Latin America Market Value (USD Billion) Forecast by Type, 2020-2035
  • Table 22: Latin America Market Volume (Metric Tons) Forecast by Type, 2020-2035
  • Table 23: Latin America Market Value (USD Billion) Forecast by End Use, 2020-2035
  • Table 24: Latin America Market Volume (Metric Tons) Forecast by End Use, 2020-2035
  • Table 25: Western Europe Market Value (USD Billion) Forecast by Country, 2020-2035
  • Table 26: Western Europe Market Volume (Metric Tons) Forecast by Country, 2020-2035
  • Table 27: Western Europe Market Value (USD Billion) Forecast by Form, 2020-2035
  • Table 28: Western Europe Market Volume (Metric Tons) Forecast by Form, 2020-2035
  • Table 29: Western Europe Market Value (USD Billion) Forecast by Type, 2020-2035
  • Table 30: Western Europe Market Volume (Metric Tons) Forecast by Type, 2020-2035
  • Table 31: Western Europe Market Value (USD Billion) Forecast by End Use, 2020-2035
  • Table 32: Western Europe Market Volume (Metric Tons) Forecast by End Use, 2020-2035
  • Table 33: Eastern Europe Market Value (USD Billion) Forecast by Country, 2020-2035
  • Table 34: Eastern Europe Market Volume (Metric Tons) Forecast by Country, 2020-2035
  • Table 35: Eastern Europe Market Value (USD Billion) Forecast by Form, 2020-2035
  • Table 36: Eastern Europe Market Volume (Metric Tons) Forecast by Form, 2020-2035
  • Table 37: Eastern Europe Market Value (USD Billion) Forecast by Type, 2020-2035
  • Table 38: Eastern Europe Market Volume (Metric Tons) Forecast by Type, 2020-2035
  • Table 39: Eastern Europe Market Value (USD Billion) Forecast by End Use, 2020-2035
  • Table 40: Eastern Europe Market Volume (Metric Tons) Forecast by End Use, 2020-2035
  • Table 41: East Asia Market Value (USD Billion) Forecast by Country, 2020-2035
  • Table 42: East Asia Market Volume (Metric Tons) Forecast by Country, 2020-2035
  • Table 43: East Asia Market Value (USD Billion) Forecast by Form, 2020-2035
  • Table 44: East Asia Market Volume (Metric Tons) Forecast by Form, 2020-2035
  • Table 45: East Asia Market Value (USD Billion) Forecast by Type, 2020-2035
  • Table 46: East Asia Market Volume (Metric Tons) Forecast by Type, 2020-2035
  • Table 47: East Asia Market Value (USD Billion) Forecast by End Use, 2020-2035
  • Table 48: East Asia Market Volume (Metric Tons) Forecast by End Use, 2020-2035
  • Table 49: South Asia & Pacific Market Value (USD Billion) Forecast by Country, 2020-2035
  • Table 50: South Asia & Pacific Market Volume (Metric Tons) Forecast by Country, 2020-2035
  • Table 51: South Asia & Pacific Market Value (USD Billion) Forecast by Form, 2020-2035
  • Table 52: South Asia & Pacific Market Volume (Metric Tons) Forecast by Form, 2020-2035
  • Table 53: South Asia & Pacific Market Value (USD Billion) Forecast by Type, 2020-2035
  • Table 54: South Asia & Pacific Market Volume (Metric Tons) Forecast by Type, 2020-2035
  • Table 55: South Asia & Pacific Market Value (USD Billion) Forecast by End Use, 2020-2035
  • Table 56: South Asia & Pacific Market Volume (Metric Tons) Forecast by End Use, 2020-2035
  • Table 57: Middle East and Africa Market Value (USD Billion) Forecast by Country, 2020-2035
  • Table 58: Middle East and Africa Market Volume (Metric Tons) Forecast by Country, 2020-2035
  • Table 59: Middle East and Africa Market Value (USD Billion) Forecast by Form, 2020-2035
  • Table 60: Middle East and Africa Market Volume (Metric Tons) Forecast by Form, 2020-2035
  • Table 61: Middle East and Africa Market Value (USD Billion) Forecast by Type, 2020-2035
  • Table 62: Middle East and Africa Market Volume (Metric Tons) Forecast by Type, 2020-2035
  • Table 63: Middle East and Africa Market Value (USD Billion) Forecast by End Use, 2020-2035
  • Table 64: Middle East and Africa Market Volume (Metric Tons) Forecast by End Use, 2020-2035

List of Figures

  • Figure 1: Global Market Volume (Metric Tons) Forecast 2020-2035
  • Figure 2: Global Market Pricing Analysis
  • Figure 3: Global Market Value (USD Billion) Forecast 2020-2035
  • Figure 4: Global Market Value Share and BPS Analysis by Form, 2025 and 2035
  • Figure 5: Global Market Y-o-Y Growth Comparison by Form, 2025-2035
  • Figure 6: Global Market Attractiveness Analysis by Form
  • Figure 7: Global Market Value Share and BPS Analysis by Type, 2025 and 2035
  • Figure 8: Global Market Y-o-Y Growth Comparison by Type, 2025-2035
  • Figure 9: Global Market Attractiveness Analysis by Type
  • Figure 10: Global Market Value Share and BPS Analysis by End Use, 2025 and 2035
  • Figure 11: Global Market Y-o-Y Growth Comparison by End Use, 2025-2035
  • Figure 12: Global Market Attractiveness Analysis by End Use
  • Figure 13: Global Market Value (USD Billion) Share and BPS Analysis by Region, 2025 and 2035
  • Figure 14: Global Market Y-o-Y Growth Comparison by Region, 2025-2035
  • Figure 15: Global Market Attractiveness Analysis by Region
  • Figure 16: North America Market Incremental $ Opportunity, 2025-2035
  • Figure 17: Latin America Market Incremental $ Opportunity, 2025-2035
  • Figure 18: Western Europe Market Incremental $ Opportunity, 2025-2035
  • Figure 19: Eastern Europe Market Incremental $ Opportunity, 2025-2035
  • Figure 20: East Asia Market Incremental $ Opportunity, 2025-2035
  • Figure 21: South Asia & Pacific Market Incremental $ Opportunity, 2025-2035
  • Figure 22: Middle East and Africa Market Incremental $ Opportunity, 2025-2035
  • Figure 23: North America Market Value Share and BPS Analysis by Country, 2025 and 2035
  • Figure 24: North America Market Value Share and BPS Analysis by Form, 2025 and 2035
  • Figure 25: North America Market Y-o-Y Growth Comparison by Form, 2025-2035
  • Figure 26: North America Market Attractiveness Analysis by Form
  • Figure 27: North America Market Value Share and BPS Analysis by Type, 2025 and 2035
  • Figure 28: North America Market Y-o-Y Growth Comparison by Type, 2025-2035
  • Figure 29: North America Market Attractiveness Analysis by Type
  • Figure 30: North America Market Value Share and BPS Analysis by End Use, 2025 and 2035
  • Figure 31: North America Market Y-o-Y Growth Comparison by End Use, 2025-2035
  • Figure 32: North America Market Attractiveness Analysis by End Use
  • Figure 33: Latin America Market Value Share and BPS Analysis by Country, 2025 and 2035
  • Figure 34: Latin America Market Value Share and BPS Analysis by Form, 2025 and 2035
  • Figure 35: Latin America Market Y-o-Y Growth Comparison by Form, 2025-2035
  • Figure 36: Latin America Market Attractiveness Analysis by Form
  • Figure 37: Latin America Market Value Share and BPS Analysis by Type, 2025 and 2035
  • Figure 38: Latin America Market Y-o-Y Growth Comparison by Type, 2025-2035
  • Figure 39: Latin America Market Attractiveness Analysis by Type
  • Figure 40: Latin America Market Value Share and BPS Analysis by End Use, 2025 and 2035
  • Figure 41: Latin America Market Y-o-Y Growth Comparison by End Use, 2025-2035
  • Figure 42: Latin America Market Attractiveness Analysis by End Use
  • Figure 43: Western Europe Market Value Share and BPS Analysis by Country, 2025 and 2035
  • Figure 44: Western Europe Market Value Share and BPS Analysis by Form, 2025 and 2035
  • Figure 45: Western Europe Market Y-o-Y Growth Comparison by Form, 2025-2035
  • Figure 46: Western Europe Market Attractiveness Analysis by Form
  • Figure 47: Western Europe Market Value Share and BPS Analysis by Type, 2025 and 2035
  • Figure 48: Western Europe Market Y-o-Y Growth Comparison by Type, 2025-2035
  • Figure 49: Western Europe Market Attractiveness Analysis by Type
  • Figure 50: Western Europe Market Value Share and BPS Analysis by End Use, 2025 and 2035
  • Figure 51: Western Europe Market Y-o-Y Growth Comparison by End Use, 2025-2035
  • Figure 52: Western Europe Market Attractiveness Analysis by End Use
  • Figure 53: Eastern Europe Market Value Share and BPS Analysis by Country, 2025 and 2035
  • Figure 54: Eastern Europe Market Value Share and BPS Analysis by Form, 2025 and 2035
  • Figure 55: Eastern Europe Market Y-o-Y Growth Comparison by Form, 2025-2035
  • Figure 56: Eastern Europe Market Attractiveness Analysis by Form
  • Figure 57: Eastern Europe Market Value Share and BPS Analysis by Type, 2025 and 2035
  • Figure 58: Eastern Europe Market Y-o-Y Growth Comparison by Type, 2025-2035
  • Figure 59: Eastern Europe Market Attractiveness Analysis by Type
  • Figure 60: Eastern Europe Market Value Share and BPS Analysis by End Use, 2025 and 2035
  • Figure 61: Eastern Europe Market Y-o-Y Growth Comparison by End Use, 2025-2035
  • Figure 62: Eastern Europe Market Attractiveness Analysis by End Use
  • Figure 63: East Asia Market Value Share and BPS Analysis by Country, 2025 and 2035
  • Figure 64: East Asia Market Value Share and BPS Analysis by Form, 2025 and 2035
  • Figure 65: East Asia Market Y-o-Y Growth Comparison by Form, 2025-2035
  • Figure 66: East Asia Market Attractiveness Analysis by Form
  • Figure 67: East Asia Market Value Share and BPS Analysis by Type, 2025 and 2035
  • Figure 68: East Asia Market Y-o-Y Growth Comparison by Type, 2025-2035
  • Figure 69: East Asia Market Attractiveness Analysis by Type
  • Figure 70: East Asia Market Value Share and BPS Analysis by End Use, 2025 and 2035
  • Figure 71: East Asia Market Y-o-Y Growth Comparison by End Use, 2025-2035
  • Figure 72: East Asia Market Attractiveness Analysis by End Use
  • Figure 73: South Asia & Pacific Market Value Share and BPS Analysis by Country, 2025 and 2035
  • Figure 74: South Asia & Pacific Market Value Share and BPS Analysis by Form, 2025 and 2035
  • Figure 75: South Asia & Pacific Market Y-o-Y Growth Comparison by Form, 2025-2035
  • Figure 76: South Asia & Pacific Market Attractiveness Analysis by Form
  • Figure 77: South Asia & Pacific Market Value Share and BPS Analysis by Type, 2025 and 2035
  • Figure 78: South Asia & Pacific Market Y-o-Y Growth Comparison by Type, 2025-2035
  • Figure 79: South Asia & Pacific Market Attractiveness Analysis by Type
  • Figure 80: South Asia & Pacific Market Value Share and BPS Analysis by End Use, 2025 and 2035
  • Figure 81: South Asia & Pacific Market Y-o-Y Growth Comparison by End Use, 2025-2035
  • Figure 82: South Asia & Pacific Market Attractiveness Analysis by End Use
  • Figure 83: Middle East and Africa Market Value Share and BPS Analysis by Country, 2025 and 2035
  • Figure 84: Middle East and Africa Market Value Share and BPS Analysis by Form, 2025 and 2035
  • Figure 85: Middle East and Africa Market Y-o-Y Growth Comparison by Form, 2025-2035
  • Figure 86: Middle East and Africa Market Attractiveness Analysis by Form
  • Figure 87: Middle East and Africa Market Value Share and BPS Analysis by Type, 2025 and 2035
  • Figure 88: Middle East and Africa Market Y-o-Y Growth Comparison by Type, 2025-2035
  • Figure 89: Middle East and Africa Market Attractiveness Analysis by Type
  • Figure 90: Middle East and Africa Market Value Share and BPS Analysis by End Use, 2025 and 2035
  • Figure 91: Middle East and Africa Market Y-o-Y Growth Comparison by End Use, 2025-2035
  • Figure 92: Middle East and Africa Market Attractiveness Analysis by End Use
  • Figure 93: Global Market - Tier Structure Analysis
  • Figure 94: Global Market - Company Share Analysis

Frequently Asked Questions

How big is the textured milk protein market in 2025?

The global textured milk protein market is estimated to be valued at USD 3.1 billion in 2025.

What will be the size of the textured milk protein market in 2035?

The market size for the textured milk protein is projected to reach USD 4.6 billion by 2035.

How much will be the textured milk protein market growth between 2025 and 2035?

The textured milk protein market is expected to grow at a 4.1% CAGR between 2025 and 2035.

Which form segment is projected to lead in the textured milk protein market in 2025?

The powder segment is projected to lead in the textured milk protein market with 61% market share in 2025.

Which type segment will contribute a significant share in the textured milk protein market in 2025?

In terms of type, milk protein concentrate is expected to command 60% share in the textured milk protein market in 2025.

Explore Similar Insights

Future Market Insights

Textured Milk Protein Market