Thermoform Packaging Market
Learn More about the Thermoform Packaging Industry's Key Players and the Factors that Influence Sales with FMI.
Thermoform Packaging Market By Material, Product, Heat Seal Coating, End User & Regional Forecast Forecast 2023–2033
Thermoform Packaging Market Outlook
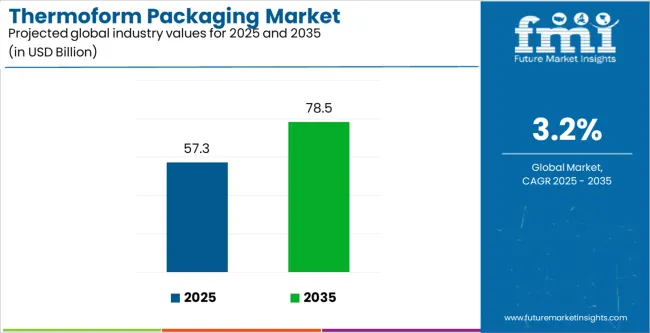
According to Future Market Insights, the thermoform packaging market size is anticipated to rise at a CAGR of 5.3% during the forecast period. The market is likely to be worth US$ 84.450 Mn by 2033, up from US$ 50.390 Mn in 2023. Some of the major factors propelling the sales of thermoform packaging are:
- In comparison to other molding processes like injection and rotational molding, the thermoform method has advantages like low production costs for smaller production volumes, rapid product development, prototyping, and lower tooling costs.
- According to research, Thermoform packaging can be up to 15% less expensive than packaging created from plastic injection molding. Such occurrences show that the industry is anticipated to have significant adoption during the projected period.
- Food product packaging demands the packaging solution to have strong oxygen/moisture barriers, physical stress, temperature, contamination protection, and tamper resistance, all while combining the unique, functional design.
- Due to its strength, resilience, and tamper-resistance, thermoform packaging not only protects the items but also increases their shelf life or facilitates simple access. The adoption of thermoform packaging by industry participants is growing.
Let us know your requirement to get
100% FREE customization
Companies to Shift Focus to Eco-friendly Thermoform Packaging
The market participants are anticipated to be driven to create new products to keep up with the growing demand as a result of the rising trend toward the creation of sustainable packaging. About 52% of customers, according to the study, base their buying decisions on how environmentally friendly the packaging is. Food sector companies are exploring more and more packaging options that allow them to minimize their carbon footprint. Over the projected period, demand is anticipated to increase as 100% recyclable materials are increasingly used in the manufacturing of Thermoform packaging.
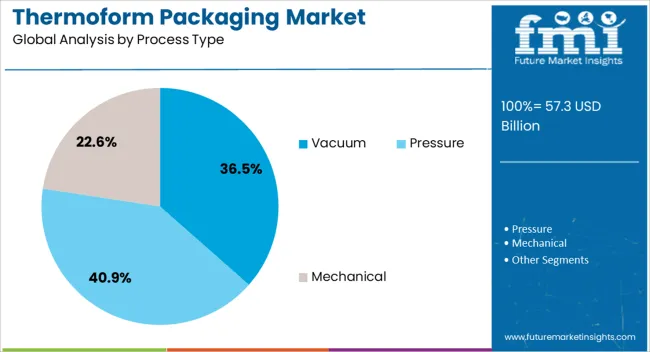
During the anticipated period, market development is anticipated to be driven by an increase in the supply of prepared foods, notably ready meals and packaged meat and fish products, as well as by the global expansion of organized and e-retail channels. Thermoplastic sheets are heated by manufacturers to a softening temperature and then molded utilizing castings during the thermoforming process. These sheets are frequently heated, suctioned, and compressed to produce the finished products.
Thermoform Packaging Trends to Create Revenue-Generating Opportunities
Blister pack shipment is also cost-effective and convenient, which encourages manufacturers to employ the product. The two primary types of thermoform packaging are thin-gauge and thick-gauge thermoforming. Food, pharmaceuticals, electronic components, and home care products are frequently packaged in trays, blisters, and containers composed of thin-gauge Thermoform polymers. For the packaging of oral solid dosages, the pharmaceutical sector in the United States has seen a trend away from conventional bottles and more toward blister packaging.
Blister packs and improved solid dose individual moisture and oxygen resistance are partially responsible for this development. Pharmaceutical manufacturers are also drawn to use blisters because of their affordability and portability. Manufacturers of packaged foods frequently employ thermoform packaging because it is affordable, lightweight, and appealing visually.
Thermoform Packaging Market Size (2023) |
US$ 50.390 Mn |
Thermoform Packaging Market Forecast Value (2033) |
US$ 84.450 Mn |
Thermoform Packaging Market CAGR |
5.3% |
Find your sweet spots for generating winning opportunities in this market.
Talk to AnalystHistorical Outlook Vs Future Forecast for Thermoform Packaging Market
Future Market Insights estimates that the thermoform packaging market rose at a CAGR of 5.5% from US$ 33.500 Mn in 2018 to US$ 41.500 Mn in 2022. Due to the rising demand for thermoform packaging in the food and beverage and pharmaceutical industries, the market witnessed substantial growth from 2018-2022.
Furthermore, the convenience and ease of use of thermoform packaging, preservation of food freshness and extension of shelf life, reduction of food product packaging costs, elimination of material waste, and facilitation of package customization are additional benefits of thermoform packaging that contributed to the growth of the global thermoform packaging industry during 2023-2033. According to a study by Future Market Insights, the thermoform packaging market is anticipated to expand at a CAGR of 5.3% during the forecast period.
Comparative View of the Adjacent Thermoform Packaging Market
Thermoform Packaging Market:
Attributes |
Thermoform Packaging Market |
CAGR (2023-2033) |
5.3% |
Industry Value (2033) |
US$ 84.450 Mn |
Growth Factor |
The market for thermoform packaging is expected to develop due to the growing need for lightweight packaging. |
Opportunity |
Modern thermoform technology makes it possible to create unique packaging options that draw customers and raise the likelihood that they will buy anything at the point of sale. |
Key Trends |
Numerous businesses, including those in the food and beverage, pharmaceutical, personal care, and automotive sectors, employ thermoforming packaging extensively. |
Thermoform Plastics Market:
Attributes |
Thermoform Plastics Market |
CAGR (2023-2033) |
4.8% |
Industry Value (2033) |
US$ 23.610 Mn |
Growth Factor |
Global demand for Thermoform plastics is anticipated to increase as a result of the expanding automotive sector and rules that support the use of light vehicles. |
Opportunity |
Growing healthcare and pharmaceutical packaging industry to be opportunistic for players in the market. |
Key Trends |
The food packaging sector is anticipated to grow along with retail shop enterprises such as convenience stores, supermarkets, and hypermarkets, which are anticipated to increase demand for Thermoform plastics. |
Thermoforming Machines Market:
Attributes |
Thermoforming Machines Market |
CAGR (2023-2033) |
4.2% |
Industry Value (2033) |
US$ 1.525.38 Mn |
Growth Factor |
The global market is expected to benefit from the growing demand for Thermoform packaging solutions. |
Opportunity |
It is also predicted that the food and pharmaceutical sectors' rising need for packaged goods would boost sales of this equipment. |
Key Trends |
Growth is anticipated to be aided by rising demand for automated equipment and the accelerating uptake of new technologies by end-use industries. |

A unified Market Research Subscription Platform, built for today's disparate research needs.
Category-wise insights
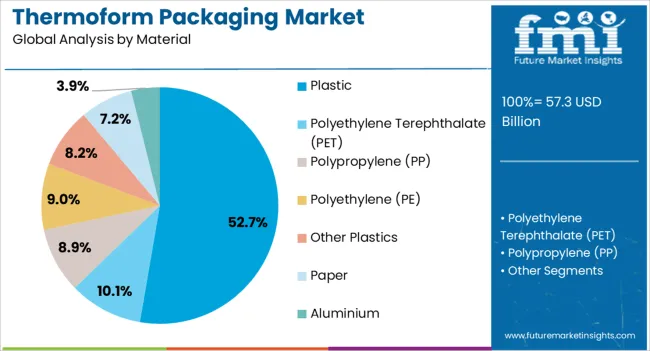
By Material, the Polyethylene Terephthalate (PET) Segment Accounted for More than 51% of the Market Share in 2022.
Features of PET materials include high tensile strength, low weight, and recyclability increasing demand, which leads to growth. Additionally, PET doesn't interact with food or drinks because it doesn't absorb much water. It is a fantastic option for packing consumable goods because of these qualities. Thermoform packaging is made from PET grades including R-PET, C-PET, and A-PET. Amorphous Polyethylene Terephthalate (A-PET) is a transparent polymer that is perfect for making containers for showcasing different goods, such as confectionery items. C-PET, also known as crystalline polyethylene terephthalate, is perfect for packing oven- and freezer-ready food since it can tolerate high temperatures.
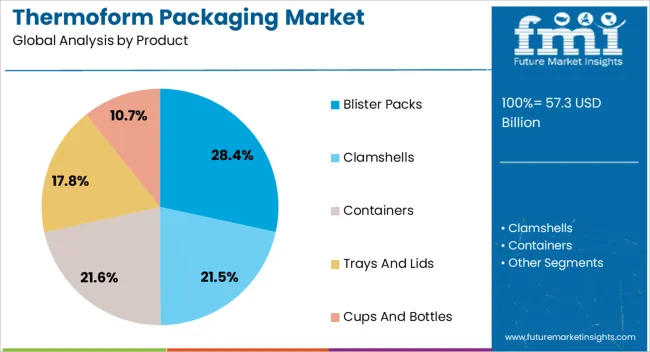
By Product, the Containers Segment Dominated the Market with a Share of 27% During 2023-2033
The containers commanded the most sales share in 2022. The substantial proportion of the market was largely due to the growing usage of Thermoform containers in the food service industry. The category will develop steadily in the next years due to the rapidly increasing penetration of meal delivery services, particularly in emerging nations.
The blister is another well-known item that is commonly utilized in the personal care, pharmaceutical, and electronics industries. The components of a blister pack consist of a pocket or hollow into which the product to be packaged is placed. The pocket or hollow is then sealed with a paperboard or other many materials, such as aluminum foil or even plastic.
The clamshell product category is anticipated to expand at the fastest pace between 2023 and 2033. The great aesthetic attractiveness of clamshells increases demand for them in the retail sector. A clamshell is a container with two sides connected by a hinge that aids in closing the container. Clamshells are most frequently utilized in the technology and food and beverage industries.
The food industry frequently uses Thermoform trays, especially in supermarkets, to display a range of products including meat, fruits, and vegetables. Throughout the anticipated period, it is anticipated that the growing penetration of organized retail networks and the cold chain in emerging countries would promote the growth of the trays product type sector.
By End User, Food & Beverage Sector Dominated the Thermoform Packaging Industry with a 52% Share During 2023-2033
The end-user industry segment for food and beverage had the highest sales share in 2022. This segment's higher market share may be attributed to the significant usage of various products by packaged food manufacturers and food service establishments, such as containers, trays, and clamshells. Over the anticipated period, it is expected that rising consumer demand for packaged or convenient food products as a result of changing lifestyles would increase thermoform product penetration in the food & beverage end-use sector segment. The shifting desire for sustainable packaging solutions, such as molded pulp products, is predicted to impede the segment's growth.
The industrial sector for pharmaceutical end-users is predicted to expand the fastest between 2023 and 2033. The primary factors influencing the segment's growth include the rapidly expanding global pharmaceutical business, an increase in the prevalence of chronic disorders, and an aging population. Pharmaceutical companies use Thermoform blisters because of their superior unit dose packing.
Electronics is another significant end-user industrial sector, and products including headphones, batteries, mobile accessories, and others are packaged in thermoform containers, clamshells, and blisters. The rise of the electronics industry has been significantly aided by growing e-commerce penetration, which is anticipated to positively impact category growth in the coming years.
Country-wise insights
Due to the Wide Availability of Opportunities and Presence of Major Players in the Region, the United States Leads the Thermoform Packaging Industry
In 2022, North America held a 29% sales share, dominating the market. The significant proportion of the regional market in 2022 was largely due to the existence of big, packaged food firms and the substantial penetration of organized retail. The expansion of the region was also aided by the existence of sizable thermoform packaging producers who compete for a larger market share by launching cutting-edge goods. High use of frozen meat and packaged baked goods are two other elements that influenced the regional market.
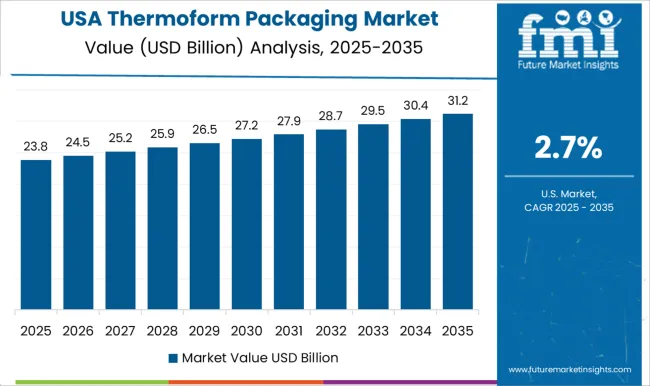
The United States thermoform packaging industry is anticipated to reach a valuation of approximately US$ 26.200 Mn by 2033, growing at a CAGR of 6% during the forecast period.
Germany to Hold Dominant Share in the Europe Thermoform Packaging Market
The growth is mostly attributable to the established economies of Germany and the United Kingdom, as well as to the expanding use of thermoform packaging in the food, beverage, and pharmaceutical sectors.
Due to the regulatory framework set by government agencies, such as a ban on single-use plastics to reduce plastic waste, Europe as a mature market is likely to have moderate development. Due to rising domestic demand and rising consumer awareness of environmental protection, Germany is predicted to be one of the fastest-expanding European thermoforming packaging markets, growing at a CAGR of 5.6% during the projected period.
China Thermoform Packaging Market to Witness High Growth Prospects
China's thermoform packaging industry is expected to reach a valuation of US$ 15.250 Mn by 2033, growing at a CAGR of 7% during the forecast period.
Customers increasingly are spending more money at internet retailers. Additionally, compared to January 2019, China saw a 200% growth in the selling of fresh food through online platforms in just 10 days. Through internet retailers, sales of meat and vegetables surged by more than 400%. Customers are likely to put a lot of emphasis on cleanliness and safety standards. Customers are also growing more and more cost concerned. As a result, packaging firms are expected to make a big move toward attaining scales to prosper in a cutthroat market.
Japan Thermoform Packaging Market Outlook
The thermoform packaging industry in Japan is projected to be worth US$ 1,420 Mn, expanding at a CAGR of 5% during the forecast period. Asia Pacific the region with the fastest expanding economy. This is driving up demand for food, drinks, pharmaceuticals, and gadgets in Japan. Due to its affordable labor and raw material costs, Japan is becoming a manufacturing center for electronics and medicines. The Asia Pacific area, which the International Monetary Fund (IMF) estimates to be responsible for 50% of the global GDP, is expected to become a major center for consumption throughout the projection period.
Korea Thermoform Packaging Market Insights
The thermoform packaging industry in South Korea is estimated to be worth US$ 14.3 Mn by 2033, increasing at a CAGR of 3.3% during the forecast period. South Korea’s growing middle class and high consumption of packaged foods and drinks are some of the major factors behind the rise in sales of thermoform packaging.
Due to a large number of migrant workers in South Korea and the rapidly expanding economy, Korea is anticipated to become a lucrative region for thermoform packaging industry. As a result, this factor is anticipated to gain the attention of several global players to expand their territory in Korea.
Amcor and Mondi Group to Scale Up the Competition in the Thermoform Packaging Industry
Amcor Limited paid $280 Mn for the assets of Sonoco's North American plastic blow molding division. The business of flexible packaging, thermoforming rigid plastics, and temperature-assurance packaging were all acquired by Sonoco. Furthermore, Amcor Limited purchased Bemis Company, Inc. in June 2019 for a price of US$6.8 billion. Shareholders of Amcor will now own 71% of the corporation, while those of Bemis will hold 29%. Amcor Limited has been able to improve its position in the international market thanks to this purchase.
The thermoform industry has seen several mergers and acquisitions by competitors, allowing them to increase both their market share and market growth. The market's participants have also been able to introduce advancements in their products that enable them to give sustainability to their customers via ongoing research and development initiatives.
For example, the development of Catalysis Additive Tooling by Darrell Stafford and Rick Shibko is recognized as a forward-thinking innovation. In comparison to aluminum tools, 3D-printed thermoforming tools may be made in less than two weeks for a far lower price. Although traditional RenShape, wood, or aluminum tooling may still be replaced, 3D-printed tooling is just one tool in the toolbox and cannot take its place. The project amount, component size, and materials being used are always used to decide the approach that is best for the application. Although other 3D printing methods might be used to create thermoforming tools, binder jet 3D printing with a Catalysis coating package is frequently the fastest and least expensive option.
More Developments in the Thermoform Packaging Industry
- The flexible packaging business in India, Creative Polypack Limited, was purchased by Constantia Flexibles GmbH in March 2018. Production facilities in Baddi, Kanpur, Kolkata, Assam, and Puducherry, in northern, eastern, and southern India, have been acquired by The Creative Polypack Limited.
- CorePET, a brand-new 100% rPET sheet created especially for the thermoform packaging market, was introduced by COEXPAN in October 2019.
- To increase the shelf life of items like meat and cheese, Mondi Group developed a 100% recyclable polypropylene film for use in thermoforming flexible films for modified atmosphere packaging (MAP) and vacuum packaging. With an interior barrier layer that makes up less than 5% of the whole structure, the product promises a 23% decrease in carbon footprint compared to traditional packaging and is entirely recyclable in existing waste streams.
- Due to its broad product selection, notably for the food and beverage sector, and strong North American presence, Pactiv LLC became the market leader in 2020.
Some of the Major Players in the Thermoform Packaging Market
- Sonoco Products Company
- Placon Corp.
- Display Pack, Inc.
- Pactiv LLC
- Amcor
- Mondi Group
- Dart Container Corp.
- Constantia
- Tray-Pak Corp.
- D&W Fine Pack
- Lacerta Group, Inc.
Thermoform Packaging Market report scope
Attribute |
Details |
Forecast period |
2023-2033 |
Historical data available for |
2018 to 2022 |
Industry analysis |
US$ Mn in value |
Key regions covered |
|
Key countries covered |
|
Key segments covered |
|
Key companies profiled |
|
Report Coverage |
|
Customization and Pricing |
Available upon request |
Thermoform Packaging Market Segmentation by Category
By Material:
- PET
- PVC
- PS
- PP
- PE
- Others
By Product:
- Blister
- Clamshell
- Skin Packaging
- Trays & Lids
- Containers
- Others
By Heat Seal Coating:
- Hot Melt-Based
- Solvent-Based
- Water-Based
By End User:
- Food & Beverage
- Personal Care & Cosmetics
- Pharmaceuticals
- Electronics
- Homecare
- Others
By Region:
- North America
- Latin America
- Asia Pacific
- Eastern Europe
- Western Europe
- Japan
Frequently Asked Questions
The thermoform packaging size is assessed to be US$ 50.390 Mn in 2023.
The thermoform packaging is expected to rise at a CAGR of 5.3% during the forecast period.
China's thermoform packaging is projected to grow at a CAGR of around 7% through 2033.
Germany's thermoform packaging industry is predicted to grow at a CAGR of 5.6% during the forecast period.
The global thermoform packaging is forecast to surpass US$ 84,450 Mn by 2033.
Table of Content
1. Executive Summary
1.1. Global Market Outlook
1.2. Demand-side Trends
1.3. Supply-side Trends
1.4. Technology Roadmap Analysis
1.5. Analysis and Recommendations
2. Market Overview
2.1. Market Coverage / Taxonomy
2.2. Market Definition / Scope / Limitations
3. Market Background
3.1. Market Dynamics
3.1.1. Drivers
3.1.2. Restraints
3.1.3. Opportunity
3.1.4. Trends
3.2. Scenario Forecast
3.2.1. Demand in Optimistic Scenario
3.2.2. Demand in Likely Scenario
3.2.3. Demand in Conservative Scenario
3.3. Opportunity Map Analysis
3.4. Investment Feasibility Matrix
3.5. PESTLE and Porter’s Analysis
3.6. Regulatory Landscape
3.6.1. By Key Regions
3.6.2. By Key Countries
3.7. Regional Parent Market Outlook
4. Global Market Analysis 2018-2022 and Forecast, 2023-2033
4.1. Historical Market Size Value (US$ Mn) Analysis, 2018-2022
4.2. Current and Future Market Size Value (US$ Mn) Projections, 2023-2033
4.2.1. Y-o-Y Growth Trend Analysis
4.2.2. Absolute $ Opportunity Analysis
5. Global Market Analysis 2018-2022 and Forecast 2023-2033, By Material
5.1. Introduction / Key Findings
5.2. Historical Market Size Value (US$ Mn) Analysis By Material, 2018-2022
5.3. Current and Future Market Size Value (US$ Mn) Analysis and Forecast By Material, 2023-2033
5.3.1. PET
5.3.2. PVC
5.3.3. PS
5.3.4. PP
5.3.5. PE
5.3.6. Other Materials
5.4. Y-o-Y Growth Trend Analysis By Material, 2018-2022
5.5. Absolute $ Opportunity Analysis By Material, 2023-2033
6. Global Market Analysis 2018-2022 and Forecast 2023-2033, By Product Type
6.1. Introduction / Key Findings
6.2. Historical Market Size Value (US$ Mn) Analysis By Product Type, 2018-2022
6.3. Current and Future Market Size Value (US$ Mn) Analysis and Forecast By Product Type, 2023-2033
6.3.1. Blister
6.3.2. Clamshell
6.3.3. Skin Packaging
6.3.4. Trays & Lids
6.3.5. Containers
6.3.6. Other Product Types
6.4. Y-o-Y Growth Trend Analysis By Product Type, 2018-2022
6.5. Absolute $ Opportunity Analysis By Product Type, 2023-2033
7. Global Market Analysis 2018-2022 and Forecast 2023-2033, By End-user Industry
7.1. Introduction / Key Findings
7.2. Historical Market Size Value (US$ Mn) Analysis By End-user Industry , 2018-2022
7.3. Current and Future Market Size Value (US$ Mn) Analysis and Forecast By End-user Industry , 2023-2033
7.3.1. Food & Beverage
7.3.2. Personal Care & Cosmetics
7.3.3. Pharmaceuticals
7.3.4. Electronics
7.3.5. Homecare
7.3.6. Others
7.4. Y-o-Y Growth Trend Analysis By End-user Industry , 2018-2022
7.5. Absolute $ Opportunity Analysis By End-user Industry , 2023-2033
8. Global Market Analysis 2018-2022 and Forecast 2023-2033, By Region
8.1. Introduction
8.2. Historical Market Size Value (US$ Mn) Analysis By Region, 2018-2022
8.3. Current Market Size Value (US$ Mn) Analysis and Forecast By Region, 2023-2033
8.3.1. North America
8.3.2. Latin America
8.3.3. Europe
8.3.4. South Asia & Pacific
8.3.5. East Asia
8.3.6. MEA
8.4. Market Attractiveness Analysis By Region
9. North America Market Analysis 2018-2022 and Forecast 2023-2033, By Country
9.1. Historical Market Size Value (US$ Mn) Trend Analysis By Market Taxonomy, 2018-2022
9.2. Market Size Value (US$ Mn) Forecast By Market Taxonomy, 2023-2033
9.2.1. By Country
9.2.1.1. U.S.
9.2.1.2. Canada
9.2.2. By Material
9.2.3. By Product Type
9.2.4. By End-user Industry
9.3. Market Attractiveness Analysis
9.3.1. By Country
9.3.2. By Material
9.3.3. By Product Type
9.3.4. By End-user Industry
9.4. Key Takeaways
10. Latin America Market Analysis 2018-2022 and Forecast 2023-2033, By Country
10.1. Historical Market Size Value (US$ Mn) Trend Analysis By Market Taxonomy, 2018-2022
10.2. Market Size Value (US$ Mn) Forecast By Market Taxonomy, 2023-2033
10.2.1. By Country
10.2.1.1. Brazil
10.2.1.2. Mexico
10.2.1.3. Rest of Latin America
10.2.2. By Material
10.2.3. By Product Type
10.2.4. By End-user Industry
10.3. Market Attractiveness Analysis
10.3.1. By Country
10.3.2. By Material
10.3.3. By Product Type
10.3.4. By End-user Industry
10.4. Key Takeaways
11. Europe Market Analysis 2018-2022 and Forecast 2023-2033, By Country
11.1. Historical Market Size Value (US$ Mn) Trend Analysis By Market Taxonomy, 2018-2022
11.2. Market Size Value (US$ Mn) Forecast By Market Taxonomy, 2023-2033
11.2.1. By Country
11.2.1.1. Germany
11.2.1.2. U.K.
11.2.1.3. France
11.2.1.4. Spain
11.2.1.5. Italy
11.2.1.6. Rest of Europe
11.2.2. By Material
11.2.3. By Product Type
11.2.4. By End-user Industry
11.3. Market Attractiveness Analysis
11.3.1. By Country
11.3.2. By Material
11.3.3. By Product Type
11.3.4. By End-user Industry
11.4. Key Takeaways
12. South Asia & Pacific Market Analysis 2018-2022 and Forecast 2023-2033, By Country
12.1. Historical Market Size Value (US$ Mn) Trend Analysis By Market Taxonomy, 2018-2022
12.2. Market Size Value (US$ Mn) Forecast By Market Taxonomy, 2023-2033
12.2.1. By Country
12.2.1.1. India
12.2.1.2. Malaysia
12.2.1.3. Singapore
12.2.1.4. Thailand
12.2.1.5. Australia
12.2.1.6. New Zealand
12.2.1.7. Rest of South Asia & Pacific
12.2.2. By Material
12.2.3. By Product Type
12.2.4. By End-user Industry
12.3. Market Attractiveness Analysis
12.3.1. By Country
12.3.2. By Material
12.3.3. By Product Type
12.3.4. By End-user Industry
12.4. Key Takeaways
13. East Asia Market Analysis 2018-2022 and Forecast 2023-2033, By Country
13.1. Historical Market Size Value (US$ Mn) Trend Analysis By Market Taxonomy, 2018-2022
13.2. Market Size Value (US$ Mn) Forecast By Market Taxonomy, 2023-2033
13.2.1. By Country
13.2.1.1. China
13.2.1.2. Japan
13.2.1.3. South Korea
13.2.2. By Material
13.2.3. By Product Type
13.2.4. By End-user Industry
13.3. Market Attractiveness Analysis
13.3.1. By Country
13.3.2. By Material
13.3.3. By Product Type
13.3.4. By End-user Industry
13.4. Key Takeaways
14. MEA Market Analysis 2018-2022 and Forecast 2023-2033, By Country
14.1. Historical Market Size Value (US$ Mn) Trend Analysis By Market Taxonomy, 2018-2022
14.2. Market Size Value (US$ Mn) Forecast By Market Taxonomy, 2023-2033
14.2.1. By Country
14.2.1.1. GCC Countries
14.2.1.2. South Africa
14.2.1.3. Israel
14.2.1.4. Rest of MEA
14.2.2. By Material
14.2.3. By Product Type
14.2.4. By End-user Industry
14.3. Market Attractiveness Analysis
14.3.1. By Country
14.3.2. By Material
14.3.3. By Product Type
14.3.4. By End-user Industry
14.4. Key Takeaways
15. Key Countries Market Analysis
15.1. U.S.
15.1.1. Pricing Analysis
15.1.2. Market Share Analysis, 2022
15.1.2.1. By Material
15.1.2.2. By Product Type
15.1.2.3. By End-user Industry
15.2. Canada
15.2.1. Pricing Analysis
15.2.2. Market Share Analysis, 2022
15.2.2.1. By Material
15.2.2.2. By Product Type
15.2.2.3. By End-user Industry
15.3. Brazil
15.3.1. Pricing Analysis
15.3.2. Market Share Analysis, 2022
15.3.2.1. By Material
15.3.2.2. By Product Type
15.3.2.3. By End-user Industry
15.4. Mexico
15.4.1. Pricing Analysis
15.4.2. Market Share Analysis, 2022
15.4.2.1. By Material
15.4.2.2. By Product Type
15.4.2.3. By End-user Industry
15.5. Germany
15.5.1. Pricing Analysis
15.5.2. Market Share Analysis, 2022
15.5.2.1. By Material
15.5.2.2. By Product Type
15.5.2.3. By End-user Industry
15.6. U.K.
15.6.1. Pricing Analysis
15.6.2. Market Share Analysis, 2022
15.6.2.1. By Material
15.6.2.2. By Product Type
15.6.2.3. By End-user Industry
15.7. France
15.7.1. Pricing Analysis
15.7.2. Market Share Analysis, 2022
15.7.2.1. By Material
15.7.2.2. By Product Type
15.7.2.3. By End-user Industry
15.8. Spain
15.8.1. Pricing Analysis
15.8.2. Market Share Analysis, 2022
15.8.2.1. By Material
15.8.2.2. By Product Type
15.8.2.3. By End-user Industry
15.9. Italy
15.9.1. Pricing Analysis
15.9.2. Market Share Analysis, 2022
15.9.2.1. By Material
15.9.2.2. By Product Type
15.9.2.3. By End-user Industry
15.10. India
15.10.1. Pricing Analysis
15.10.2. Market Share Analysis, 2022
15.10.2.1. By Material
15.10.2.2. By Product Type
15.10.2.3. By End-user Industry
15.11. Malaysia
15.11.1. Pricing Analysis
15.11.2. Market Share Analysis, 2022
15.11.2.1. By Material
15.11.2.2. By Product Type
15.11.2.3. By End-user Industry
15.12. Singapore
15.12.1. Pricing Analysis
15.12.2. Market Share Analysis, 2022
15.12.2.1. By Material
15.12.2.2. By Product Type
15.12.2.3. By End-user Industry
15.13. Thailand
15.13.1. Pricing Analysis
15.13.2. Market Share Analysis, 2022
15.13.2.1. By Material
15.13.2.2. By Product Type
15.13.2.3. By End-user Industry
15.14. China
15.14.1. Pricing Analysis
15.14.2. Market Share Analysis, 2022
15.14.2.1. By Material
15.14.2.2. By Product Type
15.14.2.3. By End-user Industry
15.15. Japan
15.15.1. Pricing Analysis
15.15.2. Market Share Analysis, 2022
15.15.2.1. By Material
15.15.2.2. By Product Type
15.15.2.3. By End-user Industry
15.16. South Korea
15.16.1. Pricing Analysis
15.16.2. Market Share Analysis, 2022
15.16.2.1. By Material
15.16.2.2. By Product Type
15.16.2.3. By End-user Industry
15.17. Australia
15.17.1. Pricing Analysis
15.17.2. Market Share Analysis, 2022
15.17.2.1. By Material
15.17.2.2. By Product Type
15.17.2.3. By End-user Industry
15.18. New Zealand
15.18.1. Pricing Analysis
15.18.2. Market Share Analysis, 2022
15.18.2.1. By Material
15.18.2.2. By Product Type
15.18.2.3. By End-user Industry
15.19. GCC Countries
15.19.1. Pricing Analysis
15.19.2. Market Share Analysis, 2022
15.19.2.1. By Material
15.19.2.2. By Product Type
15.19.2.3. By End-user Industry
15.20. South Africa
15.20.1. Pricing Analysis
15.20.2. Market Share Analysis, 2022
15.20.2.1. By Material
15.20.2.2. By Product Type
15.20.2.3. By End-user Industry
15.21. Israel
15.21.1. Pricing Analysis
15.21.2. Market Share Analysis, 2022
15.21.2.1. By Material
15.21.2.2. By Product Type
15.21.2.3. By End-user Industry
16. Market Structure Analysis
16.1. Competition Dashboard
16.2. Competition Benchmarking
16.3. Market Share Analysis of Top Players
16.3.1. By Regional
16.3.2. By Material
16.3.3. By Product Type
16.3.4. By End-user Industry
17. Competition Analysis
17.1. Competition Deep Dive
17.1.1. Amcor
17.1.1.1. Overview
17.1.1.2. Product Portfolio
17.1.1.3. Profitability by Market Segments
17.1.1.4. Sales Footprint
17.1.1.5. Strategy Overview
17.1.1.5.1. Marketing Strategy
17.1.2. Sonoco Products Company
17.1.2.1. Overview
17.1.2.2. Product Portfolio
17.1.2.3. Profitability by Market Segments
17.1.2.4. Sales Footprint
17.1.2.5. Strategy Overview
17.1.2.5.1. Marketing Strategy
17.1.3. Placon Corp
17.1.3.1. Overview
17.1.3.2. Product Portfolio
17.1.3.3. Profitability by Market Segments
17.1.3.4. Sales Footprint
17.1.3.5. Strategy Overview
17.1.3.5.1. Marketing Strategy
17.1.4. Display Pack, Inc.
17.1.4.1. Overview
17.1.4.2. Product Portfolio
17.1.4.3. Profitability by Market Segments
17.1.4.4. Sales Footprint
17.1.4.5. Strategy Overview
17.1.4.5.1. Marketing Strategy
17.1.5. Pactiv LLC
17.1.5.1. Overview
17.1.5.2. Product Portfolio
17.1.5.3. Profitability by Market Segments
17.1.5.4. Sales Footprint
17.1.5.5. Strategy Overview
17.1.5.5.1. Marketing Strategy
17.1.6. Dart Container Corp.
17.1.6.1. Overview
17.1.6.2. Product Portfolio
17.1.6.3. Profitability by Market Segments
17.1.6.4. Sales Footprint
17.1.6.5. Strategy Overview
17.1.6.5.1. Marketing Strategy
17.1.7. Constantia
17.1.7.1. Overview
17.1.7.2. Product Portfolio
17.1.7.3. Profitability by Market Segments
17.1.7.4. Sales Footprint
17.1.7.5. Strategy Overview
17.1.7.5.1. Marketing Strategy
17.1.8. RPC Group Plc
17.1.8.1. Overview
17.1.8.2. Product Portfolio
17.1.8.3. Profitability by Market Segments
17.1.8.4. Sales Footprint
17.1.8.5. Strategy Overview
17.1.8.5.1. Marketing Strategy
17.1.9. D&W Fine Pack
17.1.9.1. Overview
17.1.9.2. Product Portfolio
17.1.9.3. Profitability by Market Segments
17.1.9.4. Sales Footprint
17.1.9.5. Strategy Overview
17.1.9.5.1. Marketing Strategy
17.1.10. Lacerta Group, Inc.
17.1.10.1. Overview
17.1.10.2. Product Portfolio
17.1.10.3. Profitability by Market Segments
17.1.10.4. Sales Footprint
17.1.10.5. Strategy Overview
17.1.10.5.1. Marketing Strategy
18. Assumptions & Acronyms Used
19. Research Methodology
Let us know your requirement to get
100% FREE customization
List of Tables
Table 1: Global Market Value (US$ Mn) Forecast by Region, 2018-2033
Table 2: Global Market Value (US$ Mn) Forecast by Material, 2018-2033
Table 3: Global Market Value (US$ Mn) Forecast by Product Type, 2018-2033
Table 4: Global Market Value (US$ Mn) Forecast by End-user Industry , 2018-2033
Table 5: North America Market Value (US$ Mn) Forecast by Country, 2018-2033
Table 6: North America Market Value (US$ Mn) Forecast by Material, 2018-2033
Table 7: North America Market Value (US$ Mn) Forecast by Product Type, 2018-2033
Table 8: North America Market Value (US$ Mn) Forecast by End-user Industry , 2018-2033
Table 9: Latin America Market Value (US$ Mn) Forecast by Country, 2018-2033
Table 10: Latin America Market Value (US$ Mn) Forecast by Material, 2018-2033
Table 11: Latin America Market Value (US$ Mn) Forecast by Product Type, 2018-2033
Table 12: Latin America Market Value (US$ Mn) Forecast by End-user Industry , 2018-2033
Table 13: Europe Market Value (US$ Mn) Forecast by Country, 2018-2033
Table 14: Europe Market Value (US$ Mn) Forecast by Material, 2018-2033
Table 15: Europe Market Value (US$ Mn) Forecast by Product Type, 2018-2033
Table 16: Europe Market Value (US$ Mn) Forecast by End-user Industry , 2018-2033
Table 17: South Asia & Pacific Market Value (US$ Mn) Forecast by Country, 2018-2033
Table 18: South Asia & Pacific Market Value (US$ Mn) Forecast by Material, 2018-2033
Table 19: South Asia & Pacific Market Value (US$ Mn) Forecast by Product Type, 2018-2033
Table 20: South Asia & Pacific Market Value (US$ Mn) Forecast by End-user Industry , 2018-2033
Table 21: East Asia Market Value (US$ Mn) Forecast by Country, 2018-2033
Table 22: East Asia Market Value (US$ Mn) Forecast by Material, 2018-2033
Table 23: East Asia Market Value (US$ Mn) Forecast by Product Type, 2018-2033
Table 24: East Asia Market Value (US$ Mn) Forecast by End-user Industry , 2018-2033
Table 25: MEA Market Value (US$ Mn) Forecast by Country, 2018-2033
Table 26: MEA Market Value (US$ Mn) Forecast by Material, 2018-2033
Table 27: MEA Market Value (US$ Mn) Forecast by Product Type, 2018-2033
Table 28: MEA Market Value (US$ Mn) Forecast by End-user Industry , 2018-2033
Find your sweet spots for generating winning opportunities in this market.
Talk to AnalystList of Charts
Figure 1: Global Market Value (US$ Mn) by Material, 2023-2033
Figure 2: Global Market Value (US$ Mn) by Product Type, 2023-2033
Figure 3: Global Market Value (US$ Mn) by End-user Industry , 2023-2033
Figure 4: Global Market Value (US$ Mn) by Region, 2023-2033
Figure 5: Global Market Value (US$ Mn) Analysis by Region, 2018-2033
Figure 6: Global Market Value Share (%) and BPS Analysis by Region, 2023-2033
Figure 7: Global Market Y-o-Y Growth (%) Projections by Region, 2023-2033
Figure 8: Global Market Value (US$ Mn) Analysis by Material, 2018-2033
Figure 9: Global Market Value Share (%) and BPS Analysis by Material, 2023-2033
Figure 10: Global Market Y-o-Y Growth (%) Projections by Material, 2023-2033
Figure 11: Global Market Value (US$ Mn) Analysis by Product Type, 2018-2033
Figure 12: Global Market Value Share (%) and BPS Analysis by Product Type, 2023-2033
Figure 13: Global Market Y-o-Y Growth (%) Projections by Product Type, 2023-2033
Figure 14: Global Market Value (US$ Mn) Analysis by End-user Industry , 2018-2033
Figure 15: Global Market Value Share (%) and BPS Analysis by End-user Industry , 2023-2033
Figure 16: Global Market Y-o-Y Growth (%) Projections by End-user Industry , 2023-2033
Figure 17: Global Market Attractiveness by Material, 2023-2033
Figure 18: Global Market Attractiveness by Product Type, 2023-2033
Figure 19: Global Market Attractiveness by End-user Industry , 2023-2033
Figure 20: Global Market Attractiveness by Region, 2023-2033
Figure 21: North America Market Value (US$ Mn) by Material, 2023-2033
Figure 22: North America Market Value (US$ Mn) by Product Type, 2023-2033
Figure 23: North America Market Value (US$ Mn) by End-user Industry , 2023-2033
Figure 24: North America Market Value (US$ Mn) by Country, 2023-2033
Figure 25: North America Market Value (US$ Mn) Analysis by Country, 2018-2033
Figure 26: North America Market Value Share (%) and BPS Analysis by Country, 2023-2033
Figure 27: North America Market Y-o-Y Growth (%) Projections by Country, 2023-2033
Figure 28: North America Market Value (US$ Mn) Analysis by Material, 2018-2033
Figure 29: North America Market Value Share (%) and BPS Analysis by Material, 2023-2033
Figure 30: North America Market Y-o-Y Growth (%) Projections by Material, 2023-2033
Figure 31: North America Market Value (US$ Mn) Analysis by Product Type, 2018-2033
Figure 32: North America Market Value Share (%) and BPS Analysis by Product Type, 2023-2033
Figure 33: North America Market Y-o-Y Growth (%) Projections by Product Type, 2023-2033
Figure 34: North America Market Value (US$ Mn) Analysis by End-user Industry , 2018-2033
Figure 35: North America Market Value Share (%) and BPS Analysis by End-user Industry , 2023-2033
Figure 36: North America Market Y-o-Y Growth (%) Projections by End-user Industry , 2023-2033
Figure 37: North America Market Attractiveness by Material, 2023-2033
Figure 38: North America Market Attractiveness by Product Type, 2023-2033
Figure 39: North America Market Attractiveness by End-user Industry , 2023-2033
Figure 40: North America Market Attractiveness by Country, 2023-2033
Figure 41: Latin America Market Value (US$ Mn) by Material, 2023-2033
Figure 42: Latin America Market Value (US$ Mn) by Product Type, 2023-2033
Figure 43: Latin America Market Value (US$ Mn) by End-user Industry , 2023-2033
Figure 44: Latin America Market Value (US$ Mn) by Country, 2023-2033
Figure 45: Latin America Market Value (US$ Mn) Analysis by Country, 2018-2033
Figure 46: Latin America Market Value Share (%) and BPS Analysis by Country, 2023-2033
Figure 47: Latin America Market Y-o-Y Growth (%) Projections by Country, 2023-2033
Figure 48: Latin America Market Value (US$ Mn) Analysis by Material, 2018-2033
Figure 49: Latin America Market Value Share (%) and BPS Analysis by Material, 2023-2033
Figure 50: Latin America Market Y-o-Y Growth (%) Projections by Material, 2023-2033
Figure 51: Latin America Market Value (US$ Mn) Analysis by Product Type, 2018-2033
Figure 52: Latin America Market Value Share (%) and BPS Analysis by Product Type, 2023-2033
Figure 53: Latin America Market Y-o-Y Growth (%) Projections by Product Type, 2023-2033
Figure 54: Latin America Market Value (US$ Mn) Analysis by End-user Industry , 2018-2033
Figure 55: Latin America Market Value Share (%) and BPS Analysis by End-user Industry , 2023-2033
Figure 56: Latin America Market Y-o-Y Growth (%) Projections by End-user Industry , 2023-2033
Figure 57: Latin America Market Attractiveness by Material, 2023-2033
Figure 58: Latin America Market Attractiveness by Product Type, 2023-2033
Figure 59: Latin America Market Attractiveness by End-user Industry , 2023-2033
Figure 60: Latin America Market Attractiveness by Country, 2023-2033
Figure 61: Europe Market Value (US$ Mn) by Material, 2023-2033
Figure 62: Europe Market Value (US$ Mn) by Product Type, 2023-2033
Figure 63: Europe Market Value (US$ Mn) by End-user Industry , 2023-2033
Figure 64: Europe Market Value (US$ Mn) by Country, 2023-2033
Figure 65: Europe Market Value (US$ Mn) Analysis by Country, 2018-2033
Figure 66: Europe Market Value Share (%) and BPS Analysis by Country, 2023-2033
Figure 67: Europe Market Y-o-Y Growth (%) Projections by Country, 2023-2033
Figure 68: Europe Market Value (US$ Mn) Analysis by Material, 2018-2033
Figure 69: Europe Market Value Share (%) and BPS Analysis by Material, 2023-2033
Figure 70: Europe Market Y-o-Y Growth (%) Projections by Material, 2023-2033
Figure 71: Europe Market Value (US$ Mn) Analysis by Product Type, 2018-2033
Figure 72: Europe Market Value Share (%) and BPS Analysis by Product Type, 2023-2033
Figure 73: Europe Market Y-o-Y Growth (%) Projections by Product Type, 2023-2033
Figure 74: Europe Market Value (US$ Mn) Analysis by End-user Industry , 2018-2033
Figure 75: Europe Market Value Share (%) and BPS Analysis by End-user Industry , 2023-2033
Figure 76: Europe Market Y-o-Y Growth (%) Projections by End-user Industry , 2023-2033
Figure 77: Europe Market Attractiveness by Material, 2023-2033
Figure 78: Europe Market Attractiveness by Product Type, 2023-2033
Figure 79: Europe Market Attractiveness by End-user Industry , 2023-2033
Figure 80: Europe Market Attractiveness by Country, 2023-2033
Figure 81: South Asia & Pacific Market Value (US$ Mn) by Material, 2023-2033
Figure 82: South Asia & Pacific Market Value (US$ Mn) by Product Type, 2023-2033
Figure 83: South Asia & Pacific Market Value (US$ Mn) by End-user Industry , 2023-2033
Figure 84: South Asia & Pacific Market Value (US$ Mn) by Country, 2023-2033
Figure 85: South Asia & Pacific Market Value (US$ Mn) Analysis by Country, 2018-2033
Figure 86: South Asia & Pacific Market Value Share (%) and BPS Analysis by Country, 2023-2033
Figure 87: South Asia & Pacific Market Y-o-Y Growth (%) Projections by Country, 2023-2033
Figure 88: South Asia & Pacific Market Value (US$ Mn) Analysis by Material, 2018-2033
Figure 89: South Asia & Pacific Market Value Share (%) and BPS Analysis by Material, 2023-2033
Figure 90: South Asia & Pacific Market Y-o-Y Growth (%) Projections by Material, 2023-2033
Figure 91: South Asia & Pacific Market Value (US$ Mn) Analysis by Product Type, 2018-2033
Figure 92: South Asia & Pacific Market Value Share (%) and BPS Analysis by Product Type, 2023-2033
Figure 93: South Asia & Pacific Market Y-o-Y Growth (%) Projections by Product Type, 2023-2033
Figure 94: South Asia & Pacific Market Value (US$ Mn) Analysis by End-user Industry , 2018-2033
Figure 95: South Asia & Pacific Market Value Share (%) and BPS Analysis by End-user Industry , 2023-2033
Figure 96: South Asia & Pacific Market Y-o-Y Growth (%) Projections by End-user Industry , 2023-2033
Figure 97: South Asia & Pacific Market Attractiveness by Material, 2023-2033
Figure 98: South Asia & Pacific Market Attractiveness by Product Type, 2023-2033
Figure 99: South Asia & Pacific Market Attractiveness by End-user Industry , 2023-2033
Figure 100: South Asia & Pacific Market Attractiveness by Country, 2023-2033
Figure 101: East Asia Market Value (US$ Mn) by Material, 2023-2033
Figure 102: East Asia Market Value (US$ Mn) by Product Type, 2023-2033
Figure 103: East Asia Market Value (US$ Mn) by End-user Industry , 2023-2033
Figure 104: East Asia Market Value (US$ Mn) by Country, 2023-2033
Figure 105: East Asia Market Value (US$ Mn) Analysis by Country, 2018-2033
Figure 106: East Asia Market Value Share (%) and BPS Analysis by Country, 2023-2033
Figure 107: East Asia Market Y-o-Y Growth (%) Projections by Country, 2023-2033
Figure 108: East Asia Market Value (US$ Mn) Analysis by Material, 2018-2033
Figure 109: East Asia Market Value Share (%) and BPS Analysis by Material, 2023-2033
Figure 110: East Asia Market Y-o-Y Growth (%) Projections by Material, 2023-2033
Figure 111: East Asia Market Value (US$ Mn) Analysis by Product Type, 2018-2033
Figure 112: East Asia Market Value Share (%) and BPS Analysis by Product Type, 2023-2033
Figure 113: East Asia Market Y-o-Y Growth (%) Projections by Product Type, 2023-2033
Figure 114: East Asia Market Value (US$ Mn) Analysis by End-user Industry , 2018-2033
Figure 115: East Asia Market Value Share (%) and BPS Analysis by End-user Industry , 2023-2033
Figure 116: East Asia Market Y-o-Y Growth (%) Projections by End-user Industry , 2023-2033
Figure 117: East Asia Market Attractiveness by Material, 2023-2033
Figure 118: East Asia Market Attractiveness by Product Type, 2023-2033
Figure 119: East Asia Market Attractiveness by End-user Industry , 2023-2033
Figure 120: East Asia Market Attractiveness by Country, 2023-2033
Figure 121: MEA Market Value (US$ Mn) by Material, 2023-2033
Figure 122: MEA Market Value (US$ Mn) by Product Type, 2023-2033
Figure 123: MEA Market Value (US$ Mn) by End-user Industry , 2023-2033
Figure 124: MEA Market Value (US$ Mn) by Country, 2023-2033
Figure 125: MEA Market Value (US$ Mn) Analysis by Country, 2018-2033
Figure 126: MEA Market Value Share (%) and BPS Analysis by Country, 2023-2033
Figure 127: MEA Market Y-o-Y Growth (%) Projections by Country, 2023-2033
Figure 128: MEA Market Value (US$ Mn) Analysis by Material, 2018-2033
Figure 129: MEA Market Value Share (%) and BPS Analysis by Material, 2023-2033
Figure 130: MEA Market Y-o-Y Growth (%) Projections by Material, 2023-2033
Figure 131: MEA Market Value (US$ Mn) Analysis by Product Type, 2018-2033
Figure 132: MEA Market Value Share (%) and BPS Analysis by Product Type, 2023-2033
Figure 133: MEA Market Y-o-Y Growth (%) Projections by Product Type, 2023-2033
Figure 134: MEA Market Value (US$ Mn) Analysis by End-user Industry , 2018-2033
Figure 135: MEA Market Value Share (%) and BPS Analysis by End-user Industry , 2023-2033
Figure 136: MEA Market Y-o-Y Growth (%) Projections by End-user Industry , 2023-2033
Figure 137: MEA Market Attractiveness by Material, 2023-2033
Figure 138: MEA Market Attractiveness by Product Type, 2023-2033
Figure 139: MEA Market Attractiveness by End-user Industry , 2023-2033
Figure 140: MEA Market Attractiveness by Country, 2023-2033
Need specific information?
Request CustomizationExplore Packaging Insights
View Reports