Tinnitus Management Market
Market Insights on Tinnitus Management covering sales outlook, demand forecast & up-to-date key trends
Tinnitus Management Market by Product (Devices, Drugs), Indication (Subjective Tinnitus, Objective Tinnitus), End User (Audiology Centers, ENT Clinics, Hospitals, E-Commerce) & Region - Forecast to 2021 - 2031
Tinnitus Management Market Snapshot
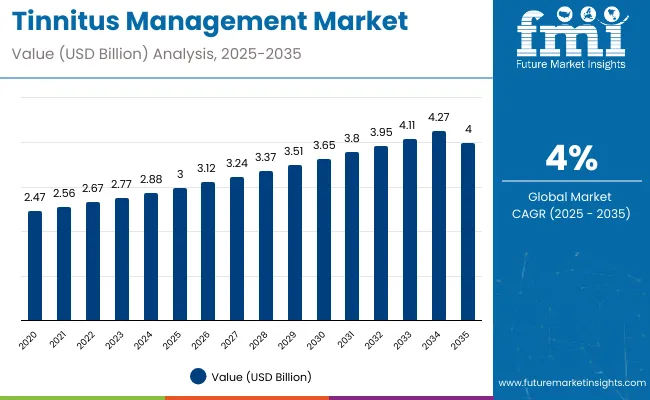
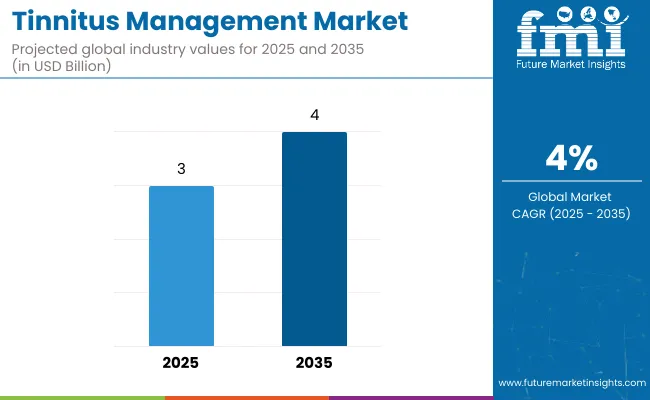
[301 Pages Report] The global tinnitus management market was valued at US$ 2.4 Bn in 2020 and is expected to reach US$ 3.2 Bn by 2031, finds Future Market Insights (FMI) in a recent market survey.
Growing cases of ear hair cell damage, earwax blockage, and rising usage of headphone for listening loud music are leading to increase in prevalence of tinnitus. Technological advancements in hearing aids and increase in research and development (R&D) activities will result in high tinnitus management market growth. According to FMI, the global tinnitus management market accounts for 24% of the US$ 9.5 Bn audiology market.
There has been significant developments in tinnitus technology and tinnitus management devices which are well accepted sound therapies that provides long-term relief. Driven by this, sales in the tinnitus management market are expected to rise at a 2.8% CAGR through 2031.
Data Points |
Market Insights |
Tinnitus Management Market Value 2020 |
USD 2.4 Bn |
Tinnitus Management Market Estimated Value 2021 |
USD 2.5 Bn |
CAGR 2021-2031 |
2.8% |
Key Players |
The key players in tinnitus management market are Signia, Starkey Hearing Technologies, Inc., GN Hearing A/S, Widex A/S |
Let us know your requirement to get
100% FREE customization
2021-2031 Tinnitus Management Market Outlook Compared to 2016-2020
Sales of tinnitus management drugs and devices grew at a CAGR of 2.4% between 2016 and 2020. Growing prevalence of tinnitus and increasing investment in the research & developments initiatives will continue driving the tinnitus management market.
The worldwide prevalence of hearing impairment is rising exponentially. The World Health Organization (WHO) estimates that around 466 million people globally are affected by disabling hearing loss and the number is estimated to rise considerably in the coming years.
There have been significant shift in patient preference towards innovative and advanced technologies such as mobile apps and other hearing aids accessories in the recent past.
For Instance, 2020 excerpt published in Tinnitus Today talked about Neuromod Devices Limited of Ireland and its device, which uses bimodal neuromodulation combining sound and tongue stimulation to modulate the brain for treating the tinnitus.
With the healthcare field consistently evolving due to pandemic to find newer technologies to treat the existing ailments effectively, tinnitus management market is expected to register impressive growth in the future.
In the coming years the demand for advanced tinnitus wearable sound generators and hearing aids will rise, enabling the market to register a CAGR of 2.8% through 2031.
Which Factors Are Restraining the Tinnitus Management Market?
Inadequate reimbursement scenario for hearing aids is expected to hamper the growth of tinnitus management market over the forecast period. For instance, in Spain there is no public reimbursement available for hearing aids. Irish Republic has a voucher system worth half of the cost of device, however, lack of fully public funded reimbursement policies could hamper growth of the global hearing aids market.
Though, drugs are being used in the treatment of tinnitus, but there are some drugs that can cause drug induced tinnitus. These drugs include antibiotics, anti-depression and anti-anxiety drugs, anti-cancer drugs, antimalarial medications and blood pressure controlling medications to name a few. This can prove to be a major factor restraining the sales of tinnitus management drugs.
Find your sweet spots for generating winning opportunities in this market.
Talk to AnalystWhat is the Impact of the COVID-19 Crisis on the Tinnitus Management Market?
COVID-19 continues its march around the globe, disrupting nearly every dimension of life, from how people socialize to how people seek medical care and perceive the world around them.
As per a study published in the journal of Frontiers in Public Health 2020, it was revealed that 40% of people who had signs of Covid-19 informed about worsening of their tinnitus. A variety of factors increased tinnitus during the pandemic, including health-related concerns, social distancing restrictions, lifestyle changes, and mental health. This has shown a slight rise in the tinnitus management market.
The disruption of supply chain, less demand, slowdowns, staff shortages, restrictions on indoor/outdoor events and lockdown, impacted the overall market growth in all the key regions. However, the tinnitus management market is anticipated to show stable recovery and relative growth in the future.
Country-wise Insights
What Makes the U.S. Tinnitus Management Market Dominant in North America?
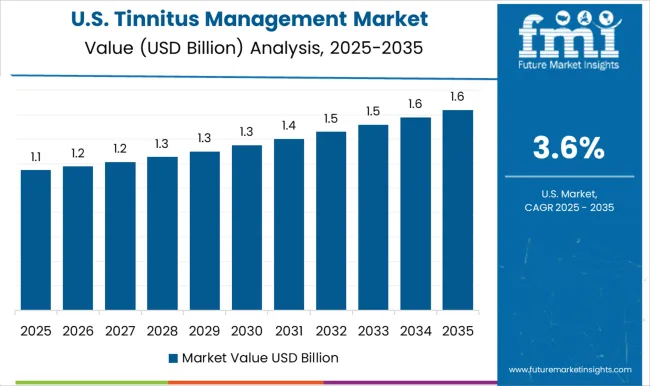
The U.S. is estimated to account for over 96.5% of the North America tinnitus management market in 2021. High occurrence and rise in incidence of tinnitus, rapid surge in number of geriatric population, and high per capita healthcare spending in the country are primary factors that are anticipated to drive the market in U.S. during the forecast period.
In addition, government in the country is adopting various initiatives to standardize tinnitus treatment outcomes. This will help in the growth of the U.S. tinnitus management market.
Why is the U.K. Tinnitus Management Market Considered Lucrative?
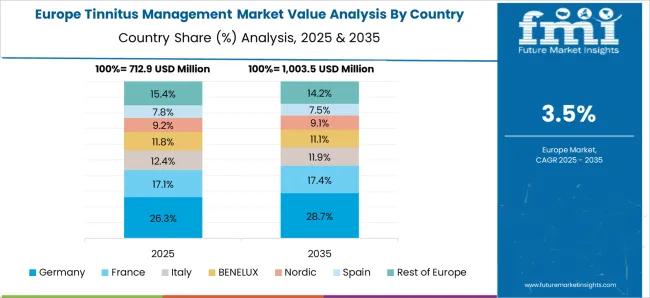
The U.K. is expected to account for 29.4% of the Europe market by 2031. Factors such as technological advancements in medical devices used in tinnitus treatment and favorable government policies to make healthcare better accessible among people are increasing the demand for tinnitus treatment in U.K.
Growing cases of tinnitus and rising awareness regarding smart tinnitus devices is surging the market in U.K. As per the British Tinnitus Association 2017, about 90% of the tinnitus patients have reported some sort of hearing loss.
What are the Factors Driving China Tinnitus management Market?
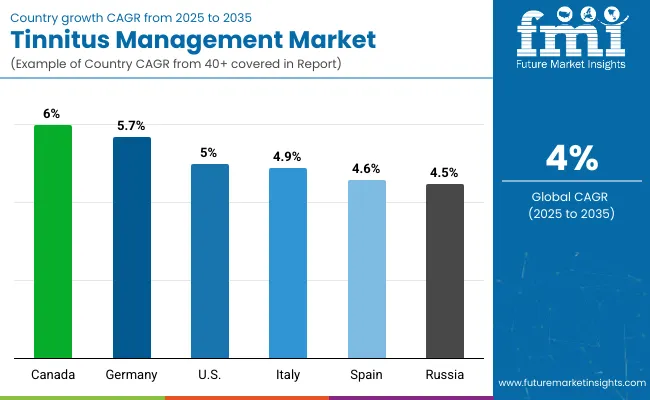
The market for tinnitus management in China is projected to grow at a 3.8% CAGR in East Asia throughout the forecast period. Rapid rise in China’s geriatric population is driving the tinnitus management market.
This is because the incidence of hearing-related concerns is higher in geriatric people. This makes them likelier to use devices to support their hearing function. As per a study conducted by the Chinese Federation of People with Disabilities, around 130 million Chinese experience buzzing or ringing sounds in their ears.
Considering this, the sales of tinnitus management devices and drugs are expected to pick up in China.
How will the India Tinnitus Management Market Fare?
Demand for tinnitus management in India is expected to rise at 3.6% CAGR over the forecast period. Rise in research and development activities in India and rapid growth in medical device technology will aid overall expansion of the market. Besides this, the increasing adoption of novel medical devices for improved healthcare will drive sales of tinnitus management devices in India.

A unified Market Research Subscription Platform, built for today's disparate research needs.
Category-wise Insights
What is Driving Tinnitus Management Devices Sales?
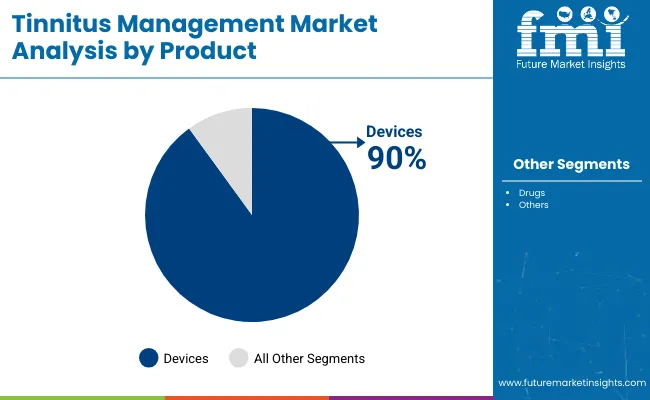
By product, the devices segment is anticipated to hold the maximum share of 93.8% in 2021. The demand for devices over drugs is higher owing to several advantages of devices compared to those of drugs.
The use of medical devices for treatment improves patient communication by decreasing the annoying sensation of voices and sounds caused by tinnitus. It also makes patient less aware about tinnitus. Also, drugs used in tinnitus management has many side effects and hence devices are often preferred for tinnitus treatment and management.
Will Subjective Tinnitus Account for Maximum Sales?
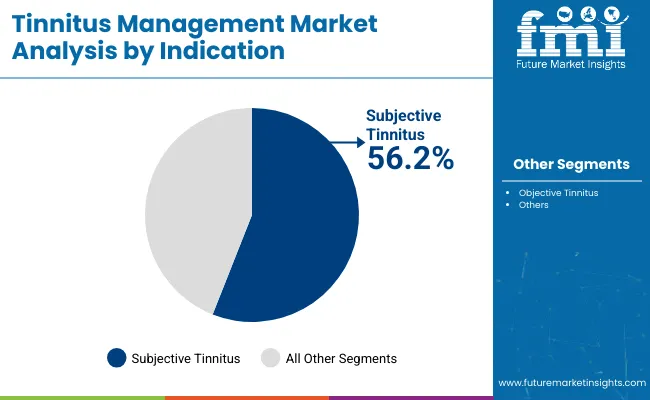
In terms of indication, subjective tinnitus segment in projected to account for 95.6% of the total market share in 2021. The increasing prevalence of subjective tinnitus is the primary factor leading its market share.
Objective tinnitus is much less common than subjective tinnitus, and 99% of tinnitus cases reported are of subjective tinnitus.
Which Distribution Channel is More Preferred in Tinnitus Management Market?
By distribution channel, audiology centers and ENT clinics together hold over 60% of the market in 2021 and this trend is expected to continue during the forecast period as well.
Tinnitus is a disease where one experiences ringing or other sounds in one or both of his/ her ears. While there is no cure for tinnitus, specialist such as otolaryngologist that is ENT specialist can help a patient in regaining the quality of life. Hence, the demand from ENT clinics and audiology centers are increasing.
Competitive Landscape
Companies operating in the tinnitus management market are actively seeking to strengthen their position through approval, collaborations, merge & acquisition and partnership agreements with established as well as emerging market players.
For instance:
- In August 2021, Hearing aid innovator Signia today announced the launch of its Augmented Xperience (AX) hearing aid platform that intelligently and automatically processes sound to better ensure that listeners always hear clearly – regardless of the listening environment.
- In November 2020, Oticon announced the launch of the new, revolutionary Oticon More™ hearing aids. Oticon More is the world’s first hearing aid to let you hear all you need thanks to a Deep Neural Network (DNN) which supports your brain to work in the most natural and effective way.
- In January 2019, Takeda Pharmaceutical Company acquired Shire plc. With this Acquisition, Takeda strengthened its geographic presence in the U.S., which is one of the key market for biopharmaceuticals. Also, the acquisition of Shire strengthen our product offerings and provide leading position in GI, Neuroscience, rare diseases, oncology and PDT.
Scope of the Report
Attribute |
Details |
Forecast Period |
2021-2031 |
Historical Data Available for |
2016-2020 |
Market Analysis |
USD Million for Value and Volume (Units). |
Key Countries Covered |
US, Canada, Germany, U.K., France, Italy, Spain, BENELUX, Russia, China, Japan, South Korea, India, Thailand, Malaysia, Indonesia, Australia, New Zealand, GCC Countries, Turkey, South Africa |
Key Segments Covered |
Product, Indication, Distribution Channel and Region |
Key Companies Profiled |
|
Report Coverage |
Market Forecast, Competition Intelligence, DROT Analysis, Market Dynamics and Challenges, Strategic Growth Initiatives |
Customization & Pricing |
Available upon Request |
Tinnitus Management Market by Category
By Product:
- Devices
- Sound Masking Devices
- Notched Music Devices
- Hearing Aids
- Drugs
- Tricyclic Antidepressants
- Antianxiety
- Anticonvulsants
By Indication:
- Subjective Tinnitus
- Objective Tinnitus
By Distribution Channel:
- Audiology Centers
- ENT Clinics
- Hospitals
- E-Commerce
By Region:
- North America
- Latin America
- Europe
- East Asia
- South Asia
- Oceania
- Middle East and Africa (MEA)
Frequently Asked Questions
What is tinnitus management market demand outlook?
The global market for tinnitus management is projected to grow at a CAGR of 2.8% between 2021 and 2031 owing to the rising prevalence of tinnitus and technological advancement in hearing devices.
Which is the most lucrative tinnitus management market?
North America currently holds the largest share in the tinnitus management market. It is expected to account for 52.7% of the global market share in 2021.
At what rate will the India tinnitus management market grow?
The tinnitus management in India is likely to grow at a CAGR of 3.6% during the forecast period.
What are key trends driving sales of tinnitus management devices and drugs?
Significant shift in patient preference towards innovative and advanced technologies such as mobile apps and other hearing aids accessories, increase in R&D activities for development of new products, and strategies such as mergers and acquisitions adopted by manufacturers are key trends driving sales of tinnitus management devices across the globe.
What will South Korea and Japan tinnitus management market fare?
The South Korea tinnitus management market will exhibit 3.0% CAGR between 2021 and 2031. The Japan market expected to exhibit growth at 3.4% CAGR during the forecast period.
Whicht are the top 5 countries driving demand for tinnitus management?
The U.S., U. K., China, Germany and Japan are the top 5 countries that are driving the demand for tinnitus management.
Which are leading companies in the tinnitus management market?
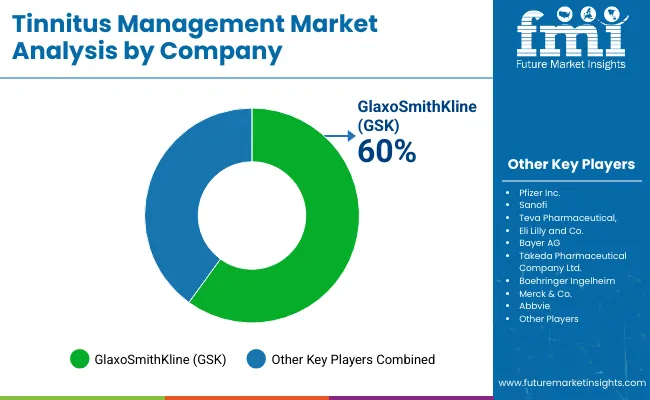
Leading companies in the market are Signia, Starkey Hearing Technologies, Inc., GN Hearing A/S, Widex A/S, Oticon Inc., Neuromod Devices Ltd., Neuromonics Inc., Puretone, Inc., Pfizer Inc., Sanofi and GlaxoSmithKline.
Table of Content
1. Executive Summary 1.1. Global Market Outlook 1.2. Demand Side Trends 1.3. Supply Side Trends 1.4. Analysis and Recommendations 2. Market Overview 2.1. Market Coverage / Taxonomy 2.2. Market Definition / Scope / Limitations 3. Key Market Trends 3.1. Key Trends Impacting the Market 3.2. Tinnitus Management Product Types Innovation / Key Development Trends 3.3. New Launches / Procedures/Patents 4. Market Background 4.1. Macro-Economic Factors 4.1.1. Global GDP Growth Outlook 4.1.2. Global Healthcare Expenditure Outlook 4.1.3. Emerging Countries Healthcare and Development Outlook 4.2. Forecast Factors - Relevance & Impact 4.2.1. Adoption of Device Product 4.2.2. Prevalence of Tinnitus 4.2.3. Reimbursement scenario 4.2.4. Expansion by leading manufacturer in emerging geographies 4.3. Market Dynamics 4.3.1. Drivers 4.3.2. Restraints 4.4. Opportunity Analysis 5. Market Context 5.1. List of Manufacturer and Supplier 5.2. Usage/ Adoption Analysis 5.3. Disease Epidemiology 5.4. Promotional Strategies by Key Manufacturer 5.5. List of FDA approved Tinnitus Management Devices 6. COVID19 Crisis Analysis 6.1. Current COVID19 Statistics and Probable Future Impact 6.2. Current GDP Projection and Probable Impact 6.3. Current Economic Projection as compared t2008 financial analysis 6.4. COVID19 and Impact Analysis 6.4.1. Revenue By Product Type 6.4.2. Revenue By Country 6.5. 2021 Market Scenario 6.6. Quarter by Quarter Forecast 6.7. Projected recovery Quarter 6.8. Recovery Scenario– Short term, Midterm and Long Term Impact 7. Tinnitus Management Market -Pricing Analysis 7.1. Regional Pricing Analysis By Indication 7.2. Pricing Break-up 7.2.1. Manufacturer Level Pricing 7.2.2. Distributor Level Pricing 7.3. Average Pricing Analysis Benchmark 8. Global Tinnitus Management Market Volume (‘000) Units Analysis 2016-2020 and Forecast, 2021-2031 8.1. Historical Market Volume (‘000) Units Analysis, 2016-2020 8.2. Current and Future Market Volume (‘000) Units Projections, 2021-2031 8.2.1. Y-o-Y Growth Trend Analysis 8.3. Absolute $ Opportunity Analysis 9. Global Tinnitus Management Market Value (US$ Mn) Analysis 2016-2020 and Forecast, 2021-2031 9.1. Historical Market Value (US$ Mn) Analysis, 2016-2020 9.2. Current and Future Market Value (US$ Mn) Projections, 2021-2031 9.2.1. Y-o-Y Growth Trend Analysis 9.2.2. Absolute $ Opportunity Analysis 10. Global Tinnitus Management Market Analysis 2016-2020 and Forecast 2021-2031, by Product Type 10.1. Introduction / Key Findings 10.2. Historical Market Size (US$ Mn) Analysis, By Product Type, 2016 - 2020 10.3. Current and Future Market Size (US$ Mn) Analysis and Forecast By Product Type, 2021 - 2031 10.3.1. Devices 10.3.1.1. Sound Masking Devices 10.3.1.2. Notched Music Devices 10.3.1.3. Hearing Aids 10.3.2. Drugs 10.3.2.1. Tricyclic Antidepressants 10.3.2.2. Antianxiety 10.3.2.3. Anticonvulsants 10.4. Market Attractiveness Analysis By Product Type 11. Global Tinnitus Management Market Analysis 2016-2020 and Forecast 2021-2031, by Indication 11.1. Introduction / Key Findings 11.2. Historical Market Size (US$ Mn) Analysis, By Indication, 2016 - 2020 11.3. Current and Future Market Size (US$ Mn) Analysis and Forecast By Indication, 2021 - 2031 11.3.1. Subjective Tinnitus 11.3.2. Objective Tinnitus 11.3.3. Market Attractiveness Analysis By Indication 12. Global Tinnitus Management Market Analysis 2016-2020 and Forecast 2021-2031, by Distribution Channel 12.1. Introduction / Key Findings 12.2. Historical Market Size (US$ Mn) Analysis By Distribution Channel, 2016 - 2020 12.3. Current and Future Market Size (US$ Mn) Analysis and Forecast By Distribution Channel, 2021 - 2031 12.3.1. Audiology Centers 12.3.2. ENT Clinics 12.3.3. Hospitals 12.3.4. E-Commerce 12.4. Market Attractiveness Analysis By Distribution Channel 13. Global Tinnitus Management Market Analysis 2016-2020 and Forecast 2021-2031, by Region 13.1. Introduction 13.2. Historical Market Size (US$ Mn) Analysis By Region, 2016 - 2020 13.3. Current Market Size (US$ Mn) Analysis and Forecast By Region, 2021 - 2031 13.3.1. North America 13.3.2. Latin America 13.3.3. Europe 13.3.4. South Asia 13.3.5. East Asia 13.3.6. Oceania 13.3.7. Middle East and Africa (MEA) 13.4. Market Attractiveness Analysis By Region 14. North America Tinnitus Management Market Analysis 2016-2020 and Forecast 2021-2031 14.1. Introduction 14.2. Historical Market Size (US$ Mn) Trend Analysis By Market Taxonomy, 2016 - 2020 14.3. Market Size (US$ Mn) Forecast By Market Taxonomy, 2021 - 2031 14.3.1. By Country 14.3.1.1. U.S. 14.3.1.2. Canada 14.3.2. By Product Type 14.3.3. By Indication 14.3.4. By Distribution Channel 14.4. Market Attractiveness Analysis 14.5. Key Market Participants - Intensity Mapping 14.6. Drivers and Restraints - Impact Analysis 15. Latin America Tinnitus Management Market Analysis 2016-2020 and Forecast 2021-2031 15.1. Introduction 15.2. Historical Market Size (US$ Mn) Trend Analysis By Market Taxonomy, 2016 - 2020 15.3. Market Size (US$ Mn) Forecast By Market Taxonomy, 2021 - 2031 15.3.1. By Country 15.3.1.1. Brazil 15.3.1.2. Mexico 15.3.1.3. Argentina 15.3.1.4. Rest of Latin America 15.3.2. By Product Type 15.3.3. By Indication 15.3.4. By Distribution Channel 15.4. Market Attractiveness Analysis 15.5. Market Trends 15.6. Key Market Participants - Intensity Mapping 15.7. Drivers and Restraints - Impact Analysis 16. Europe Tinnitus Management Market Analysis 2016-2020 and Forecast 2021-2031 16.1. Introduction 16.2. Historical Market Size (US$ Mn) Trend Analysis By Market Taxonomy, 2016 - 2020 16.3. Market Size (US$ Mn) Forecast By Market Taxonomy, 2021 - 2031 16.3.1. By Country 16.3.1.1. U.K. 16.3.1.2. Germany 16.3.1.3. France 16.3.1.4. Italy 16.3.1.5. Spain 16.3.1.6. Russia 16.3.1.7. BENELUX 16.3.1.8. Rest of Europe 16.3.2. By Product Type 16.3.3. By Indication 16.3.4. By Distribution Channel 16.4. Market Attractiveness Analysis 16.5. Key Market Participants - Intensity Mapping 16.6. Drivers and Restraints - Impact Analysis 17. South Asia Tinnitus Management Market Analysis 2016-2020 and Forecast 2021-2031 17.1. Introduction 17.2. Historical Market Size (US$ Mn) Trend Analysis By Market Taxonomy, 2016 - 2020 17.3. Market Size (US$ Mn) Forecast By Market Taxonomy, 2021 - 2031 17.3.1. By Country 17.3.1.1. India 17.3.1.2. Thailand 17.3.1.3. Indonesia 17.3.1.4. Malaysia 17.3.1.5. Rest of South Asia 17.3.2. By Product Type 17.3.3. By Indication 17.3.4. By Distribution Channel 17.4. Market Attractiveness Analysis 17.5. Key Market Participants - Intensity Mapping 17.6. Drivers and Restraints - Impact Analysis 18. East Asia Tinnitus Management Market Analysis 2016-2020 and Forecast 2021-2031 18.1. Introduction 18.2. Historical Market Size (US$ Mn) Trend Analysis By Market Taxonomy, 2016 - 2020 18.3. Market Size (US$ Mn) Forecast By Market Taxonomy, 2021 - 2031 18.3.1. By Country 18.3.1.1. China 18.3.1.2. Japan 18.3.1.3. South Korea 18.3.1.4. Rest of East Asia 18.3.2. By Product Type 18.3.3. By Indication 18.3.4. By Distribution Channel 18.4. Market Attractiveness Analysis 18.5. Key Market Participants - Intensity Mapping 18.6. Drivers and Restraints - Impact Analysis 19. Oceania Tinnitus Management Market Analysis 2016-2020 and Forecast 2021-2031 19.1. Introduction 19.2. Historical Market Size (US$ Mn) Trend Analysis By Market Taxonomy, 2016 - 2020 19.3. Market Size (US$ Mn) Forecast By Market Taxonomy, 2021 - 2031 19.3.1. By Country 19.3.1.1. Australia 19.3.1.2. New Zealand 19.3.2. By Product Type 19.3.3. By Indication 19.3.4. By Distribution Channel 19.4. Market Attractiveness Analysis 19.5. Key Market Participants - Intensity Mapping 19.6. Drivers and Restraints - Impact Analysis 20. Middle East and Africa Tinnitus Management Market Analysis 2016-2020 and Forecast 2021-2031 20.1. Introduction 20.2. Historical Market Size (US$ Mn) Trend Analysis By Market Taxonomy, 2016 - 2020 20.3. Market Size (US$ Mn) Forecast By Market Taxonomy, 2021 - 2031 20.3.1. By Country 20.3.1.1. GCC Countries 20.3.1.2. Turkey 20.3.1.3. Northern Africa 20.3.1.4. South Africa 20.3.1.5. Rest of Middle East and Africa 20.3.2. By Product Type 20.3.3. By Indication 20.3.4. By Distribution Channel 20.4. Market Attractiveness Analysis 20.5. Key Market Participants - Intensity Mapping 20.6. Drivers and Restraints - Impact Analysis 21. Emerging Countries Tinnitus Management Market Analysis 2016-2020 and Forecast 2021-2031 21.1. Introduction 21.1.1. Market Value Proportion Analysis, By Key Countries 21.1.2. Global Vs. Country Growth Comparison 21.2. U.S. Tinnitus Management Market Analysis 21.2.1. By Product Type 21.2.2. By Indication 21.2.3. By Distribution Channel 21.3. Canada Tinnitus Management Market Analysis 21.3.1. By Product Type 21.3.2. By Indication 21.3.3. By Distribution Channel 21.4. Mexico Tinnitus Management Market Analysis 21.4.1. By Product Type 21.4.2. By Indication 21.4.3. By Distribution Channel 21.5. Brazil Tinnitus Management Market Analysis 21.5.1. By Product Type 21.5.2. By Indication 21.5.3. By Distribution Channel 21.6. U.K. Tinnitus Management Market Analysis 21.6.1. By Product Type 21.6.2. By Indication 21.6.3. By Distribution Channel 21.7. Germany Tinnitus Management Market Analysis 21.7.1. By Product Type 21.7.2. By Indication 21.7.3. By Distribution Channel 21.8. France Tinnitus Management Market Analysis 21.8.1. By Product Type 21.8.2. By Indication 21.8.3. By Distribution Channel 21.9. Italy Tinnitus Management Market Analysis 21.9.1. By Product Type 21.9.2. By Indication 21.9.3. By Distribution Channel 21.10. Spain Tinnitus Management Market Analysis 21.10.1. By Product Type 21.10.2. By Indication 21.10.3. By Distribution Channel 21.11. BENELUX Tinnitus Management Market Analysis 21.11.1. By Product Type 21.11.2. By Indication 21.11.3. By Distribution Channel 21.12. Russia Tinnitus Management Market Analysis 21.12.1. By Product Type 21.12.2. By Indication 21.12.3. By Distribution Channel 21.13. China Tinnitus Management Market Analysis 21.13.1. By Product Type 21.13.2. By Indication 21.13.3. By Distribution Channel 21.14. Japan Tinnitus Management Market Analysis 21.14.1. By Product Type 21.14.2. By Indication 21.14.3. By Distribution Channel 21.15. South Korea Tinnitus Management Market Analysis 21.15.1. By Product Type 21.15.2. By Indication 21.15.3. By Distribution Channel 21.16. India Tinnitus Management Market Analysis 21.16.1. By Product Type 21.16.2. By Indication 21.16.3. By Distribution Channel 21.17. ASEAN Tinnitus Management Market Analysis 21.17.1. By Product Type 21.17.2. By Indication 21.17.3. By Distribution Channel 21.18. Australia Tinnitus Management Market Analysis 21.18.1. By Product Type 21.18.2. By Indication 21.18.3. By Distribution Channel 21.19. New Zealand Tinnitus Management Market Analysis 21.19.1. By Product Type 21.19.2. By Indication 21.19.3. By Distribution Channel 21.20. GCC Countries Tinnitus Management Market Analysis 21.20.1. By Product Type 21.20.2. By Indication 21.20.3. By Distribution Channel 21.21. Turkey Tinnitus Management Market Analysis 21.21.1. By Product Type 21.21.2. By Indication 21.21.3. By Distribution Channel 21.22. South Africa Tinnitus Management Market Analysis 21.22.1. By Product Type 21.22.2. By Indication 21.22.3. By Distribution Channel 22. Market Structure Analysis 22.1. Market Analysis by Tier of Companies 22.2. Market Share Analysis of Top Players 23. Competition Analysis 23.1. Competition Dashboard 23.2. Competition Benchmarking 23.3. Competition Deep Dive 23.3.1. Pfizer Inc. 23.3.1.1. Overview 23.3.1.2. Product Type Portfolio 23.3.1.3. Analyst Commentary 23.3.1.4. Key Financials 23.3.1.5. Recent Developments 23.3.1.6. Sales Footprint 23.3.1.7. Strategy Overview 23.3.1.7.1. Marketing Strategy 23.3.1.7.2. Product Type Strategy 23.3.1.7.3. Channel Strategy 23.3.2. Sanofi 23.3.2.1. Overview 23.3.2.2. Product Type Portfolio 23.3.2.3. Analyst Commentary 23.3.2.4. Key Financials 23.3.2.5. Recent Developments 23.3.2.6. Sales Footprint 23.3.2.7. Strategy Overview 23.3.2.7.1. Marketing Strategy 23.3.2.7.2. Product Type Strategy 23.3.2.7.3. Channel Strategy 23.3.3. Teva Pharmaceutical 23.3.3.1. Overview 23.3.3.2. Product Type Portfolio 23.3.3.3. Analyst Commentary 23.3.3.4. Key Financials 23.3.3.5. Recent Developments 23.3.3.6. Sales Footprint 23.3.3.7. Strategy Overview 23.3.3.7.1. Marketing Strategy 23.3.3.7.2. Product Type Strategy 23.3.3.7.3. Channel Strategy 23.3.4. GlaxoSmithKline 23.3.4.1. Overview 23.3.4.2. Product Type Portfolio 23.3.4.3. Analyst Commentary 23.3.4.4. Key Financials 23.3.4.5. Recent Developments 23.3.4.6. Sales Footprint 23.3.4.7. Strategy Overview 23.3.4.7.1. Marketing Strategy 23.3.4.7.2. Product Type Strategy 23.3.4.7.3. Channel Strategy 23.3.5. Eli Lilly and Co. 23.3.5.1. Overview 23.3.5.2. Product Type Portfolio 23.3.5.3. Analyst Commentary 23.3.5.4. Key Financials 23.3.5.5. Recent Developments 23.3.5.6. Sales Footprint 23.3.5.7. Strategy Overview 23.3.5.7.1. Marketing Strategy 23.3.5.7.2. Product Type Strategy 23.3.5.7.3. Channel Strategy 23.3.6. Bayer AG 23.3.6.1. Overview 23.3.6.2. Product Type Portfolio 23.3.6.3. Analyst Commentary 23.3.6.4. Key Financials 23.3.6.5. Recent Developments 23.3.6.6. Sales Footprint 23.3.6.7. Strategy Overview 23.3.6.7.1. Marketing Strategy 23.3.6.7.2. Product Type Strategy 23.3.6.7.3. Channel Strategy 23.3.7. Takeda Pharmaceutical Company Ltd. 23.3.7.1. Overview 23.3.7.2. Product Type Portfolio 23.3.7.3. Analyst Commentary 23.3.7.4. Key Financials 23.3.7.5. Recent Developments 23.3.7.6. Sales Footprint 23.3.7.7. Strategy Overview 23.3.7.7.1. Marketing Strategy 23.3.7.7.2. Product Type Strategy 23.3.7.7.3. Channel Strategy 23.3.8. Boehringer Ingelheim 23.3.8.1. Overview 23.3.8.2. Product Type Portfolio 23.3.8.3. Analyst Commentary 23.3.8.4. Key Financials 23.3.8.5. Recent Developments 23.3.8.6. Sales Footprint 23.3.8.7. Strategy Overview 23.3.8.7.1. Marketing Strategy 23.3.8.7.2. Product Type Strategy 23.3.8.7.3. Channel Strategy 23.3.9. Merck & Co. 23.3.9.1. Overview 23.3.9.2. Product Type Portfolio 23.3.9.3. Analyst Commentary 23.3.9.4. Key Financials 23.3.9.5. Recent Developments 23.3.9.6. Sales Footprint 23.3.9.7. Strategy Overview 23.3.9.7.1. Marketing Strategy 23.3.9.7.2. Product Type Strategy 23.3.9.7.3. Channel Strategy 23.3.10. Abbivie 23.3.10.1. Overview 23.3.10.2. Product Type Portfolio 23.3.10.3. Analyst Commentary 23.3.10.4. Key Financials 23.3.10.5. Recent Developments 23.3.10.6. Sales Footprint 23.3.10.7. Strategy Overview 23.3.10.7.1. Marketing Strategy 23.3.10.7.2. Product Type Strategy 23.3.10.7.3. Channel Strategy 23.3.11. Starkey Laboratories, Inc. 23.3.11.1. Overview 23.3.11.2. Product Type Portfolio 23.3.11.3. Analyst Commentary 23.3.11.4. Key Financials 23.3.11.5. Recent Developments 23.3.11.6. Sales Footprint 23.3.11.7. Strategy Overview 23.3.11.7.1. Marketing Strategy 23.3.11.7.2. Product Type Strategy 23.3.11.7.3. Channel Strategy 23.3.12. GN Hearing A/S 23.3.12.1. Overview 23.3.12.2. Product Type Portfolio 23.3.12.3. Analyst Commentary 23.3.12.4. Key Financials 23.3.12.5. Recent Developments 23.3.12.6. Sales Footprint 23.3.12.7. Strategy Overview 23.3.12.7.1. Marketing Strategy 23.3.12.7.2. Product Type Strategy 23.3.12.7.3. Channel Strategy 23.3.13. Widex A/S 23.3.13.1. Overview 23.3.13.2. Product Type Portfolio 23.3.13.3. Analyst Commentary 23.3.13.4. Key Financials 23.3.13.5. Recent Developments 23.3.13.6. Sales Footprint 23.3.13.7. Strategy Overview 23.3.13.7.1. Marketing Strategy 23.3.13.7.2. Product Type Strategy 23.3.13.7.3. Channel Strategy 23.3.14. Oticon Inc. 23.3.14.1. Overview 23.3.14.2. Product Type Portfolio 23.3.14.3. Analyst Commentary 23.3.14.4. Key Financials 23.3.14.5. Recent Developments 23.3.14.6. Sales Footprint 23.3.14.7. Strategy Overview 23.3.14.7.1. Marketing Strategy 23.3.14.7.2. Product Type Strategy 23.3.14.7.3. Channel Strategy 23.3.15. Neuromod Devices Ltd. 23.3.15.1. Overview 23.3.15.2. Product Type Portfolio 23.3.15.3. Analyst Commentary 23.3.15.4. Key Financials 23.3.15.5. Recent Developments 23.3.15.6. Sales Footprint 23.3.15.7. Strategy Overview 23.3.15.7.1. Marketing Strategy 23.3.15.7.2. Product Type Strategy 23.3.15.7.3. Channel Strategy 23.3.16. Neuromonics, Inc. 23.3.16.1. Overview 23.3.16.2. Product Type Portfolio 23.3.16.3. Analyst Commentary 23.3.16.4. Key Financials 23.3.16.5. Recent Developments 23.3.16.6. Sales Footprint 23.3.16.7. Strategy Overview 23.3.16.7.1. Marketing Strategy 23.3.16.7.2. Product Type Strategy 23.3.16.7.3. Channel Strategy 23.3.17. Puretone Ltd. 23.3.17.1. Overview 23.3.17.2. Product Type Portfolio 23.3.17.3. Analyst Commentary 23.3.17.4. Key Financials 23.3.17.5. Recent Developments 23.3.17.6. Sales Footprint 23.3.17.7. Strategy Overview 23.3.17.7.1. Marketing Strategy 23.3.17.7.2. Product Type Strategy 23.3.17.7.3. Channel Strategy 23.3.18. Signia 23.3.18.1. Overview 23.3.18.2. Product Type Portfolio 23.3.18.3. Analyst Commentary 23.3.18.4. Key Financials 23.3.18.5. Recent Developments 23.3.18.6. Sales Footprint 23.3.18.7. Strategy Overview 23.3.18.7.1. Marketing Strategy 23.3.18.7.2. Product Type Strategy 23.3.18.7.3. Channel Strategy 24. Assumptions and Acronyms Used 25. Research Methodology
Let us know your requirement to get
100% FREE customization
List of Tables
Table 01: Global Tinnitus Management Market Volume (Units) Analysis 2016-2020 and Forecast 2021-2031, By Product Type Table 02: Global Tinnitus Management Market Volume (Units) Analysis 2016-2020 and Forecast 2021-2031, By Region Table 03: Global Tinnitus Management Market Value (US$ Mn) Analysis 2016-2020 and Forecast 2021-2031, By Product Type Table 04: Global Tinnitus Management Market Volume (Units) Analysis 2016-2020 and Forecast 2021-2031, By Product Type Table 05: Global Tinnitus Management Market Value (US$ Mn) Analysis 2016-2020 and Forecast 2021-2031, By Indication Table 06: Global Tinnitus Management Market Value (US$ Mn) Analysis 2016-2020 and Forecast 2021-2031, By Distribution Channel Table 07: Global Tinnitus Management Market Value (US$ Mn) Analysis 2016-2020 and Forecast 2021-2031, By Region Table 08: North America Tinnitus Management Market Value (US$ Mn) Analysis 2016-2020 and Forecast 2021-2031, By Country Table 09: North America Tinnitus Management Market Value (US$ Mn) Analysis 2016-2020 and Forecast 2021-2031, By Product Type Table 10: North America Tinnitus Management Market Volume (Units) Analysis 2016-2020 and Forecast 2021-2031, By Product Type Table 11: North America Tinnitus Management Market Value (US$ Mn) Analysis 2016-2020 and Forecast 2021-2031, By Indication Table 12: North America Tinnitus Management Market Value (US$ Mn) Analysis 2016-2020 and Forecast 2021-2031, By Distribution Channel Table 13: Latin America Tinnitus Management Market Value (US$ Mn) Analysis 2016-2020 and Forecast 2021-2031, By Country Table 14: Latin America Tinnitus Management Market Value (US$ Mn) Analysis 2016-2020 and Forecast 2021-2031, By Product Type Table 15: Latin America Tinnitus Management Market Volume (Units) Analysis 2016-2020 and Forecast 2021-2031, By Product Type Table 16: Latin America Tinnitus Management Market Value (US$ Mn) Analysis 2016-2020 and Forecast 2021-2031, By Indication Table 17: Latin America Tinnitus Management Market Value (US$ Mn) Analysis 2016-2020 and Forecast 2021-2031, By Distribution Channel Table 18: Europe Tinnitus Management Market Value (US$ Mn) Analysis 2016-2020 and Forecast 2021-2031, By Country Table 19: Europe Tinnitus Management Market Value (US$ Mn) Analysis 2016-2020 and Forecast 2021-2031, By Product Type Table 20: Europe Tinnitus Management Market Volume (Units) Analysis 2016-2020 and Forecast 2021-2031, By Product Type Table 21: Europe Tinnitus Management Market Value (US$ Mn) Analysis 2016-2020 and Forecast 2021-2031, By Indication Table 22: Europe Tinnitus Management Market Value (US$ Mn) Analysis 2016-2020 and Forecast 2021-2031, By Distribution Channel Table 23: South Asia Tinnitus Management Market Value (US$ Mn) Analysis 2016-2020 and Forecast 2021-2031, By Country Table 24: South Asia Tinnitus Management Market Value (US$ Mn) Analysis 2016-2020 and Forecast 2021-2031, By Product Type Table 25: South Asia Tinnitus Management Market Volume (Units) Analysis 2016-2020 and Forecast 2021-2031, By Product Type Table 26: South Asia Tinnitus Management Market Value (US$ Mn) Analysis 2016-2020 and Forecast 2021-2031, By Indication Table 27: South Asia Tinnitus Management Market Value (US$ Mn) Analysis 2016-2020 and Forecast 2021-2031, By Distribution Channel Table 28: East Asia Tinnitus Management Market Value (US$ Mn) Analysis 2016-2020 and Forecast 2021-2031, By Country Table 29: East Asia Tinnitus Management Market Value (US$ Mn) Analysis 2016-2020 and Forecast 2021-2031, By Product Type Table 30: East Asia Tinnitus Management Market Volume (Units) Analysis 2016-2020 and Forecast 2021-2031, By Product Type Table 31: East Asia Tinnitus Management Market Value (US$ Mn) Analysis 2016-2020 and Forecast 2021-2031, By Indication Table 32: East Asia Tinnitus Management Market Value (US$ Mn) Analysis 2016-2020 and Forecast 2021-2031, By Distribution Channel Table 33: Oceania Tinnitus Management Market Value (US$ Mn) Analysis 2016-2020 and Forecast 2021-2031, By Country Table 34: Oceania Tinnitus Management Market Value (US$ Mn) Analysis 2016-2020 and Forecast 2021-2031, By Product Type Table 35: Oceania Tinnitus Management Market Volume (Units) Analysis 2016-2020 and Forecast 2021-2031, By Product Type Table 36: Oceania Tinnitus Management Market Value (US$ Mn) Analysis 2016-2020 and Forecast 2021-2031, By Indication Table 37: Oceania Tinnitus Management Market Value (US$ Mn) Analysis 2016-2020 and Forecast 2021-2031, By Distribution Channel Table 38: MEA Tinnitus Management Market Value (US$ Mn) Analysis 2016-2020 and Forecast 2021-2031, By Country Table 39: MEA Tinnitus Management Market Value (US$ Mn) Analysis 2016-2020 and Forecast 2021-2031, By Product Type Table 40: MEA Tinnitus Management Market Volume (Units) Analysis 2016-2020 and Forecast 2021-2031, By Product Type Table 41: MEA Tinnitus Management Market Value (US$ Mn) Analysis 2016-2020 and Forecast 2021-2031, By Indication Table 42: MEA Tinnitus Management Market Value (US$ Mn) Analysis 2016-2020 and Forecast 2021-2031, By Distribution Channel
Find your sweet spots for generating winning opportunities in this market.
Talk to AnalystList of Charts
Figure 01: Global Tinnitus Management Market Revenue Share, By Product Type (2021E) Figure 02: Global Tinnitus Management Market Revenue Share, By Indication (2021E) Figure 03: Global Tinnitus Management Market Revenue Share, By Distribution Channel (2021E) Figure 04: Global Average Pricing Analysis Benchmark USD (2020) Figure 05: Global Tinnitus Management Market: Sound Masking Devices, Notched Music Devices and Hearing Aids, Price Difference (US$) By Region, 2031 Figure 06: Global Tinnitus Management Historical Volume (Units) Analysis, 2016-2020 Figure 07: Global Tinnitus Management Market Volume (Units) & Y-o-Y Growth (%), 2021-2031 Figure 08: Global Tinnitus Management Historical Market (US$ Mn) Analysis, 2016-2020 Figure 09: Global Tinnitus Management Market Value (US$) & Y-o-Y Growth (%), 2021-2031 Figure 10: Global Tinnitus Management Market Absolute $ Opportunity, 2020-2031 Figure 11: Global Tinnitus Management Market Share Analysis (%) By Product Type, 2021 & 2031 Figure 12: Global Tinnitus Management Market Y-o-Y Growth (%) By Product Type, 2021–2031 Figure 13: Global Tinnitus Management Market Attractiveness Analysis By Product Type Figure 14: Global Tinnitus Management Market Share Analysis (%) By Indication, 2021 & 2031 Figure 15: Global Tinnitus Management Market Y-o-Y Growth (%) By Indication, 2021–2031 Figure 16: Global Tinnitus Management Market Attractiveness Analysis By Indication Figure 17: Global Tinnitus Management Market Share Analysis (%) By Distribution Channel, 2021 & 2031 Figure 18: Global Tinnitus Management Market Y-o-Y Growth (%) By Distribution Channel, 2021–2031 Figure 19: Global Tinnitus Management Market Attractiveness Analysis By Distribution Channel Figure 20: Global Tinnitus Management Market Share Analysis (%) By Region, 2021 & 2031 Figure 21: Global Tinnitus Management Market Y-o-Y Growth (%) By Region, 2021–2031 Figure 22: Global Tinnitus Management Market Attractiveness Analysis By Region Figure 23: North America Tinnitus Management Market Value Share, By Product Type (2021 E) Figure 24: North America Tinnitus Management Market Value Share, By Indication (2021 E) Figure 25: North America Tinnitus Management Market Value Share, By Distribution Channel (2021 E) Figure 26: North America Tinnitus Management Market Value Share, By Country (2021 E) Figure 27: North America Tinnitus Management Market Value (US$ Mn) Analysis, 2016–2020 Figure 28: North America Tinnitus Management Market Size (US$ Mn) & Y-o-Y Growth (%), 2021–2031 Figure 29: North America Tinnitus Management Market Attractiveness Analysis, By Country Figure 30: North America Tinnitus Management Market Attractiveness Analysis, By Product Type Figure 31: North America Tinnitus Management Market Attractiveness Analysis, By Indication Figure 32: North America Tinnitus Management Market Attractiveness Analysis, By Distribution Channel Figure 33: Latin America Tinnitus Management Market Value Share, By Product Type (2021 E) Figure 34: Latin America Tinnitus Management Market Value Share, By Indication (2021 E) Figure 35: Latin America Tinnitus Management Market Value Share, By Distribution Channel (2021 E) Figure 36: Latin America Tinnitus Management Market Value Share, By Country (2021 E) Figure 37: Latin America Tinnitus Management Market Value (US$ Mn) Analysis, 2016–2020 Figure 38: Latin America Tinnitus Management Market Size (US$ Mn) & Y-o-Y Growth (%), 2021–2031 Figure 39: Latin America Tinnitus Management Market Attractiveness Analysis, By Country Figure 40: Latin America Tinnitus Management Market Attractiveness Analysis, By Product Type Figure 41: Latin America Tinnitus Management Market Attractiveness Analysis, By Indication Figure 42: Latin America Tinnitus Management Market Attractiveness Analysis, By Distribution Channel Figure 43: Europe Tinnitus Management Market Value Share, By Product Type (2021 E) Figure 44: Europe Tinnitus Management Market Value Share, By Indication (2021 E) Figure 45: Europe Tinnitus Management Market Value Share, By Distribution Channel (2021 E) Figure 46: Europe Tinnitus Management Market Value Share, By Country (2021 E) Figure 47: Europe Tinnitus Management Market Value (US$ Mn) Analysis, 2016–2020 Figure 48: Europe Tinnitus Management Market Size (US$ Mn) & Y-o-Y Growth (%), 2021–2031 Figure 49: Europe Tinnitus Management Market Attractiveness Analysis, By Country Figure 50: Europe Tinnitus Management Market Attractiveness Analysis, By Product Type Figure 51: Europe Tinnitus Management Market Attractiveness Analysis, By Indication Figure 52: Europe Tinnitus Management Market Attractiveness Analysis, By Distribution Channel Figure 53: South Asia Tinnitus Management Market Value Share, By Product Type (2021 E) Figure 54: South Asia Tinnitus Management Market Value Share, By Indication (2021 E) Figure 55: South Asia Tinnitus Management Market Value Share, By Distribution Channel (2021 E) Figure 56: South Asia Tinnitus Management Market Value Share, By Country (2021 E) Figure 57: South Asia Tinnitus Management Market Value (US$ Mn) Analysis, 2016–2020 Figure 58: South Asia Tinnitus Management Market Size (US$ Mn) & Y-o-Y Growth (%), 2021–2031 Figure 59: South Asia Tinnitus Management Market Attractiveness Analysis, By Country Figure 60: South Asia Tinnitus Management Market Attractiveness Analysis, By Product Type Figure 61: South Asia Tinnitus Management Market Attractiveness Analysis, By Indication Figure 62: South Asia Tinnitus Management Market Attractiveness Analysis, By Distribution Channel Figure 63: East Asia Tinnitus Management Market Value Share, By Product Type (2021 E) Figure 64: East Asia Tinnitus Management Market Value Share, By Indication (2021 E) Figure 65: East Asia Tinnitus Management Market Value Share, By Distribution Channel (2021 E) Figure 66: East Asia Tinnitus Management Market Value Share, By Country (2021 E) Figure 67: East Asia Tinnitus Management Market Value (US$ Mn) Analysis, 2016–2020 Figure 68: East Asia Tinnitus Management Market Size (US$ Mn) & Y-o-Y Growth (%), 2021–2031 Figure 69: East Asia Tinnitus Management Market Attractiveness Analysis, By Country Figure 70: East Asia Tinnitus Management Market Attractiveness Analysis, By Product Type Figure 71: East Asia Tinnitus Management Market Attractiveness Analysis, By Indication Figure 72: East Asia Tinnitus Management Market Attractiveness Analysis, By Distribution Channel Figure 73: Oceania Tinnitus Management Market Value Share, By Product Type (2021 E) Figure 74: Oceania Tinnitus Management Market Value Share, By Indication (2021 E) Figure 75: Oceania Tinnitus Management Market Value Share, By Distribution Channel (2021 E) Figure 76: Oceania Tinnitus Management Market Value Share, By Country (2021 E) Figure 77: Oceania Tinnitus Management Market Value (US$ Mn) Analysis, 2016–2020 Figure 78: Oceania Tinnitus Management Market Size (US$ Mn) & Y-o-Y Growth (%), 2021–2031 Figure 79: Oceania Tinnitus Management Market Attractiveness Analysis, By Country Figure 80: Oceania Tinnitus Management Market Attractiveness Analysis, By Product Type Figure 81: Oceania Tinnitus Management Market Attractiveness Analysis, By Indication Figure 82: Oceania Tinnitus Management Market Attractiveness Analysis, By Distribution Channel Figure 83: MEA Tinnitus Management Market Value Share, By Product Type (2021 E) Figure 84: MEA Tinnitus Management Market Value Share, By Indication (2021 E) Figure 85: MEA Tinnitus Management Market Value Share, By Distribution Channel (2021 E) Figure 86: MEA Tinnitus Management Market Value Share, By Country (2021 E) Figure 87: MEA Tinnitus Management Market Value (US$ Mn) Analysis, 2016–2020 Figure 88: MEA Tinnitus Management Market Size (US$ Mn) & Y-o-Y Growth (%), 2021–2031 Figure 89: MEA Tinnitus Management Market Attractiveness Analysis, By Country Figure 90: MEA Tinnitus Management Market Attractiveness Analysis, By Product Type Figure 91: MEA Tinnitus Management Market Attractiveness Analysis, By Indication Figure 92: MEA Tinnitus Management Market Attractiveness Analysis, By Distribution Channel Figure 93: U.S. Market Value Proportion Analysis Figure 94: Global Vs U.S. Growth Comparison Figure 95: U.S. Tinnitus Management Market Share Analysis (%) By Product Type, 2021 & 2031 Figure 96: U.S. Tinnitus Management Market Share Analysis (%) By Indication, 2021 & 2031 Figure 97: U.S. Tinnitus Management Market Share Analysis (%) By Distribution Channel, 2021 & 2031 Figure 98: Canada Market Value Proportion Analysis Figure 99: Global Vs Canada Growth Comparison Figure 100: Canada Tinnitus Management Market Share Analysis (%) By Product Type, 2021 & 2031 Figure 101: Canada Tinnitus Management Market Share Analysis (%) By Indication, 2021 & 2031 Figure 102: Canada Tinnitus Management Market Share Analysis (%) By Distribution Channel, 2021 & 2031 Figure 103: Mexico Market Value Proportion Analysis Figure 104: Global Vs Mexico Growth Comparison Figure 105: Mexico Tinnitus Management Market Share Analysis (%) By Product Type, 2021 & 2031 Figure 106: Mexico Tinnitus Management Market Share Analysis (%) By Indication, 2021 & 2031 Figure 107: Mexico Tinnitus Management Market Share Analysis (%) By Distribution Channel, 2021 & 2031 Figure 108: Brazil Market Value Proportion Analysis Figure 109: Global Vs Brazil Growth Comparison Figure 110: Brazil Tinnitus Management Market Share Analysis (%) By Product Type, 2021 & 2031 Figure 111: Brazil Tinnitus Management Market Share Analysis (%) By Indication, 2021 & 2031 Figure 112: Brazil Tinnitus Management Market Share Analysis (%) By Distribution Channel, 2021 & 2031 Figure 113: UK Market Value Proportion Analysis Figure 114: Global Vs UK Growth Comparison Figure 115: UK Tinnitus Management Market Share Analysis (%) By Product Type, 2021 & 2031 Figure 116: UK Tinnitus Management Market Share Analysis (%) By Indication, 2021 & 2031 Figure 117: UK Tinnitus Management Market Share Analysis (%) By Distribution Channel, 2021 & 2031 Figure 118: Germany Market Value Proportion Analysis Figure 119: Global Vs Germany Growth Comparison Figure 120: Germany Tinnitus Management Market Share Analysis (%) By Product Type, 2021 & 2031 Figure 121: Germany Tinnitus Management Market Share Analysis (%) By Indication, 2021 & 2031 Figure 122: Germany Tinnitus Management Market Share Analysis (%) By Distribution Channel, 2021 & 2031 Figure 123: France Market Value Proportion Analysis Figure 124: Global Vs France Growth Comparison Figure 125: France Tinnitus Management Market Share Analysis (%) By Product Type, 2021 & 2031 Figure 126: France Tinnitus Management Market Share Analysis (%) By Indication, 2021 & 2031 Figure 127: France Tinnitus Management Market Share Analysis (%) By Distribution Channel, 2021 & 2031 Figure 128: Italy Market Value Proportion Analysis Figure 129: Global Vs Italy Growth Comparison Figure 130: Italy Tinnitus Management Market Share Analysis (%) By Product Type, 2021 & 2031 Figure 131: Italy Tinnitus Management Market Share Analysis (%) By Indication, 2021 & 2031 Figure 132: Italy Tinnitus Management Market Share Analysis (%) By Distribution Channel, 2021 & 2031 Figure 133: Spain Market Value Proportion Analysis Figure 134: Global Vs Spain Growth Comparison Figure 135: Spain Tinnitus Management Market Share Analysis (%) By Product Type, 2021 & 2031 Figure 136: Spain Tinnitus Management Market Share Analysis (%) By Indication, 2021 & 2031 Figure 137: Spain Tinnitus Management Market Share Analysis (%) By Distribution Channel, 2021 & 2031 Figure 138: BENELUX Market Value Proportion Analysis Figure 139: Global Vs BENELUX Growth Comparison Figure 140: BENELUX Tinnitus Management Market Share Analysis (%) By Product Type, 2021 & 2031 Figure 141: BENELUX Tinnitus Management Market Share Analysis (%) By Indication, 2021 & 2031 Figure 142: BENELUX Tinnitus Management Market Share Analysis (%) By Distribution Channel, 2021 & 2031 Figure 143: Russia Market Value Proportion Analysis Figure 144: Global Vs Russia Growth Comparison Figure 145:Russia Tinnitus Management Market Share Analysis (%) By Product Type, 2021 & 2031 Figure 146: Russia Tinnitus Management Market Share Analysis (%) By Indication, 2021 & 2031 Figure 147: Russia Tinnitus Management Market Share Analysis (%) By Distribution Channel, 2021 & 2031 Figure 148: China Market Value Proportion Analysis Figure 149: Global Vs China Growth Comparison Figure 150: China Tinnitus Management Market Share Analysis (%) By Product Type, 2021 & 2031 Figure 151: China Tinnitus Management Market Share Analysis (%) By Indication, 2021 & 2031 Figure 152: China Tinnitus Management Market Share Analysis (%) By Distribution Channel, 2021 & 2031 Figure 153: Japan Market Value Proportion Analysis Figure 154: Global Vs Japan Growth Comparison Figure 155: Japan Tinnitus Management Market Share Analysis (%) By Product Type, 2021 & 2031 Figure 156: Japan Tinnitus Management Market Share Analysis (%) By Indication, 2021 & 2031 Figure 157: Japan Tinnitus Management Market Share Analysis (%) By Distribution Channel, 2021 & 2031 Figure 158: South Korea Market Value Proportion Analysis Figure 159: Global Vs South Korea Growth Comparison Figure 160: South Korea Tinnitus Management Market Share Analysis (%) By Product Type, 2021 & 2031 Figure 161: South Korea Tinnitus Management Market Share Analysis (%) By Indication, 2021 & 2031 Figure 162: South Korea Tinnitus Management Market Share Analysis (%) By Distribution Channel, 2021 & 2031 Figure 163: India Market Value Proportion Analysis Figure 164: Global Vs India Growth Comparison Figure 165: India Tinnitus Management Market Share Analysis (%) By Product Type, 2021 & 2031 Figure 166: India Tinnitus Management Market Share Analysis (%) By Indication, 2021 & 2031 Figure 167: India Tinnitus Management Market Share Analysis (%) By Distribution Channel, 2021 & 2031 Figure 168: Thailand Market Value Proportion Analysis Figure 169: Global Vs Thailand Growth Comparison Figure 170: Thailand Tinnitus Management Market Share Analysis (%) By Product Type, 2021 & 2031 Figure 171:Thailand Tinnitus Management Market Share Analysis (%) By Indication, 2021 & 2031 Figure 172: Thailand Tinnitus Management Market Share Analysis (%) By Distribution Channel, 2021 & 2031 Figure 173: Indonesia Market Value Proportion Analysis Figure 174: Global Vs Indonesia Growth Comparison Figure 175: Indonesia Tinnitus Management Market Share Analysis (%) By Product Type, 2021 & 2031 Figure 176: Indonesia Tinnitus Management Market Share Analysis (%) By Indication, 2021 & 2031 Figure 177: Indonesia Tinnitus Management Market Share Analysis (%) By Distribution Channel, 2021 & 2031 Figure 178: Malaysia Market Value Proportion Analysis Figure 179: Global Vs Malaysia Growth Comparison Figure 180: Malaysia Tinnitus Management Market Share Analysis (%) By Product Type, 2021 & 2031 Figure 181: Malaysia Tinnitus Management Market Share Analysis (%) By Indication, 2021 & 2031 Figure 182: Malaysia Tinnitus Management Market Share Analysis (%) By Distribution Channel, 2021 & 2031 Figure 183: Australia Market Value Proportion Analysis Figure 184: Global Vs Australia Growth Comparison Figure 185: Australia Tinnitus Management Market Share Analysis (%) By Product Type, 2021 & 2031 Figure 186: Australia Tinnitus Management Market Share Analysis (%) By Indication, 2021 & 2031 Figure 187: Australia Tinnitus Management Market Share Analysis (%) By Distribution Channel, 2021 & 2031 Figure 188: New Zealand Market Value Proportion Analysis Figure 189: Global Vs New Zealand Growth Comparison Figure 190: New Zealand Tinnitus Management Market Share Analysis (%) By Product Type, 2021 & 2031 Figure 191: New Zealand Tinnitus Management Market Share Analysis (%) By Indication, 2021 & 2031 Figure 192: New Zealand Tinnitus Management Market Share Analysis (%) By Distribution Channel, 2021 & 2031 Figure 193: GCC Countries Market Value Proportion Analysis Figure 194: Global Vs GCC Countries Growth Comparison Figure 195: GCC Countries Tinnitus Management Market Share Analysis (%) By Product Type, 2021 & 2031 Figure 196: GCC Countries Tinnitus Management Market Share Analysis (%) By Indication, 2021 & 2031 Figure 197: GCC Countries Tinnitus Management Market Share Analysis (%) By Distribution Channel, 2021 & 2031 Figure 198: Turkey Market Value Proportion Analysis Figure 199: Global Vs Turkey Growth Comparison Figure 200: Turkey Tinnitus Management Market Share Analysis (%) By Product Type, 2021 & 2031 Figure 201: Turkey Tinnitus Management Market Share Analysis (%) By Indication, 2021 & 2031 Figure 202: Turkey Tinnitus Management Market Share Analysis (%) By Distribution Channel, 2021 & 2031 Figure 203: South Africa Market Value Proportion Analysis Figure 204: Global Vs South Africa Growth Comparison Figure 205: South Africa Tinnitus Management Market Share Analysis (%) By Product Type, 2021 & 2031 Figure 206: South Africa Tinnitus Management Market Share Analysis (%) By Indication, 2021 & 2031 Figure 207: South Africa Tinnitus Management Market Share Analysis (%) By Distribution Channel, 2021 & 2031
Need specific information?
Request CustomizationExplore Healthcare Insights
View Reports