Titration Sensors Market Size and Share Forecast Outlook 2025 to 2035

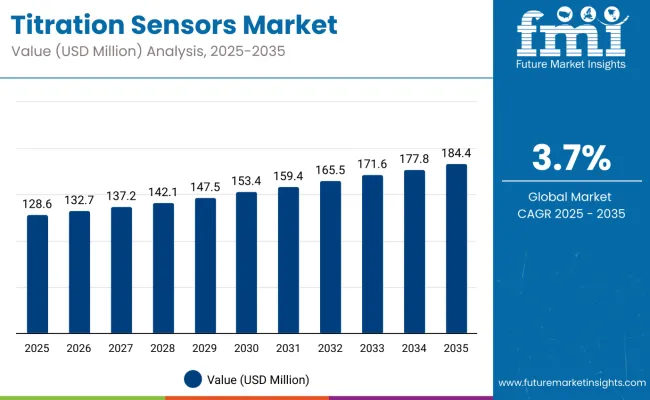
The global titration sensors market is expected to be valued at USD 128.6 million in 2025 and is projected to reach approximately USD 184.4 million by 2035. This reflects an absolute increase of USD 59.9 million, equivalent to a growth of 46.6% over the forecast period. The expansion is forecast to occur at a CAGR of 3.7%, with the market size estimated to grow by nearly 1.5X by the end of the decade.
Quick Stats for Titration Sensors Market

  • Industry Value (2025): USD 128.6 Million
  • Forecast Value (2035): USD 184.4 Million
  • Forecast CAGR: 3.7%
  • Leading Segment (2025): pH Sensor (46% share)
  • Key Growth End Use: Industrial Laboratories (45% share)
  • Top Key Players: Metrohm AG, Hach Lange GmbH, Mettler Toledo, DEL CONTROLS, Xylem Analytics, Photovolt Instruments Inc, Foundation Instruments, Inc., HirschmannLaborgeräte GmbH & Co. KG, and Myron L Company

Titration Sensors Market

Metric Value
Industry Size (2025E) USD 128.6 million
Industry Value (2035F) USD 184.4 million
CAGR (2025 to 2035) 3.7%

Between 2025 and 2030, the market is projected to expand from USD 128.6 million to USD 156.4 million, adding USD 27.8 million in value. This initial growth will be driven by rising demand for pH and conductivity sensors in water treatment plants across Asia and Europe, as governments tighten water quality standards and industrial discharge regulations. Expansion in pharmaceutical research labs will further push adoption of high-precision titration sensors in this phase.

From 2030 to 2035, the market is expected to grow from USD 156.4 million to USD 184.4 million, representing a cumulative increase of USD 31 million. Growth in this period will be shaped by the integration of digital titration systems with IoT and cloud-based monitoring platforms, along with increased investments in academic research facilities across the USA, Japan, and Germany.

From 2020 to 2024, the titration sensors market expanded steadily, driven by increasing demand in water treatment facilities, pharmaceutical laboratories, and chemical manufacturing plants, where high accuracy and reliability are essential for compliance and process optimization.

During this period, the market value increased from nearly USD 111.2 million in 2020 to USD 124.9 million in 2024, reflecting consistent adoption across both developed and emerging economies. Growth was further supported by stricter environmental monitoring regulations in Europe and East Asia, as well as by rising use of titration sensors in pharmaceutical quality assurance and R&D operations.

The industry landscape during this time was dominated by pH sensors, which accounted for the largest share of installations in 2024, supported by their widespread use in municipal water treatment, academic institutions, and pharmaceutical formulations.

These sensors gained favor due to their accuracy, long service life, and compatibility with digital titration systems, enabling wider penetration in both industrial and research laboratory segments. Market participation was led by established sensor manufacturers leveraging partnerships with instrument providers, after-sales calibration services, and compliance certifications (ISO/FDA/EU standards) to strengthen trust among end users.

By 2025, the market is estimated to reach a valuation of USD 128.6 million. This transition is being influenced by the rising preference for IoT-enabled titration systems in industrial laboratories, improvements in sensor durability and response time, and the integration of automated calibration technology to reduce human error.

As industries continue to prioritize data integrity, efficiency, and real-time monitoring, demand is gradually shifting toward sensors that combine high precision, digital connectivity, and low maintenance cycles. The 2025 baseline is set to serve as a springboard for accelerated growth, particularly as the sector aligns with FDA/EU compliance requirements and expanding water quality initiatives in Asia-Pacific and North America.

Why the Titration Sensors Market is Growing?

The titration sensors market is expanding as compliance-heavy industries tighten control over water quality and process chemistry. Municipal and industrial water treatment programs are the single largest pull, requiring continuous pH and conductivity measurement to meet discharge and potability standards. Utilities and private operators are refreshing fleets with higher-stability, low-drift sensors to reduce recalibration frequency and maintain audit trails.

Growth is reinforced by pharmaceutical, chemical, and food & beverage workflows that depend on titrimetric endpoints for QA/QC and batch release. As assay volumes rise, plants are standardizing on long-life pH and ORP probes that withstand repeated sterilization and CIP/SIP cycles, while laboratories specify ion-selective electrodes for targeted assays (e.g., sodium, chloride, fluoride) in formulations and raw-material verification.

A third driver is digitization of the lab and plant floor. Sensors increasingly ship with digital IDs, onboard diagnostics, and seamless links to titrators, LIMS/MES, and cloud dashboards, improving data integrity and supporting requirements such as 21 CFR Part 11/Annex 11. This connectivity enables predictive maintenance, alerting teams before drift or fouling compromises results, cutting downtime and consumables spend.

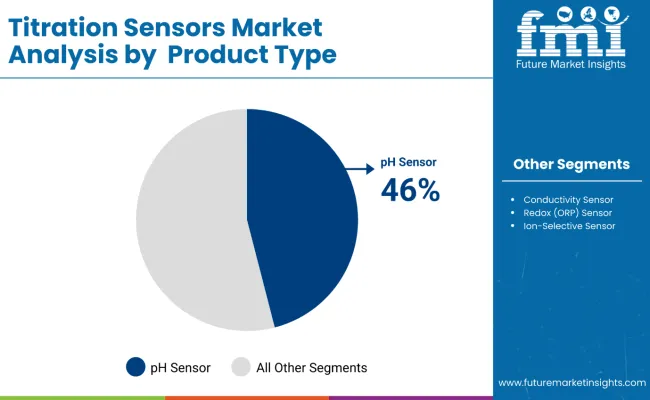
Besides, capacity build-outs in China and India and facility upgrades in the USA, Germany, and Japan are broadening the installed base. Universities and public research institutes, important end users alongside industrial labs, continue to add teaching and research titration stations, sustaining demand for pH (46% share) and conductivity sensors (24%), while specialty applications lift ORP and ion-selective sensors. Together, these forces create steady replacement cycles and incremental unit growth through 2035.
Market Segment Analysis

pH Sensors Remain the Cornerstone of Measurement Applications

Titration Sensors Market By Product

pH sensors are estimated to capture 46% of the sensor type segment in 2025, maintaining their dominance through 2035. Their dominance is attributed to their versatility and reliability in critical industries such as water treatment, pharmaceuticals, and chemical processing. In China, pH sensors are widely deployed in municipal wastewater facilities to meet strict environmental discharge standards, while in the United States, pharmaceutical and biotech labs rely on them for drug formulation and quality assurance.

Compared to ORP and ion-selective sensors, pH sensors provide a universal baseline measurement that underpins both industrial and academic research applications. Their long service life, low drift characteristics, and compatibility with automated titration systems make them indispensable in high-throughput labs, particularly in Germany and Japan, where data accuracy and reproducibility are non-negotiable.
Water Treatment Vertical Maintains Strongest Pull for Titration Sensors

Titration Sensors Market By Industry

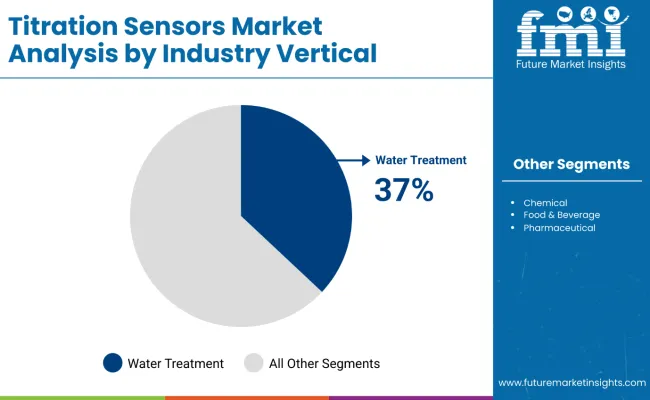
The water treatment industry is projected to account for 37% of the industry vertical share in 2025, sustaining its dominance through the forecast period. This leadership is driven by the expansion of municipal water treatment plants in China and India, along with stricter EU Water Framework Directive compliance programs in Germany. In these facilities, pH and conductivity sensors are integrated into online monitoring systems to ensure real-time control of water quality parameters.

In emerging economies, particularly India, government-backed initiatives such as the Jal Jeevan Mission are fueling large-scale procurement of titration sensors for community water monitoring. Meanwhile, Japan’s urban water systems are upgrading to advanced digital titration platforms to align with smart city initiatives, further reinforcing demand.
Industrial Laboratories Lead End-Use Adoption Globally

Titration Sensors Market By End User

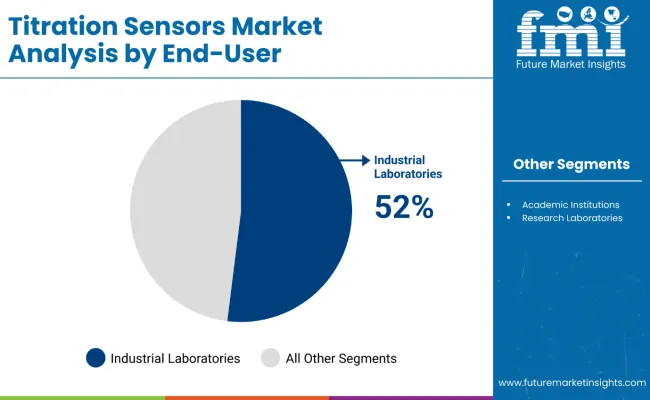
Industrial laboratories are expected to represent 52% of the end-use segment in 2025, making them the largest consumer group for titration sensors worldwide. Their prominence is shaped by the chemical, pharmaceutical, and water treatment industries, all of which require high-precision sensors for continuous monitoring, QA/QC protocols, and regulatory compliance.

In Germany, specialty chemical firms rely heavily on robust conductivity and ORP sensors for product validation, while in the United States, CROs and biotech research labs drive steady demand for pH and ion-selective sensors. Academic institutions, though smaller in share, are also expanding their adoption in India and China, where government funding is strengthening research output. Compared to smaller research labs, industrial laboratories invest in digitally connected titration sensors with predictive maintenance capabilities to minimize downtime and ensure operational efficiency.

Key Trends Shaping the Titration Sensors Market

Demand for titration sensors is being supported by factors such as compliance-led upgrades in water and wastewater, digitally native sensors and data integrity by design, longer life, lower maintenance in harsh matrices, multi-parameter and modular architectures, lab automation and micro-volume titration, sustainability and total-cost reductioncalibration-as-a-service and remote support.

Compliance-led upgrades in water and wastewater

Utilities and industrial effluent plants are refreshing fleets to meet tighter discharge and potability limits. This is lifting demand for stable, low-drift pH and conductivity sensors with longer calibration intervals and audit-ready data. The pull is strongest in USA municipal operations, Germany’s compliance-heavy utilities, and large China/India greenfield plants where online titration points are being added rather than replaced.

Digitally native sensors and data integrity by design

Labs and plants are standardizing on sensors with digital IDs, on-sensor calibration records, and secure handshakes to titrators, LIMS/MES, and cloud dashboards. This reduces transcription errors and simplifies 21 CFR Part 11/Annex 11 compliance, especially in USA pharma/CRO hubs and Japan’s research institutions. Built-in diagnostics (slope, offset, impedance) enable predictive maintenance before drift jeopardizes batch release.

Longer life, lower maintenance in harsh matrices

Materials advances solid-state or polymer reference systems, anti-fouling junctions, ISFET/non-glass pH tips, and CIP/SIP-capable housings are extending sensor uptime in chemical, food, and wastewater duties. Germany’s specialty chemicals and India’s bulk pharma plants are prioritizing probes that tolerate sterilization and frequent cleaning, cutting consumables spend and downtime.

Multiparameter and modular architectures

End users are consolidating measurement points via combo probes (pH/temperature/conductivity) and modular cables/housings that swap quickly between titrators and inline loops. This is popular in China’s large water treatment campuses and USA food & beverage lines where footprint and changeover speed matter. Modular spares strategies also simplify inventory for multi-site operators.

Lab automation and micro-volume titration

High-throughput QA/QC is pushing autosamplers, robotic titration stations, and micro-volume cells that minimize reagents while maintaining accuracy. Japan’s electronics and pharma labs and German method-development groups are pairing these systems with fast-response pH/ORP and ion-selective sensors to shorten cycle times without sacrificing traceability.

Sustainability and total-cost reduction

Procurement teams are weighting reagent reduction, sensor recyclability, and energy-efficient analyzers alongside accuracy specs. In India and the USA, “green lab” initiatives and corporate ESG targets are accelerating the shift to longer-life electrodes and heat-recovery/autosleep features on titration platforms, lowering both cost per test and environmental impact.

Service models: calibration-as-a-service and remote support

Vendors are bundling factory pre-calibration, swap programs, and remote health monitoring to guarantee uptime across multi-site networks. This resonates with USA water districts and China’s municipal operators, where lean teams prefer predictable service windows and automated alerts over reactive maintenance.
Country Wise Growth Outlook

Titration Sensors Market By Country

Regulatory Compliance and R&D Spending Drive USA Market Growth

Titration Sensors Market Usa

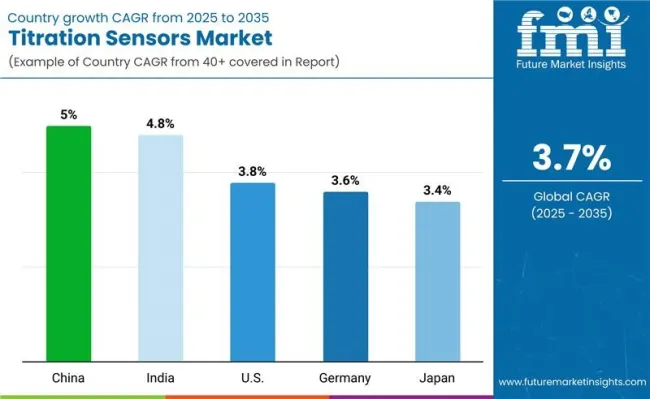
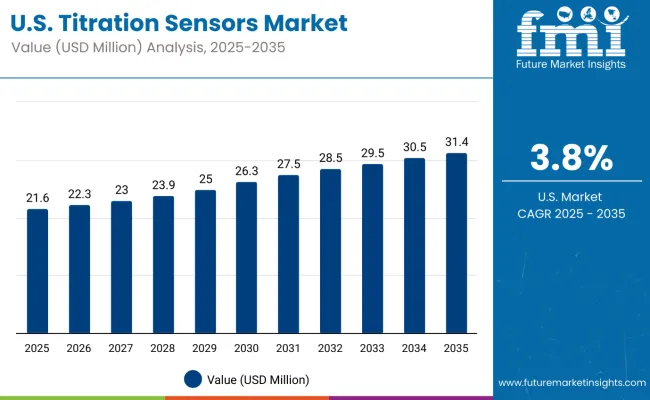
The USA titration sensors market is expected to grow at a CAGR of 3.8% from 2025 to 2035, supported by strict EPA water quality mandates, high investment in pharmaceutical and biotech R&D, and demand for precision pH and conductivity sensors in academic and industrial laboratories. Universities and contract research organizations (CROs) are expanding adoption of advanced titration systems to meet FDA data integrity requirements.

  • Growth supported by EPA regulations for wastewater and drinking water quality.
  • Pharmaceutical and biotech R&D hubs (Boston, San Diego) boost demand for pH and ORP sensors.
  • Academic research labs remain large adopters due to federal funding programs.
  • Increasing use of cloud-enabled titration systems in industrial labs.

China’s Industrial Expansion and Water Management Needs Fuel Demand

China is the fastest-growing market with a projected CAGR of 5.0% through 2035, driven by industrial growth in chemicals, food processing, and water treatment. Expanding municipal water treatment projects and the country’s commitment to environmental sustainability goals are creating strong demand for conductivity and pH sensors. Domestic sensor manufacturers are also scaling production to meet demand in mid-range segments.

  • Industrial wastewater treatment projects boost pH and conductivity sensor adoption.
  • Chemical sector expansion drives demand for robust titration sensors.
  • Government-backed environmental programs align with sensor market growth.
  • Local manufacturers increasing supply of cost-competitive titration equipment.

Germany’s Precision Manufacturing and Pharma Sectors Reinforce Sensor Adoption

Germany’s market is forecast to grow at a CAGR of 3.6% over the forecast period. Precision in pharmaceutical R&D, specialty chemicals, and high-quality food & beverage testing supports consistent demand for titration sensors. Regulatory compliance under EU water directives further reinforces adoption in municipal and industrial treatment facilities.

  • Strong uptake in pharmaceutical R&D and specialty chemicals.
  • Food and beverage sector demand grows with HACCP compliance.
  • Municipal water treatment upgrades align with EU directives.
  • German labs favor high-accuracy, long-life sensors with digital integration.

India’s Growing Pharmaceutical and Academic Research Base Accelerates Adoption

India’s titration sensors market is projected to expand at a CAGR of 4.8%, driven by its pharmaceutical manufacturing hub, rising academic research output, and expanding industrial laboratories. The government’s investment in water quality monitoring under the Jal Jeevan Mission further accelerates demand for pH and conductivity sensors in treatment facilities.

  • Pharma sector in Hyderabad and Gujarat pushes high-volume sensor demand.
  • Academic institutions adopt titration systems to support growing research capacity.
  • Industrial laboratories expand with chemical and agrochemical exports.
  • National water monitoring programs increase municipal adoption of sensors.

Japan’s Advanced Electronics and Research Institutions Sustain Market Growth

Japan’s titration sensors market is expected to grow at a CAGR of 3.4% from 2025 to 2035, supported by electronics manufacturing, pharmaceutical R&D, and leading research universities. Demand is shifting toward compact, high-precision pH and ion-selective sensors, reflecting Japan’s focus on innovation and accuracy in laboratory environments.

  • Electronics and precision industries favor compact, high-accuracy sensors.
  • Universities in Tokyo and Kyoto sustain demand in research laboratories.
  • Pharma R&D centers prioritize compliance-ready digital titration systems.
  • Demand shaped by focus on long-term reliability and low maintenance.

Europe Titration SensorsMarket Split by Country

Countries 2025
Germany 24%
Italy 13%
France 16%
UK 14%
Spain 7%
BENELUX 8%
Russia 6%
Rest of Europe 12%
Countries 2035
Germany 23%
Italy 12%
France 15%
UK 15%
Spain 8%
BENELUX 8%
Russia 5%
Rest of Europe 14%

The European Titration Sensors market is projected to grow at a CAGR of 3.7% from 2025 to 2035, reaching USD 32.8 million by 2035, up from USD 22.8 million in 2025. Growth will be paced by compliance-driven replacements, energy-efficiency retrofits, and deployment in noise-sensitive facilities (healthcare, food & beverage, precision engineering).

Western Europe remains replacement-led and specification-heavy, while Southern Europe advances on plant upgrades and tourism-related refurbishments. Oil-free rotary screw platforms and portable, acoustically enclosed units remain the winning configurations due to hygiene, reliability, and low dB(A) performance in mixed-use urban settings.

Germany continues to be the lead market in Europe, though its growth is increasingly maturity-driven and specification-heavy. Demand is strongest in precision machining, automotive Tier-1/Tier-2 suppliers, and medical technology packaging lines, all of which rely on oil-free rotary screw compressors equipped with acoustic shrouds to comply with DIN and EU noise regulations. Predictive maintenance and IoT-enabled monitoring are widely adopted to reduce downtime in multi-shift plants, and hospitals and pharmaceutical packaging facilities increasingly specify compressors with certified purity and low-vibration performance.

Italy shows consistent growth, anchored by the food processing and pharmaceutical packaging sectors, where HACCP and GMP compliance drive demand for oil-free, dry air solutions. Ports in Liguria and Campania, along with heavy machinery clusters, are expanding their use of portable units for quay-side applications and industrial maintenance bays. Small and medium enterprises across northern Italy are also transitioning from legacy piston models to quieter, energy-efficient compressors that reduce workplace exposure to noise.

France demonstrates strong hygiene-critical adoption, particularly in the aerospace and healthcare sectors. Toulouse remains a hub for aerospace operations, where low-vibration, oil-free compressors are essential in precision assembly and maintenance facilities. In addition, France’s extensive hospital networks in Île-de-France are upgrading to acoustically enclosed, oil-free compressors to support sterile environments and cleanroom-adjacent workflows. The food and beverage industry also adds momentum, with urban plants adopting quiet compressors to comply with strict neighborhood noise ordinances.

The UK is witnessing steady market growth, supported by large-scale infrastructure renewal projects and the country’s strong professional trades ecosystem. Rail, utilities, and public estate refurbishment projects are creating demand for portable, oil-free units capable of operating indoors in noise-restricted zones.

The growth of tool leasing and compliance bundles, which often include sound testing and maintenance services, is helping small and medium-sized enterprises access advanced quiet compressor technology. In addition, tradespeople and premium DIY users in urban areas are increasingly adopting compact, portable compressors for renovation projects.

Spain is emerging as a share gainer in the European market. Catalonia’s strong automotive supplier base, coupled with refurbishment activity in the tourism sector, is driving demand for quiet, portable compressors suited to space-constrained urban environments.

Airports, resorts, and hotels are expanding their use of low-dB(A) compressors to conduct night-shift maintenance without disrupting guests and visitors. Regional government grants promoting energy-efficient equipment upgrades are further accelerating adoption, particularly in high-density urban centers.

The BENELUX region remains a critical hub for pharmaceuticals, chemicals, and logistics, all of which rely heavily on quiet compressor technology. Clean manufacturing facilities and large logistics campuses are adopting oil-free models with advanced filtration systems and remote monitoring capabilities.

Distribution centers and cold-chain facilities across Belgium and the Netherlands are specifying acoustically enclosed units to comply with strict neighborhood sound limits. Public procurement programs in this region also emphasize energy efficiency, with strong adoption of IE3/IE4 motors and heat-recovery-enabled compressors.

Russia, despite facing geopolitical and economic pressures, continues to represent a significant market for quiet compressors, particularly in utilities and process industries. Municipal services in Moscow and St. Petersburg are procuring quiet, robust portable units to conduct maintenance in noise-sensitive urban areas. Industrial plants in oil & gas, chemicals, and metals are favoring durable rotary screw compressors that can withstand intensive use while delivering consistent performance.

The country’s healthcare sector is also upgrading hospital and laboratory infrastructure with oil-free models that provide hygienic, low-noise compressed air. With sanctions reshaping supply chains, Russia is increasingly turning toward domestic and partner-brand manufacturers to secure reliable equipment supply.

Titration Sensors Type Analysis of the Titration Sensors Market in Japan

The titration sensors market in Japan is projected to remain technology-driven, with pH sensors leading at 40% share in 2025. Demand is closely tied to the country’s precision electronics manufacturing, pharmaceutical R&D, and water treatment standards, all of which require high stability and long service life in sensor design. Japan’s market reflects an emphasis on accuracy, compact integration, and cleanroom compatibility, supported by regulatory alignment with ISO and regional water safety guidelines.

  • pH sensors dominate at 40%, underpinning applications in pharmaceuticals, wastewater monitoring, and food-quality testing.
  • Conductivity sensors account for 25% of share, driven by electronics and semiconductor fabs requiring ultra-pure water verification.
  • Redox (ORP) sensors hold 15%, sustained by applications in wastewater facilities and chemical oxidation monitoring.
  • Ion-selective sensors are niche at 10%, but their uptake is reinforced by specialty labs testing for fluoride, nitrate, and ammonia in food and clinical applications.
  • Other sensors at 10% include multi-parameter probes increasingly adopted by universities for compact field kits and student research projects.

End-Use Analysis of the Titration Sensors Market in South Korea

The South Korean titration sensors market is characterized by strong industrial laboratory usage, which accounts for 45% of the market share in 2025, supported by the country’s robust semiconductor, petrochemical, and heavy industries. End-use growth is further shaped by the expanding academic research ecosystem and sustained government investment in biotechnology and materials science. Compact sensors with IoT integration and low-drift electrodes are becoming preferred choices for both institutional and commercial laboratories.
  • Industrial laboratories lead at 45%, particularly in semiconductor fabs and chemical parks, where continuous quality control demands high-frequency, automated titration systems.
  • Academic institutions contribute 35%, with rising adoption in national universities and technical institutes conducting applied chemistry and water quality studies.
  • Research laboratories account for 20%, driven by South Korea’s R&D leadership in advanced materials, nanotechnology, and biopharmaceutical development, where trace-ion monitoring is critical.

Competition Outlook

Titration Sensors Market By Company

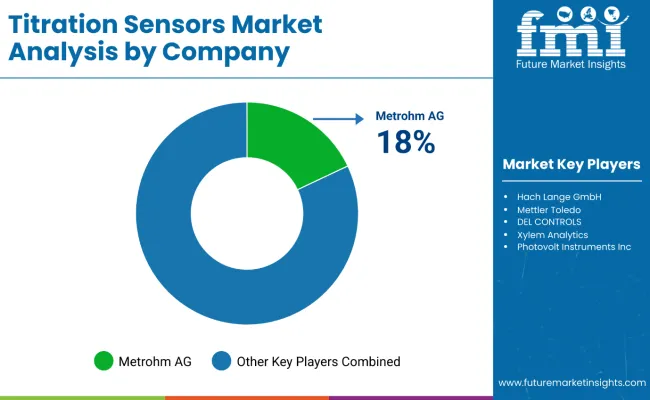
The titration sensors market is moderately consolidated, with a handful of global instrumentation majors and specialized sensor developers dominating share. Competition is shaped by long-term supply contracts, portfolio breadth, and the ability to serve both industrial end-users and academic/research institutions.

Multinationals such as Metrohm, Mettler-Toledo, Hach, and Hamilton retain leadership by leveraging end-to-end titration solutions, where sensors are bundled with titrators, software, and calibration kits. These firms differentiate through compliance-ready systems (21 CFR Part 11, GMP/GLP adherence) and data integration features for laboratories operating under FDA and EMA oversight. For example, Metrohm has built dominance in Europe through a mix of distributor networks and in-house training academies that reinforce brand loyalty among universities and public research labs.

Asian competitors, particularly from Japan and South Korea, are strengthening their positions through miniaturized, high-precision pH and conductivity sensors tailored to electronics and semiconductor fabs. Companies such as HORIBA (Japan) and DKK-TOA leverage regional expertise in water quality and process control, securing contracts in ultra-pure water and environmental monitoring. Meanwhile, Chinese entrants are competing on cost efficiency and rapid delivery, supplying to municipal water utilities and lower-budget research institutes, though they still lag behind Western players in long-term stability and calibration standards.

  • In March 2025, Metrohm introduced the ChemiSphere™ app integration with its OMNIS titration platform, enabling seamless reagent-bottle data transfer for better traceability and data integrity. This move directly addresses compliance requirements under FDA 21 CFR Part 11 and EU Annex 11, strengthening Metrohm’s foothold in pharmaceutical quality control and regulated industries.
  • In February 2025, Hach launched the NH6000sc Ammonia Analyzer in North America. Based on Gas Sensing Electrode (GSE) technology, the system reduces reagent consumption and extends service intervals, making it particularly valuable for municipal water treatment plants and industrial wastewater operators seeking cost efficiency.
  • In November 2024, Hamilton unveiled its PSD SmartSense Pump as part of its laboratory automation portfolio. The platform integrates liquid-handling precision with embedded sensors, allowing real-time feedback in titration and sample preparation workflows. This supports the trend toward “smart labs” in biopharmaceutical R&D and high-throughput industrial labs.
  • In September 2024, Hach highlighted the SL250 Portable Parallel Analyzer (PPA) in its India product portfolio. Capable of handling multiple probe-based measurements including pH and conductivity, the SL250 provides laboratories and field teams with a portable complement to titration sensors in resource-constrained settings.
  • In April 2024, Metrohm expanded the OMNIS platform with OMNIS NIRS (Near-Infrared Spectroscopy) and an automated coulometric KF titration module. This integration allows laboratories to perform combined NIRS and titration analysis with robotic automation, cutting sample turnaround times in food safety and pharmaceutical QA/QC by up to 25%.
  • In 2024, Mettler-Toledo released its EVA Volumetric Karl Fischer Titrator, equipped with the digital dSens M143 sensor and full LabX™ compliance features. The system provides improved precision in water content determination and secures adoption in industries such as specialty chemicals, pharma, and energy storage.
  • In February 2024, HORIBA rolled out its MLMAP2028 mid-term strategy, emphasizing R&D in electrochemical sensors for water quality and life science applications. This roadmap underlines the company’s commitment to enhancing pH and ion-selective electrodes that underpin modern titration workflows.
  • In February 2024, DKK-TOA established a new regional office in Thailand to serve Southeast Asia. By strengthening service and distribution support for pH, ORP, and ion-selective sensors, the firm is aiming to capture rising demand in local water treatment and beverage industries.

Companies

  • Metrohm AG
  • Hach Lange GmbH
  • Mettler Toledo
  • DEL CONTROLS
  • Xylem Analytics
  • Photovolt Instruments Inc
  • Foundation Instruments, Inc.
  • Hirschmann Laborgeräte GmbH & Co. KG
  • Myron L Company

Report Scope

Item Value
Quantitative Units USD 128.6 Million (2025)
Type pH Sensor, Conductivity Sensors, ORP Sensors, Ion-Selective Sensors, Other Types
Industry Vertical Chemical, Food & Beverage, Pharmaceuticals, Water Treatment
End User Academic Institutions, Industrial Laboratories, Research Laboratories
Regions Covered North America, Europe, East Asia, South Asia & Pacific, Latin America, Middle East & Africa
Countries Covered United States, Germany, United Kingdom, Japan, China, France, Italy, South Korea, Spain, BENELUX
Key Companies Profiled Metrohm AG, Hach Lange GmbH, Mettler Toledo, DEL CONTROLS, Xylem Analytics, Photovolt Instruments Inc , Foundation Instruments, Inc., Hirschmann Laborgeräte GmbH & Co. KG, Myron L Company

Key Segments

By Type:

  • pH Sensor
  • Conductivity Sensors
  • Redox (ORP) Sensors
  • Ion-Selective Sensors
  • Others

By Industry Vertical:

  • Chemical
  • Food & Beverage
  • Pharmaceutical
  • Water Treatment

By End User:

  • Academic Institutions
  • Industrial Laboratories
  • Research Laboratories

By Region:

  • North America
  • Latin America
  • Western Europe
  • Eastern Europe
  • East Asia
  • South Asia & Pacific
  • Middle East & Africa

Table of Content

  1. Executive Summary
    • Global Market Outlook
    • Demand-side Trends
    • Supply-side Trends
    • Technology Roadmap Analysis
    • Analysis and Recommendations
  2. Market Overview
    • Market Coverage / Taxonomy
    • Market Definition / Scope / Limitations
  3. Market Background
    • Market Dynamics
      • Drivers
      • Restraints
      • Opportunity
      • Trends
    • Scenario Forecast
      • Demand in Optimistic Scenario
      • Demand in Likely Scenario
      • Demand in Conservative Scenario
    • Key Success Factors
    • Industry Developments
    • Supply Chain Analysis
      • Sourcing and Procurement
        • Raw Material / Component Suppliers
        • Technology Providers
      • Product Manufacturers
      • Channel Partners
      • End Users / Customers
    • Market Assessment Factors
      • Macro-economic Factors
      • Forecast Factors
  4. 3.10. Parent Market Outlook
  5. Global Market Analysis 2020 to 2024 and Forecast, 2025 to 2035
    • Historical Market Size Value (USD Million) & Volume (Units) Analysis, 2020 to 2024
    • Current and Future Market Size Value (USD Million) & Volume (Units) Projections, 2025 to 2035
      • Y-o-Y Growth Trend Analysis
      • Absolute $ Opportunity Analysis
  6. Global Market Pricing Analysis 2020 to 2024 and Forecast 2025 to 2035
  7. Global Market Analysis 2020 to 2024 and Forecast 2025 to 2035, By Type
    • Introduction / Key Findings
    • Historical Market Size Value (USD Million) & Volume (Units) Analysis By Type, 2020 to 2024
    • Current and Future Market Size Value (USD Million) & Volume (Units) Analysis and Forecast By Type, 2025 to 2035
      • pH Sensor
      • Conductivity Sensors
      • Redox (ORP) Sensors
      • Ion-Selective Sensors
      • Others
    • Y-o-Y Growth Trend Analysis By Type, 2020 to 2024
    • Absolute $ Opportunity Analysis By Type, 2025 to 2035
  8. Global Market Analysis 2020 to 2024 and Forecast 2025 to 2035, By Industry Vertical
    • Introduction / Key Findings
    • Historical Market Size Value (USD Million) & Volume (Units) Analysis By Industry Vertical, 2020 to 2024
    • Current and Future Market Size Value (USD Million) & Volume (Units) Analysis and Forecast By Industry Vertical, 2025 to 2035
      • Chemical
      • Food & Beverage
      • Pharmaceutical
      • Water Treatment
    • Y-o-Y Growth Trend Analysis By Industry Vertical, 2020 to 2024
    • Absolute $ Opportunity Analysis By Industry Vertical, 2025 to 2035
  9. Global Market Analysis 2020 to 2024 and Forecast 2025 to 2035, By End User
    • Introduction / Key Findings
    • Historical Market Size Value (USD Million) & Volume (Units) Analysis By End User, 2020 to 2024
    • Current and Future Market Size Value (USD Million) & Volume (Units) Analysis and Forecast By End User, 2025 to 2035
      • Academic Institutions
      • Industrial Laboratories
      • Research Laboratories
    • Y-o-Y Growth Trend Analysis By End User, 2020 to 2024
    • Absolute $ Opportunity Analysis By End User, 2025 to 2035
  10. Global Market Analysis 2020 to 2024 and Forecast 2025 to 2035, By Region
    • Introduction
    • Historical Market Size Value (USD Million) & Volume (Units) Analysis By Region, 2020 to 2024
    • Current Market Size Value (USD Million) & Volume (Units) Analysis and Forecast By Region, 2025 to 2035
      • North America
      • Latin America
      • Western Europe
      • Eastern Europe
      • East Asia
      • South Asia & Pacific
      • Middle East & Africa
    • Market Attractiveness Analysis By Region
  11. North America Market Analysis 2020 to 2024 and Forecast 2025 to 2035, By Country
    • Historical Market Size Value (USD Million) & Volume (Units) Trend Analysis By Market Taxonomy, 2020 to 2024
    • Market Size Value (USD Million) & Volume (Units) Forecast By Market Taxonomy, 2025 to 2035
      • By Country
        • USA
        • Canada
        • Mexico
      • By Type
      • By Industry Vertical
      • By End User
    • Market Attractiveness Analysis
      • By Country
      • By Type
      • By Industry Vertical
      • By End User
    • Key Takeaways
  12. Latin America Market Analysis 2020 to 2024 and Forecast 2025 to 2035, By Country
    • Historical Market Size Value (USD Million) & Volume (Units) Trend Analysis By Market Taxonomy, 2020 to 2024
    • Market Size Value (USD Million) & Volume (Units) Forecast By Market Taxonomy, 2025 to 2035
      • By Country
        • Brazil
        • Argentina
        • Rest of Latin America
      • By Type
      • By Industry Vertical
      • By End User
    • Market Attractiveness Analysis
      • By Country
      • By Type
      • By Industry Vertical
      • By End User
    • Key Takeaways
  13. Western Europe Market Analysis 2020 to 2024 and Forecast 2025 to 2035, By Country
    • Historical Market Size Value (USD Million) & Volume (Units) Trend Analysis By Market Taxonomy, 2020 to 2024
    • Market Size Value (USD Million) & Volume (Units) Forecast By Market Taxonomy, 2025 to 2035
      • By Country
        • Germany
        • Italy
        • France
        • UK
        • Spain
        • BENELUX
        • Nordics
        • Rest of W. Europe
      • By Type
      • By Industry Vertical
      • By End User
    • Market Attractiveness Analysis
      • By Country
      • By Type
      • By Industry Vertical
      • By End User
    • Key Takeaways
  14. Eastern Europe Market Analysis 2020 to 2024 and Forecast 2025 to 2035, By Country
    • Historical Market Size Value (USD Million) & Volume (Units) Trend Analysis By Market Taxonomy, 2020 to 2024
    • Market Size Value (USD Million) & Volume (Units) Forecast By Market Taxonomy, 2025 to 2035
      • By Country
        • Hungary
        • Poland
        • Russia
        • Balkan & Baltics
        • Rest of E.Europe
      • By Type
      • By Industry Vertical
      • By End User
    • Market Attractiveness Analysis
      • By Country
      • By Type
      • By Industry Vertical
      • By End User
    • Key Takeaways
  15. East Asia Market Analysis 2020 to 2024 and Forecast 2025 to 2035, By Country
    • Historical Market Size Value (USD Million) & Volume (Units) Trend Analysis By Market Taxonomy, 2020 to 2024
    • Market Size Value (USD Million) & Volume (Units) Forecast By Market Taxonomy, 2025 to 2035
      • By Country
        • China
        • Japan
        • South Korea
      • By Type
      • By Industry Vertical
      • By End User
    • Market Attractiveness Analysis
      • By Country
      • By Type
      • By Industry Vertical
      • By End User
    • Key Takeaways
  16. South Asia & Pacific Market Analysis 2020 to 2024 and Forecast 2025 to 2035, By Country
    • Historical Market Size Value (USD Million) & Volume (Units) Trend Analysis By Market Taxonomy, 2020 to 2024
    • Market Size Value (USD Million) & Volume (Units) Forecast By Market Taxonomy, 2025 to 2035
      • By Country
        • India
        • ASEAN
        • Australia & New Zealand
      • By Type
      • By Industry Vertical
      • By End User
    • Market Attractiveness Analysis
      • By Country
      • By Type
      • By Industry Vertical
      • By End User
    • Key Takeaways
  17. Middle East & Africa Market Analysis 2020 to 2024 and Forecast 2025 to 2035, By Country
    • Historical Market Size Value (USD Million) & Volume (Units) Trend Analysis By Market Taxonomy, 2020 to 2024
    • Market Size Value (USD Million) & Volume (Units) Forecast By Market Taxonomy, 2025 to 2035
      • By Country
        • GCC Countries
        • Turkiye
        • Northern Africa
        • South Africa
        • Rest of MEA
      • By Type
      • By Industry Vertical
      • By End User
    • Market Attractiveness Analysis
      • By Country
      • By Type
      • By Industry Vertical
      • By End User
    • Key Takeaways
  18. Key Countries Market Analysis
    • USA
      • Pricing Analysis
      • Market Share Analysis, 2024
        • By Type
        • By Industry Vertical
        • By End User
    • Canada
      • Pricing Analysis
      • Market Share Analysis, 2024
        • By Type
        • By Industry Vertical
        • By End User
    • Mexico
      • Pricing Analysis
      • Market Share Analysis, 2024
        • By Type
        • By Industry Vertical
        • By End User
    • Brazil
      • Pricing Analysis
      • Market Share Analysis, 2024
        • By Type
        • By Industry Vertical
        • By End User
    • Argentina
      • Pricing Analysis
      • Market Share Analysis, 2024
        • By Type
        • By Industry Vertical
        • By End User
    • Germany
      • Pricing Analysis
      • Market Share Analysis, 2024
        • By Type
        • By Industry Vertical
        • By End User
    • Italy
      • Pricing Analysis
      • Market Share Analysis, 2024
        • By Type
        • By Industry Vertical
        • By End User
    • France
      • Pricing Analysis
      • Market Share Analysis, 2024
        • By Type
        • By Industry Vertical
        • By End User
    • UK
      • Pricing Analysis
      • Market Share Analysis, 2024
        • By Type
        • By Industry Vertical
        • By End User
    • Spain
      • Pricing Analysis
      • Market Share Analysis, 2024
        • By Type
        • By Industry Vertical
        • By End User
    • BENELUX
      • Pricing Analysis
      • Market Share Analysis, 2024
        • By Type
        • By Industry Vertical
        • By End User
    • Nordics
      • Pricing Analysis
      • Market Share Analysis, 2024
        • By Type
        • By Industry Vertical
        • By End User
    • Russia
      • Pricing Analysis
      • Market Share Analysis, 2024
        • By Type
        • By Industry Vertical
        • By End User
    • Hungary
      • Pricing Analysis
      • Market Share Analysis, 2024
        • By Type
        • By Industry Vertical
        • By End User
    • Poland
      • Pricing Analysis
      • Market Share Analysis, 2024
        • By Type
        • By Industry Vertical
        • By End User
    • Balkan & Baltics
      • Pricing Analysis
      • Market Share Analysis, 2024
        • By Type
        • By Industry Vertical
        • By End User
    • China
      • Pricing Analysis
      • Market Share Analysis, 2024
        • By Type
        • By Industry Vertical
        • By End User
    • Japan
      • Pricing Analysis
      • Market Share Analysis, 2024
        • By Type
        • By Industry Vertical
        • By End User
    • South Korea
      • Pricing Analysis
      • Market Share Analysis, 2024
        • By Type
        • By Industry Vertical
        • By End User
    • India
      • Pricing Analysis
      • Market Share Analysis, 2024
        • By Type
        • By Industry Vertical
        • By End User
    • ASEAN
      • Pricing Analysis
      • Market Share Analysis, 2024
        • By Type
        • By Industry Vertical
        • By End User
    • Australia & New Zealand
      • Pricing Analysis
      • Market Share Analysis, 2024
        • By Type
        • By Industry Vertical
        • By End User
    • GCC Countries
      • Pricing Analysis
      • Market Share Analysis, 2024
        • By Type
        • By Industry Vertical
        • By End User
    • Turkiye
      • Pricing Analysis
      • Market Share Analysis, 2024
        • By Type
        • By Industry Vertical
        • By End User
    • Northern Africa
      • Pricing Analysis
      • Market Share Analysis, 2024
        • By Type
        • By Industry Vertical
        • By End User
    • South Africa
      • Pricing Analysis
      • Market Share Analysis, 2024
        • By Type
        • By Industry Vertical
        • By End User
  19. Market Structure Analysis
    • Competition Dashboard
    • Competition Benchmarking
    • Market Share Analysis of Top Players
      • By Regional
      • By Type
      • By Industry Vertical
      • By End User
  20. Competition Analysis
    • Competition Deep Dive
      • Metrohm AG
        • Overview
        • Product Portfolio
        • Profitability by Market Segments
        • Sales Footprint
        • Strategy Overview
      • Hach Lange GmbH
        • Overview
        • Product Portfolio
        • Profitability by Market Segments
        • Sales Footprint
        • Strategy Overview
      • Mettler Toledo
        • Overview
        • Product Portfolio
        • Profitability by Market Segments
        • Sales Footprint
        • Strategy Overview
      • DEL CONTROLS
        • Overview
        • Product Portfolio
        • Profitability by Market Segments
        • Sales Footprint
        • Strategy Overview
      • Xylem Analytics
        • Overview
        • Product Portfolio
        • Profitability by Market Segments
        • Sales Footprint
        • Strategy Overview
      • Photovolt Instruments Inc
        • Overview
        • Product Portfolio
        • Profitability by Market Segments
        • Sales Footprint
        • Strategy Overview
      • Foundation Instruments, Inc.
        • Overview
        • Product Portfolio
        • Profitability by Market Segments
        • Sales Footprint
        • Strategy Overview
      • Hirschmann Laborgeräte GmbH & Co. KG
        • Overview
        • Product Portfolio
        • Profitability by Market Segments
        • Sales Footprint
        • Strategy Overview
      • Myron L Company
        • Overview
        • Product Portfolio
        • Profitability by Market Segments
        • Sales Footprint
        • Strategy Overview
  21. Assumptions & Acronyms Used
  22. Research Methodology

List of Tables

  • Table 1: Global Market Value (USD Million) Forecast by Region, 2020-2035
  • Table 2: Global Market Volume (Units) Forecast by Region, 2020-2035
  • Table 3: Global Market Value (USD Million) Forecast by Type, 2020-2035
  • Table 4: Global Market Volume (Units) Forecast by Type, 2020-2035
  • Table 5: Global Market Value (USD Million) Forecast by Industry Vertical, 2020-2035
  • Table 6: Global Market Volume (Units) Forecast by Industry Vertical, 2020-2035
  • Table 7: Global Market Value (USD Million) Forecast by End User, 2020-2035
  • Table 8: Global Market Volume (Units) Forecast by End User, 2020-2035
  • Table 9: North America Market Value (USD Million) Forecast by Country, 2020-2035
  • Table 10: North America Market Volume (Units) Forecast by Country, 2020-2035
  • Table 11: North America Market Value (USD Million) Forecast by Type, 2020-2035
  • Table 12: North America Market Volume (Units) Forecast by Type, 2020-2035
  • Table 13: North America Market Value (USD Million) Forecast by Industry Vertical, 2020-2035
  • Table 14: North America Market Volume (Units) Forecast by Industry Vertical, 2020-2035
  • Table 15: North America Market Value (USD Million) Forecast by End User, 2020-2035
  • Table 16: North America Market Volume (Units) Forecast by End User, 2020-2035
  • Table 17: Latin America Market Value (USD Million) Forecast by Country, 2020-2035
  • Table 18: Latin America Market Volume (Units) Forecast by Country, 2020-2035
  • Table 19: Latin America Market Value (USD Million) Forecast by Type, 2020-2035
  • Table 20: Latin America Market Volume (Units) Forecast by Type, 2020-2035
  • Table 21: Latin America Market Value (USD Million) Forecast by Industry Vertical, 2020-2035
  • Table 22: Latin America Market Volume (Units) Forecast by Industry Vertical, 2020-2035
  • Table 23: Latin America Market Value (USD Million) Forecast by End User, 2020-2035
  • Table 24: Latin America Market Volume (Units) Forecast by End User, 2020-2035
  • Table 25: Western Europe Market Value (USD Million) Forecast by Country, 2020-2035
  • Table 26: Western Europe Market Volume (Units) Forecast by Country, 2020-2035
  • Table 27: Western Europe Market Value (USD Million) Forecast by Type, 2020-2035
  • Table 28: Western Europe Market Volume (Units) Forecast by Type, 2020-2035
  • Table 29: Western Europe Market Value (USD Million) Forecast by Industry Vertical, 2020-2035
  • Table 30: Western Europe Market Volume (Units) Forecast by Industry Vertical, 2020-2035
  • Table 31: Western Europe Market Value (USD Million) Forecast by End User, 2020-2035
  • Table 32: Western Europe Market Volume (Units) Forecast by End User, 2020-2035
  • Table 33: Eastern Europe Market Value (USD Million) Forecast by Country, 2020-2035
  • Table 34: Eastern Europe Market Volume (Units) Forecast by Country, 2020-2035
  • Table 35: Eastern Europe Market Value (USD Million) Forecast by Type, 2020-2035
  • Table 36: Eastern Europe Market Volume (Units) Forecast by Type, 2020-2035
  • Table 37: Eastern Europe Market Value (USD Million) Forecast by Industry Vertical, 2020-2035
  • Table 38: Eastern Europe Market Volume (Units) Forecast by Industry Vertical, 2020-2035
  • Table 39: Eastern Europe Market Value (USD Million) Forecast by End User, 2020-2035
  • Table 40: Eastern Europe Market Volume (Units) Forecast by End User, 2020-2035
  • Table 41: East Asia Market Value (USD Million) Forecast by Country, 2020-2035
  • Table 42: East Asia Market Volume (Units) Forecast by Country, 2020-2035
  • Table 43: East Asia Market Value (USD Million) Forecast by Type, 2020-2035
  • Table 44: East Asia Market Volume (Units) Forecast by Type, 2020-2035
  • Table 45: East Asia Market Value (USD Million) Forecast by Industry Vertical, 2020-2035
  • Table 46: East Asia Market Volume (Units) Forecast by Industry Vertical, 2020-2035
  • Table 47: East Asia Market Value (USD Million) Forecast by End User, 2020-2035
  • Table 48: East Asia Market Volume (Units) Forecast by End User, 2020-2035
  • Table 49: South Asia & Pacific Market Value (USD Million) Forecast by Country, 2020-2035
  • Table 50: South Asia & Pacific Market Volume (Units) Forecast by Country, 2020-2035
  • Table 51: South Asia & Pacific Market Value (USD Million) Forecast by Type, 2020-2035
  • Table 52: South Asia & Pacific Market Volume (Units) Forecast by Type, 2020-2035
  • Table 53: South Asia & Pacific Market Value (USD Million) Forecast by Industry Vertical, 2020-2035
  • Table 54: South Asia & Pacific Market Volume (Units) Forecast by Industry Vertical, 2020-2035
  • Table 55: South Asia & Pacific Market Value (USD Million) Forecast by End User, 2020-2035
  • Table 56: South Asia & Pacific Market Volume (Units) Forecast by End User, 2020-2035
  • Table 57: Middle East & Africa Market Value (USD Million) Forecast by Country, 2020-2035
  • Table 58: Middle East & Africa Market Volume (Units) Forecast by Country, 2020-2035
  • Table 59: Middle East & Africa Market Value (USD Million) Forecast by Type, 2020-2035
  • Table 60: Middle East & Africa Market Volume (Units) Forecast by Type, 2020-2035
  • Table 61: Middle East & Africa Market Value (USD Million) Forecast by Industry Vertical, 2020-2035
  • Table 62: Middle East & Africa Market Volume (Units) Forecast by Industry Vertical, 2020-2035
  • Table 63: Middle East & Africa Market Value (USD Million) Forecast by End User, 2020-2035
  • Table 64: Middle East & Africa Market Volume (Units) Forecast by End User, 2020-2035

List of Figures

  • Figure 1: Global Market Volume (Units) Forecast 2020-2035
  • Figure 2: Global Market Pricing Analysis
  • Figure 3: Global Market Value (USD Million) Forecast 2020-2035
  • Figure 4: Global Market Value Share and BPS Analysis by Type, 2025 and 2035
  • Figure 5: Global Market Y-o-Y Growth Comparison by Type, 2025-2035
  • Figure 6: Global Market Attractiveness Analysis by Type
  • Figure 7: Global Market Value Share and BPS Analysis by Industry Vertical, 2025 and 2035
  • Figure 8: Global Market Y-o-Y Growth Comparison by Industry Vertical, 2025-2035
  • Figure 9: Global Market Attractiveness Analysis by Industry Vertical
  • Figure 10: Global Market Value Share and BPS Analysis by End User, 2025 and 2035
  • Figure 11: Global Market Y-o-Y Growth Comparison by End User, 2025-2035
  • Figure 12: Global Market Attractiveness Analysis by End User
  • Figure 13: Global Market Value (USD Million) Share and BPS Analysis by Region, 2025 and 2035
  • Figure 14: Global Market Y-o-Y Growth Comparison by Region, 2025-2035
  • Figure 15: Global Market Attractiveness Analysis by Region
  • Figure 16: North America Market Incremental $ Opportunity, 2025-2035
  • Figure 17: Latin America Market Incremental $ Opportunity, 2025-2035
  • Figure 18: Western Europe Market Incremental $ Opportunity, 2025-2035
  • Figure 19: Eastern Europe Market Incremental $ Opportunity, 2025-2035
  • Figure 20: East Asia Market Incremental $ Opportunity, 2025-2035
  • Figure 21: South Asia & Pacific Market Incremental $ Opportunity, 2025-2035
  • Figure 22: Middle East & Africa Market Incremental $ Opportunity, 2025-2035
  • Figure 23: North America Market Value Share and BPS Analysis by Country, 2025 and 2035
  • Figure 24: North America Market Value Share and BPS Analysis by Type, 2025 and 2035
  • Figure 25: North America Market Y-o-Y Growth Comparison by Type, 2025-2035
  • Figure 26: North America Market Attractiveness Analysis by Type
  • Figure 27: North America Market Value Share and BPS Analysis by Industry Vertical, 2025 and 2035
  • Figure 28: North America Market Y-o-Y Growth Comparison by Industry Vertical, 2025-2035
  • Figure 29: North America Market Attractiveness Analysis by Industry Vertical
  • Figure 30: North America Market Value Share and BPS Analysis by End User, 2025 and 2035
  • Figure 31: North America Market Y-o-Y Growth Comparison by End User, 2025-2035
  • Figure 32: North America Market Attractiveness Analysis by End User
  • Figure 33: Latin America Market Value Share and BPS Analysis by Country, 2025 and 2035
  • Figure 34: Latin America Market Value Share and BPS Analysis by Type, 2025 and 2035
  • Figure 35: Latin America Market Y-o-Y Growth Comparison by Type, 2025-2035
  • Figure 36: Latin America Market Attractiveness Analysis by Type
  • Figure 37: Latin America Market Value Share and BPS Analysis by Industry Vertical, 2025 and 2035
  • Figure 38: Latin America Market Y-o-Y Growth Comparison by Industry Vertical, 2025-2035
  • Figure 39: Latin America Market Attractiveness Analysis by Industry Vertical
  • Figure 40: Latin America Market Value Share and BPS Analysis by End User, 2025 and 2035
  • Figure 41: Latin America Market Y-o-Y Growth Comparison by End User, 2025-2035
  • Figure 42: Latin America Market Attractiveness Analysis by End User
  • Figure 43: Western Europe Market Value Share and BPS Analysis by Country, 2025 and 2035
  • Figure 44: Western Europe Market Value Share and BPS Analysis by Type, 2025 and 2035
  • Figure 45: Western Europe Market Y-o-Y Growth Comparison by Type, 2025-2035
  • Figure 46: Western Europe Market Attractiveness Analysis by Type
  • Figure 47: Western Europe Market Value Share and BPS Analysis by Industry Vertical, 2025 and 2035
  • Figure 48: Western Europe Market Y-o-Y Growth Comparison by Industry Vertical, 2025-2035
  • Figure 49: Western Europe Market Attractiveness Analysis by Industry Vertical
  • Figure 50: Western Europe Market Value Share and BPS Analysis by End User, 2025 and 2035
  • Figure 51: Western Europe Market Y-o-Y Growth Comparison by End User, 2025-2035
  • Figure 52: Western Europe Market Attractiveness Analysis by End User
  • Figure 53: Eastern Europe Market Value Share and BPS Analysis by Country, 2025 and 2035
  • Figure 54: Eastern Europe Market Value Share and BPS Analysis by Type, 2025 and 2035
  • Figure 55: Eastern Europe Market Y-o-Y Growth Comparison by Type, 2025-2035
  • Figure 56: Eastern Europe Market Attractiveness Analysis by Type
  • Figure 57: Eastern Europe Market Value Share and BPS Analysis by Industry Vertical, 2025 and 2035
  • Figure 58: Eastern Europe Market Y-o-Y Growth Comparison by Industry Vertical, 2025-2035
  • Figure 59: Eastern Europe Market Attractiveness Analysis by Industry Vertical
  • Figure 60: Eastern Europe Market Value Share and BPS Analysis by End User, 2025 and 2035
  • Figure 61: Eastern Europe Market Y-o-Y Growth Comparison by End User, 2025-2035
  • Figure 62: Eastern Europe Market Attractiveness Analysis by End User
  • Figure 63: East Asia Market Value Share and BPS Analysis by Country, 2025 and 2035
  • Figure 64: East Asia Market Value Share and BPS Analysis by Type, 2025 and 2035
  • Figure 65: East Asia Market Y-o-Y Growth Comparison by Type, 2025-2035
  • Figure 66: East Asia Market Attractiveness Analysis by Type
  • Figure 67: East Asia Market Value Share and BPS Analysis by Industry Vertical, 2025 and 2035
  • Figure 68: East Asia Market Y-o-Y Growth Comparison by Industry Vertical, 2025-2035
  • Figure 69: East Asia Market Attractiveness Analysis by Industry Vertical
  • Figure 70: East Asia Market Value Share and BPS Analysis by End User, 2025 and 2035
  • Figure 71: East Asia Market Y-o-Y Growth Comparison by End User, 2025-2035
  • Figure 72: East Asia Market Attractiveness Analysis by End User
  • Figure 73: South Asia & Pacific Market Value Share and BPS Analysis by Country, 2025 and 2035
  • Figure 74: South Asia & Pacific Market Value Share and BPS Analysis by Type, 2025 and 2035
  • Figure 75: South Asia & Pacific Market Y-o-Y Growth Comparison by Type, 2025-2035
  • Figure 76: South Asia & Pacific Market Attractiveness Analysis by Type
  • Figure 77: South Asia & Pacific Market Value Share and BPS Analysis by Industry Vertical, 2025 and 2035
  • Figure 78: South Asia & Pacific Market Y-o-Y Growth Comparison by Industry Vertical, 2025-2035
  • Figure 79: South Asia & Pacific Market Attractiveness Analysis by Industry Vertical
  • Figure 80: South Asia & Pacific Market Value Share and BPS Analysis by End User, 2025 and 2035
  • Figure 81: South Asia & Pacific Market Y-o-Y Growth Comparison by End User, 2025-2035
  • Figure 82: South Asia & Pacific Market Attractiveness Analysis by End User
  • Figure 83: Middle East & Africa Market Value Share and BPS Analysis by Country, 2025 and 2035
  • Figure 84: Middle East & Africa Market Value Share and BPS Analysis by Type, 2025 and 2035
  • Figure 85: Middle East & Africa Market Y-o-Y Growth Comparison by Type, 2025-2035
  • Figure 86: Middle East & Africa Market Attractiveness Analysis by Type
  • Figure 87: Middle East & Africa Market Value Share and BPS Analysis by Industry Vertical, 2025 and 2035
  • Figure 88: Middle East & Africa Market Y-o-Y Growth Comparison by Industry Vertical, 2025-2035
  • Figure 89: Middle East & Africa Market Attractiveness Analysis by Industry Vertical
  • Figure 90: Middle East & Africa Market Value Share and BPS Analysis by End User, 2025 and 2035
  • Figure 91: Middle East & Africa Market Y-o-Y Growth Comparison by End User, 2025-2035
  • Figure 92: Middle East & Africa Market Attractiveness Analysis by End User
  • Figure 93: Global Market - Tier Structure Analysis
  • Figure 94: Global Market - Company Share Analysis

Frequently Asked Questions

How big is the Titration Sensors Market in 2025?

The global titration sensors market is estimated to be valued at USD 128.6 million in 2025, supported by strong demand from water treatment plants, chemical production facilities, and pharmaceutical quality control laboratories that rely on precise electrochemical measurements.

What will be the size of the Titration Sensors Market in 2035?

The market is projected to reach approximately USD 184.4 million by 2035, reflecting the wider adoption of IoT-enabled sensors, automation in high-throughput laboratories, and the replacement of conventional electrodes with high-precision, long-life variants.

What is the expected CAGR for the Titration Sensors Market from 2025 to 2035?

The market is forecast to expand at a CAGR of 3.7% during this period, driven by stricter water quality regulations, pharmaceutical R&D expansion in the USA and India, and the modernization of industrial laboratories in East Asia and Europe.

Which sensor type is expected to dominate the Titration Sensors Market?

pH sensors are expected to maintain the largest share in 2025, accounting for 46% of global demand. Their dominance comes from widespread use in pharmaceutical titrations, water treatment monitoring, and chemical analysis. In Japan, pH sensors alone account for 40% of the market, reflecting the country’s emphasis on accuracy in electronics and life sciences.

What is the leading industry vertical in the Titration Sensors Market?

Water treatment is projected to be the leading industry vertical in 2025, contributing 37% of total revenue, as governments and private utilities invest in advanced monitoring systems for municipal water quality, wastewater management, and desalination plants.

Who are the key players in the global Titration Sensors Market?

Key companies include Metrohm AG, Mettler-Toledo International Inc., Hach (Danaher Corporation), Hamilton Company, HORIBA Ltd., DKK-TOA Corporation, Thermo Fisher Scientific, and Hanna Instruments. These players compete on compliance readiness, sensor longevity, and service support across industrial and research laboratory applications.

Explore Similar Insights

Future Market Insights

Titration Sensors Market