
- Market Size (2026)
- USD 57200.0 Mn
- Forecast (2036)
- USD 88829.9 Mn
- CAGR (2026 to 2036)
- 4.5%
How big is the Truck and Bus Radial Tire Market in 2026?
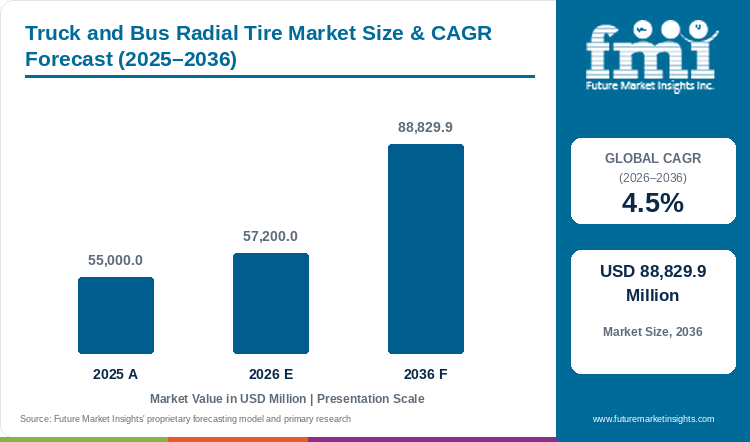
The global truck and bus radial tire market is on course to reach USD 88,829.9 million by 2036, a 4.5% CAGR from 2026 to 2036. The market was valued at USD 55,000.0 million in 2025 and is estimated at USD 57,200.0 million in 2026.
Truck and Bus Radial Tire Market Size and Forecast
Table 1: Truck and Bus Radial Tire Market Size and Forecast
| Market size and forecast | Value |
|---|---|
| Market size in 2025 | USD 55,000.0 million |
| Estimated market size in 2026 | USD 57,200.0 million |
| Projected market size by 2036 | USD 88,829.9 million |
| CAGR from 2026 to 2036 | 4.5% |
Source: Future Market Insights analysis of the truck and bus radial tire market, 2026.
Factory location is becoming a sharper commercial dividing line in this market. Continental announced the end of Indian truck and bus radial tire manufacturing in June 2025 after finding premium positioning difficult in a highly price-sensitive segment. Bridgestone announced the closure of its LaVergne truck and bus radial plant effective July 2025. Those decisions show that recurring replacement demand does not protect every manufacturing footprint. A plant still needs the right cost structure for the products and customers it serves.
Investment is proceeding elsewhere. Hankook began construction of a EUR 540.0 million Hungarian truck-tire expansion in February 2025, with completion scheduled for 2027. Apollo subsequently outlined a European supply strategy based on Indian manufacturing and European technical support. These are different routes to the same account: a fleet that needs predictable replenishment of approved sizes. FMI's view is that the strongest bids will connect tire performance with the commercial cost of maintaining that supply.
Key Market Trends & Insights
- European sourcing is separating engineering location from manufacturing location. Apollo's December 2025 strategy paired European development with a planned relocation of truck and bus radial production to India. This puts greater weight on field support when an imported tire is introduced to a fleet.
- Application coverage is widening within individual brands. Hankook's 2025 Smart announcement separated long-haul, all-condition and electric commercial vehicle products, which makes a complete axle and duty offering more valuable than one successful tread.
- Replacement and original-equipment channels are diverging. Japanese truck and bus replacement tire sales increased 4.5% in 2025, while original-equipment sales slipped 0.9%. The two channels require separate stock and sales plans.
Regional Highlights
- India, China and Indonesia are gaining share of global revenue. Projected 2036 shares are India 8.3% (from 7.0%), China 22.6% (from 22.0%) and Indonesia 2.8% (from 2.5%).
- Share slips for the United States, Japan and Germany as revenue grows. FMI projects the United States from 18.0% to 16.8%, Japan from 4.0% to 3.2% and Germany from 3.0% to 2.5% by 2036.
Analyst Perspective
“FMI expects replacement accounts to remain the commercial center of this market. A manufacturer must earn the second order after the first fitment has been measured on a real route. Mileage claims carry limited weight if a fleet cannot obtain matching tires when vehicles return to the depot. Casing recovery and the cost of irregular wear should sit beside invoice price in that assessment. Suppliers that support this comparison with usable field records have a clearer route to retaining accounts through a weak new-truck cycle.”
- Nikhil Kaitwade, Principal Consultant, FMI
How is the Truck and Bus Radial Tire Market segmented?
- By sales channel: Replacement, Original equipment, and Retread-linked new casings.
- By vehicle: Heavy trucks, Light and medium trucks, and Buses and coaches.
- By position: Drive, Steer, Trailer, and All-position.
- By region: North America, Latin America, Western Europe, Eastern Europe, East Asia, South Asia, Southeast Asia, Europe and Western Asia, and Rest of world.
Why does the Replacement segment lead by Sales Channel in the Truck and Bus Radial Tire Market in 2026?
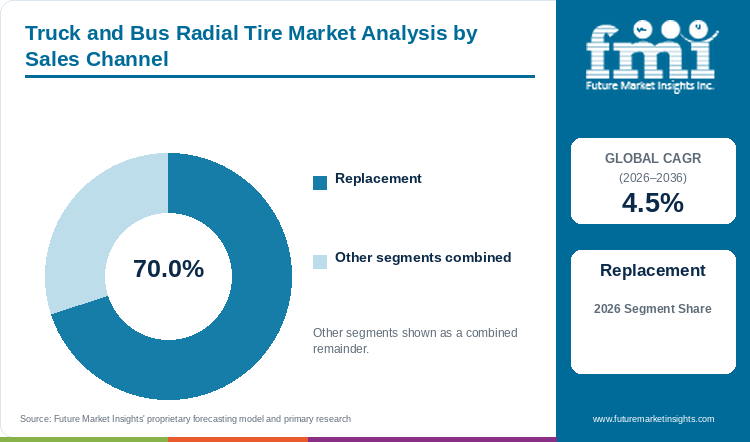
The Replacement segment holds 70.0% of the Truck and Bus Radial Tire Market by sales channel in 2026.
Replacement holds USD 40,040.0 million of 2026 market value. FMI projects a 4.7% CAGR for this channel through 2036. The share reflects recurrent purchases across the installed truck and bus population.
The US Tire Manufacturers Association's August 2025 outlook illustrated the distinction: it expected replacement truck shipments to rise while truck original-equipment shipments fell. For a tire manufacturer, that split changes which inventory matters. An assembly contract delivers a known fitment schedule. A replacement program must cover several wear patterns and sizes without leaving a dealer carrying slow stock.
FMI sees the dealer's availability promise as a source of pricing discipline. The fleet needs a sufficiently broad range to replace a tire without disrupting its normal rotation plan. This creates room for a second approved brand, particularly when the primary supplier has an uneven replenishment cycle. It also limits the value of excessive catalogue expansion. A size earns shelf space through repeat demand and acceptable working-capital use. The wider commercial vehicle market provides vehicle-population context.
Original equipment and Retread-linked new casings together hold the remaining 30.0% by sales channel.
Table 2: Sales Channel, 2026 Share
| Leading Share | 2026 market share |
|---|---|
| Replacement | 70.0% |
| All Other Segments Combined Share | 30.0% |
Source: Future Market Insights analysis of the truck and bus radial tire market, 2026.
Why does the Heavy trucks segment lead by Vehicle in the Truck and Bus Radial Tire Market in 2026?
The Heavy trucks segment holds 62.0% of the Truck and Bus Radial Tire Market by vehicle in 2026.
Heavy-truck tire revenue is assessed at USD 35,464.0 million in 2026. The category expands at a 4.6% CAGR through 2036. Its commercial importance comes from the number of working axle positions and the different duties represented within a fleet account. A line-haul tractor and a construction truck may fall within the same vehicle class while requiring different tread behavior.
Electrification adds another distinction. ICCT's June 2026 assessment recorded approximately 232,000 zero-emission heavy trucks and tractor-trailers sold in China during 2025. That finding supports examination of new fitment requirements in China.
In FMI's assessment, heavy-truck leadership will reward suppliers that maintain a clear division between highway and mixed-service offers. A distributor that substitutes one tread because it has the right size risks losing the operator's confidence when removal patterns deteriorate. Tire makers therefore need to preserve breadth while making the specification decision easier. That is a more durable commercial proposition than presenting every new compound as suitable for all freight work.
Light and medium trucks and Buses and coaches together hold the remaining 38.0% by vehicle.
Table 3: Vehicle, 2026 Share
| Leading Share | 2026 market share |
|---|---|
| Heavy trucks | 62.0% |
| All Other Segments Combined Share | 38.0% |
Source: Future Market Insights analysis of the truck and bus radial tire market, 2026.
Why does the Drive segment lead by Position in the Truck and Bus Radial Tire Market in 2026?
The Drive segment holds 38.0% of the Truck and Bus Radial Tire Market by position in 2026.
The drive category is valued at USD 21,736.0 million in 2026 and reaches a 38.3% share in 2036. Position-specific buying remains important because traction requirements and wear expectations differ across a vehicle. A single fleet purchase can therefore involve several product families.
Continental's Generation 5 portfolio distinguishes steer and drive products within its Conti Eco offering and connects new tires with lifecycle services.That structure demonstrates how a supplier competes for an axle package.
FMI expects drive-tire choice to remain sensitive to the routes on which a fleet earns revenue. A regional operator returning to a depot can organize inspections differently from a long-haul carrier with vehicles dispersed across several countries. Those service patterns affect the acceptable stock arrangement and the value of dealer coverage. Buyers also need to compare replacement costs at a consistent removal condition. A long first life obtained at the expense of casing condition may not produce the best overall result. This links drive-tire procurement with the related tire pressure monitoring systems market.
Steer, Trailer and All-position together hold the remaining 62.0% by position.
Table 4: Position, 2026 Share
| Leading Share | 2026 market share |
|---|---|
| Drive | 38.0% |
| All Other Segments Combined Share | 62.0% |
Source: Future Market Insights analysis of the truck and bus radial tire market, 2026.
What are the key drivers restraints and opportunities?
Fleet replacement supports recurring orders, price pressure limits manufacturing returns, and application-specific supply programs create room for differentiation.
Driver
Tires consumed by vehicles already operating keep replenishment separate from the new-truck assembly cycle. Broader tire demand across vehicle classes is covered in FMI's automotive tire market.
Restraint
Premium manufacturing economics are difficult to sustain where a large invoice-price premium is not recovered through demonstrable fleet performance.
Opportunity
Suppliers can win accounts by combining route-appropriate tires with replenishment and casing-management commitments.
How do purchasing rules and qualification affect truck and bus radial tire market demand?
An operator postponing a new truck purchase still needs tires for the vehicle it keeps running. Replacement demand can consequently remain active when original-equipment orders soften. Japan's 2025 channel split provides a concrete example of these different cycles. FMI's outlook gives replacement a larger share by 2036, but that growth is unlikely to be evenly distributed among brands. Distributor reach and repeat acceptance after trial fitment remain decisive.
Bus operators add another source of demand with a different buying rhythm. A city-bus contract places greater emphasis on consistent fitment across a depot and predictable service response. An intercity coach operator has a different route pattern. Giti's commercial portfolio separates urban bus and intercity coach applications. A useful supplier offer recognizes these distinctions instead of treating all passenger transport as one tender specification.
What limits reliable truck and bus radial tire market supply and quality?
One producer's announced Indian exit identifies the restraint more precisely than a general statement about raw-material costs. The company cited intense competition and price sensitivity when announcing the end of local TBR production. The risk is that manufacturing cost and the customer's willingness to pay remain out of alignment for too long. Extra capacity then amplifies the problem instead of solving it.
Tire manufacturers also need to protect the economics of the distribution channel. A dealer unable to recover inventory and service costs may shift toward whichever brand can replenish the most frequently requested sizes. A lower factory price is therefore only one part of a competitive delivered offer. The upstream tire materials market affects production economics, while this forecast measures finished new tires.
Where can suppliers win additional business in the truck and bus radial tire market?
The practical opening is a trial that can become a repeat procurement program. Suppliers should agree the route, axle position and removal criteria before comparing performance. Otherwise, claims made for different duties are difficult for an operator to assess. The commercial aim is a defensible replacement schedule supported by the tires that are actually available.
One producer's planned Hungarian line is designed to cover long-distance, regional and mixed applications. Such breadth creates an opportunity to bid for more of a fleet's work, provided production reaches the announced stage and local support follows. FMI expects tire makers to gain more from retaining a credible application boundary than from promising the same performance everywhere.
Truck and Bus Radial Tire Market by Country (2026 to 2036)
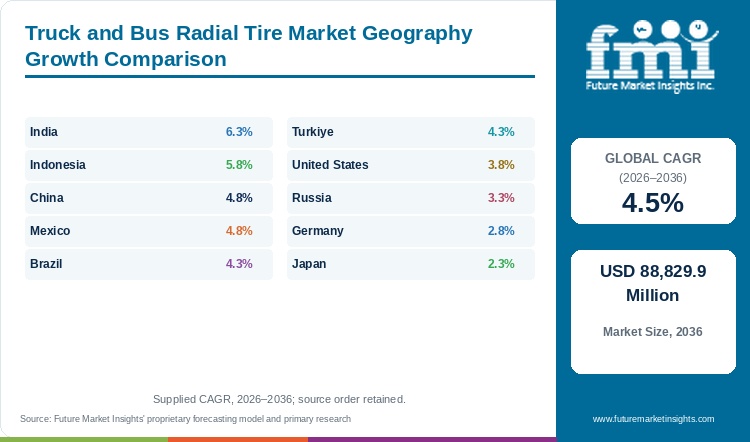
Table 5: Truck and Bus Radial Tire Market Country Growth Forecast
| Country | CAGR, 2026 to 2036 |
|---|---|
| India | 6.3% |
| Indonesia | 5.8% |
| China | 4.8% |
| Mexico | 4.8% |
| Brazil | 4.3% |
| Turkiye | 4.3% |
| United States | 3.8% |
| Russia | 3.3% |
| Germany | 2.8% |
| Japan | 2.3% |
Source: Future Market Insights analysis of the truck and bus radial tire market, 2026.
India
India shows why market growth and individual producer returns need to be considered separately. Apollo reported more than 20.0% growth in truck-bus radials during the January to March quarter of FY2025-26. Another producer had already announced an end to Indian TBR manufacturing after citing price sensitivity. These disclosures are company-specific, but together they caution against assuming that a rising category delivers the same outcome to every producer.
FMI forecasts India's market to increase at a 6.3% CAGR during 2026 to 2036. Revenue rises from USD 4,004.0 million in 2026 to USD 7,352.2 million by 2036. Growth at this rate is the highest of the ten named countries. The opportunity depends on retaining commercial discipline as domestic suppliers compete across replacement and original-equipment accounts.
For a fleet, radial-tire procurement involves the price paid today and the pattern of repeat spending. Operators that use different vehicle classes need a product range that reflects those duties. For a manufacturer, covering the range means deciding which sizes justify continued local stock and technical attention. Broad distribution without sufficient repeat sales can tie up working capital. Narrow distribution can leave an approved product out of stock when the vehicle needs it.
FMI expects Indian suppliers to benefit when they turn product trials into routine replacement orders. The case is stronger when a fleet can track removal condition and casing acceptance over several purchase cycles. A short promotional discount offers less evidence of a sustainable account than that record of repeat use.
Indonesia
Indonesia's commercial tire offer already distinguishes between freight routes and passenger transport duties. Giti's local commercial site separates long-haul and regional trucking from mixed-road dump-truck work. It also lists intercity coaches and city buses separately. These product divisions make a useful starting point for assessing how a tire supplier earns repeat fleet orders.
Indonesia is projected to expand at a 5.8% CAGR during 2026 to 2036. FMI estimates revenue at USD 1,430.0 million in 2026 and USD 2,504.5 million in 2036. This is the second-fastest growth rate among the named countries. The resulting opportunity includes several duties that should not be compressed into a single replacement specification.
FMI expects distributors to gain from understanding the actual balance of work within each account. A freight operator whose vehicles change between highway and more demanding local access routes needs a different evaluation from a coach operator. The supplier should explain those limits before a trial begins. If a product is used outside its intended duty, a weak result can damage the whole brand relationship even when another tread would have suited the job.
Casing management provides another route to retention where the operator uses later retread cycles. The original new-tire purchase has to fit that program and the associated inspection practice. A low invoice price will not necessarily preserve an account if it produces inconsistent replacement timing or a poor recovery of usable casings. The commercial aim is a repeatable supply arrangement for the fleet's working conditions.
China
China combines the largest national revenue base with a rapid change in heavy-vehicle powertrains. ICCT reported that zero-emission medium- and heavy-duty vehicle sales reached 457,000 units in 2025, almost twice the previous year's level. For tire purchasing, the important point is the growth of new operating configurations within a very large commercial fleet. Tire makers need application evidence from those configurations before assuming that established fitments will remain the preferred option.
FMI estimates Chinese revenue at USD 12,584.0 million in 2026 and forecasts a 4.8% CAGR from 2026 to 2036. The market reaches USD 20,037.6 million in 2036. This remains a revenue forecast for new radial tires sold into Chinese demand. It is separate from Chinese manufacturers' export shipments and from the value of vehicles manufactured in the country. In the truck and bus radial tire market, China grows 4.8% a year, 0.3 points above the global rate.
An exporter can grow outside China without increasing domestic replacement consumption. Conversely, a local fleet adopting a different truck platform can change its tire specification without materially increasing its vehicle count. FMI therefore expects competition to depend on product mix as well as the scale of the installed fleet. Local trial programs should compare tires on the relevant load and route, with replacement availability included in the decision. Selling a broad catalogue at an attractive initial price will be less useful if the operator subsequently has to mix fitments.
Mexico
Mexico's truck-tire demand should not be reduced to its vehicle-export output. ANPACT's year-end 2025 assessment reported declines in heavy-vehicle production and exports alongside weakness in the domestic market. The manufacturer association also called for fleet-renewal financing and stronger regional integration in its March 2026 trade-review statement. Those concerns affect original-equipment demand differently from the tires needed by trucks already operating.
FMI forecasts a 4.8% CAGR for Mexico from 2026 to 2036. Revenue is assessed at USD 1,716.0 million in 2026 and USD 2,732.4 million by 2036. The outlook therefore requires an assessment of replacement purchasing as well as new vehicle sales. Mexico posts 4.8% annual growth against 4.5% for the global market, 0.3 points above the global rate. In the truck and bus radial tire market, Mexico ranks joint sixth of ten on 2026 revenue.
For distributors, the useful planning question is which customer activity generates the order. A new-truck delivery fixes the initial fitment. An older fleet requires replenishment according to wear and operating schedules. The two demand streams can move in different directions. FMI expects dealers that understand this distinction to be better placed when allocating inventory and sales effort during a weak assembly period.
Cross-border operations introduce a separate service consideration. A fleet needs clarity on whether an approved product can be supported where its vehicles travel. Matching a tire specification is only the start of that discussion. The buyer should also establish the replacement arrangements before committing an account.
Brazil
Imported cargo tires are putting direct pressure on Brazil's domestic producers. ANIP's September 2026 statement placed imports at 72.0% of the cargo-tire replacement market during January to August. The association reported domestic replacement sales of 2.8 million cargo tires in that period.
Brazil is expected to record a 4.3% CAGR from 2026 to 2036 in FMI's assessment. New truck and bus radial tire revenue increases from USD 2,860.0 million to USD 4,340.7 million. A growing revenue pool can coexist with a loss of share for particular local factories. This is the central issue for the competitive outlook. The USD 1,480.7 million rise over the decade ranks Brazil fourth for increase.
FMI expects the immediate contest to be between the delivered imported offer and the full domestic service proposition. A distributor can widen its assortment quickly by adding overseas brands, but it then has to support replacements and manage the credit tied up in stock. Local suppliers have to show why their product and support justify a different purchase price. Claims about overall national manufacturing strength will not resolve an operator's route-level comparison.
The Pirelli name also requires care in this market. Its annual report records industrial-tire distribution transactions involving products mainly sourced from Prometeon. A familiar brand in a Brazilian sales channel therefore does not necessarily identify the industrial manufacturer. Buyers should distinguish the producer, trademark and distributing company when comparing offers.
Turkiye
Turkiye has an established connection between tire supply and fleet services. Brisa's 2025 annual report describes its Bridgestone partnership and the integration of its tire and service network with Arvento's fleet-management platform. That combination illustrates a local commercial route beyond a standalone tire invoice. It links the tire discussion to the operator's wider management of vehicles without making every service revenue part of the new-tire market.
FMI forecasts a 4.3% CAGR for Turkiye during 2026 to 2036. Revenue grows from USD 1,430.0 million to USD 2,170.4 million. The market shares the need for new fitments and continuing replacement demand, but an operator's purchasing decision depends on its own mix of duties and service coverage.
FMI expects the main opportunity to lie in making a fleet agreement commercially specific. A promise of support needs to identify what tires are stocked and how a customer receives assistance. Data from vehicles can inform that discussion, but the tire supplier still needs the right product range and physical distribution.
Buyers should also distinguish a manufacturing company from a brand licence or dealer relationship. That is especially relevant when comparing international tire names with local production and service organizations. The practical objective is to establish who provides the tire and who is responsible for the subsequent commercial commitment. This clarity supports a more useful comparison than a broad ranking of brand size or global revenue.
United States
Manufacturing changes make the US supply position more complicated than a simple reshoring narrative. One producer announced a Tennessee truck-tire plant closure in January 2025, while another described a separate Tennessee expansion that included planned TBR capacity. They concern different assets and show how producers are changing their own cost and product positions.
The United States is forecast by FMI to expand at a 3.8% CAGR between 2026 and 2036. Revenue moves from USD 10,296.0 million to USD 14,891.4 million over that period. It remains the second-largest named national market in the assessment. A supplier seeking this demand has to serve the existing fleet as well as obtain original-equipment fitments.
FMI's commercial reading is that the dealer network carries much of the practical burden when factory footprints change. Customers need clarity on which sizes remain available and the terms for replacing a casing already in service. A plant announcement does not by itself guarantee that inventory has reached the right distribution point. Fleets also need to avoid treating all domestic production as equivalent. The chosen tire must fit its route and axle requirement before origin becomes a useful purchasing advantage.
The replacement account consequently offers a stronger basis for comparison than a general brand reputation. A fleet can measure whether the tires arrive consistently and whether the supplier resolves removal problems without delaying vehicles. Those outcomes help determine how much of the account stays with the brand.
Russia
Supplier identity requires particular attention in Russia. Michelin announced the sale of its two local companies to Power International Tires in May 2023 after suspending industrial activities and exports. That historical change remains relevant when interpreting older references to the company's Russian presence.
FMI projects Russia's new truck and bus radial tire revenue to grow at a 3.3% CAGR between 2026 and 2036. The assessment moves from USD 1,716.0 million to USD 2,364.6 million. This is a forecast of national demand and does not assign the increase to any particular international brand. In the truck and bus radial tire market, Russia's 3.3% CAGR sits 1.2 points below the global 4.5%. Russia's 2026 revenue ranks joint sixth of ten. Over the decade, revenue in Russia grows 1.4 times and the global total 1.6 times.
FMI's reading is that continuity of supply is a major commercial test when routes to market change. A fleet buying through a different importer needs to know the actual contracting party and the practical arrangements for replacement stock.
The range of suitable fitments also matters. Operators cannot evaluate an alternative brand only on the tire initially offered if their fleets contain several axle and vehicle configurations. A workable supplier relationship has to support repeat procurement across those requirements. FMI consequently sees dealer capability and the clarity of the commercial obligation as meaningful differentiators alongside the product.
Germany
German buyers can compare tire label information before assessing a fleet trial. Regulation (EU) 2020/740 provides a common framework covering fuel efficiency, wet grip and external rolling noise. It gives procurement teams a defined set of declared characteristics, but it does not replace their own operating-cost analysis. A label does not describe every route condition or the service performance of a distributor.
FMI expects Germany to grow at a 2.8% CAGR from 2026 to 2036. Revenue increases from USD 1,716.0 million to USD 2,252.3 million. This relatively measured expansion places emphasis on account retention and specification value. Suppliers cannot rely on a large increase in new fleets to make up for lost replacement business.
The relevant commercial question is how a tire performs across the customer's purchase cycle. A long-haul operator should compare products under consistent duty and removal criteria. A bus operator will use a different working pattern. FMI expects the most useful technical discussions to connect the documented tire characteristics with these specific conditions.
Lifecycle services also remain relevant to the new-tire sale. A 2025 discussion of the ContiLifeCycle offer connected new Generation 5 products with casing reuse. For a buyer, the implication is to examine the planned later life at the first purchase. A new tire's commercial value can be weakened if its casing is unsuitable for the fleet's subsequent program.
Japan
Seasonal replacement is a material part of Japanese truck and bus tire purchasing. JATMA reported that winter products represented 49.1% of 2025 replacement truck and bus tire sales. Its summer category includes all-season tires. This makes the timing of demand important to inventory decisions.
FMI forecasts Japan at a 2.3% CAGR during 2026 to 2036. Revenue rises from USD 2,288.0 million in 2026 to USD 2,859.7 million in 2036. The rate is the lowest among the named countries, but the market remains commercially significant. Mature fleet purchasing can sustain valuable repeat accounts without a large increase in vehicle numbers.
FMI's view is that suppliers should pay particular attention to stock transition between seasonal ranges. Carrying too little product risks losing an established fleet at the changeover. Carrying too much of a slow-moving specification creates a different cost problem. The answer depends on the operator's actual fitments and replacement schedule, not simply on a forecast of national transport growth.
Japan also provides a useful boundary between production and demand. JATMA publishes manufacturing, original-equipment sales and replacement sales as separate measures. Domestic factory output should therefore not be treated as domestic consumption. Tire makers serving exports and the home market need different commercial plans. Buyers evaluating continuity of supply should check the relevant distribution arrangement instead of infer availability from a producer's overall output.
Who are the notable companies in the Truck and Bus Radial Tire Market?
Notable companies in the Truck and Bus Radial Tire Market include Michelin, Bridgestone, Goodyear, Continental and Hankook Tire.
The competitive structure is broader than a ranking of tire-group revenue. Michelin, Bridgestone, Goodyear and Continental compete across established commercial tire operations. Their approaches to an individual market still depend on the location of production and the way a fleet is served. The changes announced by Bridgestone and Continental during 2025 show why a global manufacturing name should not be treated as a fixed local production footprint.
Hankook Tire and Apollo Tyres illustrate contrasting supply strategies. One announced new European TBR production, while the other described greater reliance on India for European supply. Both need a credible local commercial offer. Tire choice is therefore influenced by product development and field support as well as plant proximity.
Sumitomo Rubber Industries, Yokohama Rubber, Zhongce Rubber, Triangle Tyre, Sailun Group, Linglong Tire, Giti Tire and MRF form part of the wider company coverage. These names should be assessed at the relevant product and regional level. Pirelli requires a different description: its 2025 annual report identifies industrial tires purchased mainly from Prometeon and resold through its network, primarily in Brazil. That is a distribution relationship instead of evidence that its consumer-focused manufacturing business should be assigned an independent TBR production share.
Key Developments in the Truck and Bus Radial Tire Market
- In October 2026, Tire Review reported that Hankook was expanding truck tire production at its Clarksville, Tennessee plant. The report states full-capacity output of about 1.0 million medium truck tires a year.
Key Players in the Truck and Bus Radial Tire Market
- Michelin
- Bridgestone
- Goodyear
- Continental
- Hankook Tire
- Sumitomo Rubber Industries
- Yokohama Rubber
- Apollo Tyres
- Pirelli, through industrial-tire distribution and licensing relationships
- Zhongce Rubber
- Triangle Tyre
- Sailun Group
- Linglong Tire
- Giti Tire
- MRF
Truck and Bus Radial Tire Market Report Scope
Table 6: Truck and Bus Radial Tire Market Report Scope
| Coverage field | Report scope |
|---|---|
| Market definition | New radial tires for trucks and buses across steer, drive, trailer and all-position applications. |
| Revenue boundary | First-sale new-tire revenue through original equipment, replacement and separately classified retread-linked new-casing supply. |
| Exclusions | Completed retreads, used tires, bias tires, passenger-car tires and separately charged fleet software or service revenue. |
| Quantitative Units | USD million |
| Segment coverage | Sales Channel, Vehicle and Position. |
| Named country coverage | China, United States, India, Brazil, Japan, Germany, Russia, Mexico, Indonesia and Turkiye. |
| Additional geography | Rest of world as a combined aggregate. |
| Competitive coverage | Fifteen named companies, with manufacturing distinguished from documented distribution and licensing roles. |
Source: Future Market Insights analysis of the truck and bus radial tire market, 2026.
Truck and Bus Radial Tire Market Research Methodology
This assessment combines FMI's numerical outlook with a secondary review of company disclosures, tire-industry association publications, vehicle-market statements and regulatory material. Revenue and volume are reviewed as separate measures. The analysis preserves the distinction between first-sale new tires, completed retreads and separately sold services. Competitive interpretation follows the disclosed product and geographic scope of each source, while planned factories retain their stated development status.
Truck and Bus Radial Tire Market by Segments
Truck and Bus Radial Tire Market segmented by Sales Channel:
- Replacement
- Original equipment
- Retread-linked new casings
Truck and Bus Radial Tire Market segmented by Vehicle:
- Heavy trucks
- Light and medium trucks
- Buses and coaches
Truck and Bus Radial Tire Market segmented by Position:
- Drive
- Steer
- Trailer
- All-position
Truck and Bus Radial Tire Market by Region
- North America
- United States
- Mexico
- Latin America
- Brazil
- Western Europe
- Germany
- Eastern Europe
- Russia
- East Asia
- China
- Japan
- South Asia
- India
- Southeast Asia
- Indonesia
- Europe and Western Asia
- Turkiye
- Rest of world
Research Sources and Bibliography
- ANIP. (2026, September 24; website publication October 7). Importação de pneus avança 58% no ano, desequilibra mercado e coloca indústria nacional em alerta. https://www.anip.org.br/releases/importacao-de-pneus-avanca-58-no-ano-desequilibra-mercado-e-coloca-industria-nacional-em-alerta/
- ANPACT. (2026, January 12 and March 10). Heavy-Vehicle Industry 2025 Closing Results and ANPACT's T-MEC Review Statement. Original association press archive accessed November 9, 2026. https://www.anpact.mx/index.php/modern-right-sidebar-2?start=9
- Apollo Tyres. (2025, December 8). New Production Strategy Will Enhance Choice and Ramp Up Supply of TBR Tyres in Europe. https://apollovredestein.press/apollo-tyres-new-production-strategy-will-enhance-choice-and-ramp-up-supply-of-tbr-tyres-in-europe/
- Apollo Tyres. (2026; accessed November 9). Apollo Tyres Q4 FY26 Revenue Up 14%. https://corporate.apollotyres.com/press-and-media/news/financial/q4-fy26/
- Bridgestone Americas. (2025, January 23). Business Footprint Optimization and Closure of its LaVergne Plant. https://www.bridgestoneamericas.com/en/newsroom/press-releases/2025/bridgestone-announces-business-footprint-optimization
- Brisa Bridgestone Sabancı. (2026, February 27). Board of Directors' Annual Report for January 1 to December 31, 2025. https://www.brisa.com.tr/uploads/docs/Brisa_Board_of_Directors_Annual_Report_2025.pdf
- Continental. (2025, January 28). Neue Reifen stehen für Langlebigkeit und unterstützen das ganzheitliche ContiLifeCycle-Konzept. https://www.continental.com/de/presse/pressemitteilungen/20250128-contilifecycle/
- Continental. (2025, June 2). Continental Tires Announces Strategic Realignment of its Product Portfolio in India. https://www.continental.com/en/press/press-releases/20250602-india-strategic-realignment/
- European Parliament and Council. (2020, May 25). Regulation (EU) 2020/740 on the Labelling of Tyres with Respect to Fuel Efficiency and Other Parameters. Current text accessed November 9, 2026. https://eur-lex.europa.eu/legal-content/EN/TXT/?uri=celex%3A32020R0740
- Giti Tire. (Undated; accessed November 9, 2026). Giti Truck & Bus Tires: Indonesian Commercial Tire Portfolio. https://www.gitifleet.co.id/en
- Hankook Tire. (2025, February 26). New Production Line for Truck and Bus Tyres: Hankook Commences Expansion of its European Plant. https://www.hankooktire-mediacenter.com/press-release/news/new-production-line-for-truck-and-bus-tyres-hankook-commences-expansion-of-its-european-plant
- Hankook Tire. (2025, March 21). New Smart Truck Tires and Tennessee TBR Plant Expansion at TMC 2025. https://www.hankooktire.com/us/en/company/media-center/media-detail.631133.html
- Japan Automobile Tyre Manufacturers Association. (2026; accessed November 9). Trends in Production / Sales: 2025 Results. https://www.jatma.or.jp/english/tyre_industry/production_sales.html
- Mao, S., Li, S., and Chu, Y. (2026, June 16). Zero-Emission Medium- and Heavy-Duty Vehicle Market in China: A 2025 Update. International Council on Clean Transportation. https://theicct.org/publication/zero-emission-medium-and-heavy-duty-vehicle-market-in-china-a-2025-update-may26/
- Michelin. (2023, May 26). Michelin Is Selling its Activities in Russia to Power International Tires LLC. https://dgaddcosprod.blob.core.windows.net/cxf-corporate/attachments/clktde89p09la2fhhg02l4g05-26052023-cp-russie-eng.pdf
- Pirelli & C. S.p.A. (2026). Annual Report 2025, industrial-product sales and Prometeon-related transactions. https://corp-assets.pirelli.com/corporate/Annual_Report_Pirelli_2025_ENG.pdf
- Tire Review. (2026, October 6). Hankook Expands U.S. Truck Tire Production. https://www.tirereview.com/hankook-truck-tire-production-tennessee-whats-treading/
- US Tire Manufacturers Association. (2025, August 7). July 2025 Forecast Predicts Higher 2025 Tire Shipments for US Tire Market. https://www.ustires.org/newsroom/ustma-july-2025-forecast
This bibliography is provided for reader reference and is not exhaustive. The full report contains the complete reference list and detailed citations.
Table of Content
- Key Takeaways
- Market Size and CAGR
- Top Growth Driver
- Fastest Growing Segment
- Leading Region
- Key Companies
- Emerging Opportunities
- Executive Summary
- Global Market Outlook
- Demand-side Trends
- Supply-side Trends
- Technology Roadmap Analysis
- Analysis and Recommendations
- Analyst Perspective (What is happening? Why now? What should investors know?)
- Key Questions Answered
- How large is the market?
- What is the CAGR?
- What are key trends?
- Which region dominates?
- Who are the leaders?
Read More...
- Market Overview
- Market Coverage / Taxonomy
- Market Definition / Scope / Limitations
- Research Methodology
- Chapter Orientation
- Analytical Lens and Working Hypotheses
- Market Structure, Signals, and Trend Drivers
- Benchmarking and Cross-market Comparability
- Market Sizing, Forecasting, and Opportunity Mapping
- Research Design and Evidence Framework
- Desk Research Programme (Secondary Evidence)
- Expert Input and Fieldwork (Primary Evidence)
- Tooling, Models, and Reference Databases
- Data Engineering and Model Build
- Quality Assurance and Audit Trail
- Market Background
- Market Dynamics (Drivers, Restraints, Opportunity, Trends)
- Scenario Forecast (Optimistic, Likely, Conservative)
- Impact Analysis
- AI Impact
- Sustainability Impact
- Regulatory Impact
- Technology Impact
- Consumer / Buyer Analysis
- Purchase Drivers
- Adoption Barriers
- Buyer Journey
- Opportunity Map Analysis
- Product Life Cycle Analysis
- Supply Chain Analysis
- Investment Feasibility Matrix
- Value Chain Analysis
- PESTLE and Porter's Analysis
- Regulatory Landscape
- Regional Parent Market Outlook
- Production and Consumption Statistics
- Import and Export Statistics
- Global Market Analysis and Forecast, 2021 to 2036
- Historical Market Size Value (USD Million) Analysis, 2021 to 2025
- Current and Future Market Size Value (USD Million) Projections, 2026 to 2036
- Y-o-Y Growth Trend Analysis
- Absolute $ Opportunity Analysis
- Global Market Pricing Analysis, 2021 to 2036
- Global Market Analysis and Forecast, By Sales Channel, 2021 to 2036
- Introduction / Key Findings
- Historical Market Size Value (USD Million) Analysis By Sales Channel, 2021 to 2025
- Current and Future Market Size Value (USD Million) Analysis and Forecast By Sales Channel, 2026 to 2036
- Replacement
- Original equipment
- Retread-linked new casings
- Y-o-Y Growth Trend Analysis By Sales Channel, 2021 to 2025
- Absolute $ Opportunity Analysis By Sales Channel, 2026 to 2036
- Global Market Analysis and Forecast, By Vehicle, 2021 to 2036
- Introduction / Key Findings
- Historical Market Size Value (USD Million) Analysis By Vehicle, 2021 to 2025
- Current and Future Market Size Value (USD Million) Analysis and Forecast By Vehicle, 2026 to 2036
- Heavy trucks
- Light and medium trucks
- Buses and coaches
- Y-o-Y Growth Trend Analysis By Vehicle, 2021 to 2025
- Absolute $ Opportunity Analysis By Vehicle, 2026 to 2036
- Global Market Analysis and Forecast, By Position, 2021 to 2036
- Introduction / Key Findings
- Historical Market Size Value (USD Million) Analysis By Position, 2021 to 2025
- Current and Future Market Size Value (USD Million) Analysis and Forecast By Position, 2026 to 2036
- Drive
- Steer
- Trailer
- All-position
- Y-o-Y Growth Trend Analysis By Position, 2021 to 2025
- Absolute $ Opportunity Analysis By Position, 2026 to 2036
- Global Market Analysis and Forecast, By Region, 2021 to 2036
- Introduction
- Historical Market Size Value (USD Million) Analysis By Region, 2021 to 2025
- Current Market Size Value (USD Million) Analysis and Forecast By Region, 2026 to 2036
- North America
- Latin America
- Western Europe
- Eastern Europe
- East Asia
- South Asia
- Market Attractiveness Analysis By Region
- North America Market Analysis and Forecast, By Country, 2021 to 2036
- Historical Market Size Value (USD Million) Trend Analysis By Market Taxonomy, 2021 to 2025
- Market Size Value (USD Million) Forecast By Market Taxonomy, 2026 to 2036
- By Country
- United States
- Mexico
- By Sales Channel
- By Vehicle
- By Position
- By Country
- Market Attractiveness Analysis
- By Country
- By Sales Channel
- By Vehicle
- By Position
- Key Takeaways
- Latin America Market Analysis and Forecast, By Country
- Historical Market Size Value (USD Million) Trend Analysis By Market Taxonomy, 2021 to 2025
- Market Size Value (USD Million) Forecast By Market Taxonomy, 2026 to 2036
- By Country
- Brazil
- By Sales Channel
- By Vehicle
- By Position
- By Country
- Market Attractiveness Analysis
- By Country
- By Sales Channel
- By Vehicle
- By Position
- Key Takeaways
- Western Europe Market Analysis and Forecast, By Country
- Historical Market Size Value (USD Million) Trend Analysis By Market Taxonomy, 2021 to 2025
- Market Size Value (USD Million) Forecast By Market Taxonomy, 2026 to 2036
- By Country
- Germany
- By Sales Channel
- By Vehicle
- By Position
- By Country
- Market Attractiveness Analysis
- By Country
- By Sales Channel
- By Vehicle
- By Position
- Key Takeaways
- Eastern Europe Market Analysis and Forecast, By Country
- Historical Market Size Value (USD Million) Trend Analysis By Market Taxonomy, 2021 to 2025
- Market Size Value (USD Million) Forecast By Market Taxonomy, 2026 to 2036
- By Country
- Russia
- By Sales Channel
- By Vehicle
- By Position
- By Country
- Market Attractiveness Analysis
- By Country
- By Sales Channel
- By Vehicle
- By Position
- Key Takeaways
- East Asia Market Analysis and Forecast, By Country
- Historical Market Size Value (USD Million) Trend Analysis By Market Taxonomy, 2021 to 2025
- Market Size Value (USD Million) Forecast By Market Taxonomy, 2026 to 2036
- By Country
- China
- Japan
- By Sales Channel
- By Vehicle
- By Position
- By Country
- Market Attractiveness Analysis
- By Country
- By Sales Channel
- By Vehicle
- By Position
- Key Takeaways
- South Asia Market Analysis and Forecast, By Country
- Historical Market Size Value (USD Million) Trend Analysis By Market Taxonomy, 2021 to 2025
- Market Size Value (USD Million) Forecast By Market Taxonomy, 2026 to 2036
- By Country
- India
- Southeast Asia
- Indonesia
- Europe and Western Asia
- Turkiye
- Rest of world
- By Sales Channel
- By Vehicle
- By Position
- By Country
- Market Attractiveness Analysis
- By Country
- By Sales Channel
- By Vehicle
- By Position
- Key Takeaways
- Key Countries Market Analysis
- United States
- Pricing Analysis
- Market Share Analysis, 2025
- By Sales Channel
- By Vehicle
- By Position
- Mexico
- Pricing Analysis
- Market Share Analysis, 2025
- By Sales Channel
- By Vehicle
- By Position
- Brazil
- Pricing Analysis
- Market Share Analysis, 2025
- By Sales Channel
- By Vehicle
- By Position
- Germany
- Pricing Analysis
- Market Share Analysis, 2025
- By Sales Channel
- By Vehicle
- By Position
- India
- Pricing Analysis
- Market Share Analysis, 2025
- By Sales Channel
- By Vehicle
- By Position
- China
- Pricing Analysis
- Market Share Analysis, 2025
- By Sales Channel
- By Vehicle
- By Position
- Japan
- Pricing Analysis
- Market Share Analysis, 2025
- By Sales Channel
- By Vehicle
- By Position
- Russia
- Pricing Analysis
- Market Share Analysis, 2025
- By Sales Channel
- By Vehicle
- By Position
- Indonesia
- Pricing Analysis
- Market Share Analysis, 2025
- By Sales Channel
- By Vehicle
- By Position
- Turkiye
- Pricing Analysis
- Market Share Analysis, 2025
- By Sales Channel
- By Vehicle
- By Position
- United States
- Market Structure Analysis
- Competition Dashboard
- Competition Benchmarking
- Market Share Analysis of Top Players
- By Regional
- By Sales Channel
- By Vehicle
- By Position
- Emerging Startups
- Innovation Benchmarking
- Competition Analysis
- Competition Deep Dive
- Hankook Tire
- Overview
- Product Portfolio
- Profitability by Market Segments
- Sales Footprint
- Strategy Overview
- Marketing Strategy
- Product Strategy
- Channel Strategy
- Apollo Tyres
- Continental
- Bridgestone
- Giti Tire
- Pirelli
- Michelin
- Goodyear
- Sumitomo Rubber Industries
- Yokohama Rubber
- Pirelli, through industrial-tire distribution and licensing relationships
- Zhongce Rubber
- Triangle Tyre
- Sailun Group
- Linglong Tire
- MRF
- Hankook Tire
- Case Studies
- Success Stories
- Recent Developments
- Competition Deep Dive
- Assumptions & Acronyms Used
List of Tables
- Table 1: Global Market Value (USD Million) Forecast by Region, 2021 to 2036
- Table 2: Global Market Value (USD Million) Forecast by Sales Channel, 2021 to 2036
- Table 3: Global Market Value (USD Million) Forecast by Vehicle, 2021 to 2036
- Table 4: Global Market Value (USD Million) Forecast by Position, 2021 to 2036
- Table 5: North America Market Value (USD Million) Forecast by Country, 2021 to 2036
- Table 6: North America Market Value (USD Million) Forecast by Sales Channel, 2021 to 2036
- Table 7: North America Market Value (USD Million) Forecast by Vehicle, 2021 to 2036
- Table 8: North America Market Value (USD Million) Forecast by Position, 2021 to 2036
- Table 9: Latin America Market Value (USD Million) Forecast by Country, 2021 to 2036
- Table 10: Latin America Market Value (USD Million) Forecast by Sales Channel, 2021 to 2036
- Table 11: Latin America Market Value (USD Million) Forecast by Vehicle, 2021 to 2036
- Table 12: Latin America Market Value (USD Million) Forecast by Position, 2021 to 2036
- Table 13: Western Europe Market Value (USD Million) Forecast by Country, 2021 to 2036
- Table 14: Western Europe Market Value (USD Million) Forecast by Sales Channel, 2021 to 2036
- Table 15: Western Europe Market Value (USD Million) Forecast by Vehicle, 2021 to 2036
- Table 16: Western Europe Market Value (USD Million) Forecast by Position, 2021 to 2036
- Table 17: Eastern Europe Market Value (USD Million) Forecast by Country, 2021 to 2036
- Table 18: Eastern Europe Market Value (USD Million) Forecast by Sales Channel, 2021 to 2036
- Table 19: Eastern Europe Market Value (USD Million) Forecast by Vehicle, 2021 to 2036
- Table 20: Eastern Europe Market Value (USD Million) Forecast by Position, 2021 to 2036
- Table 21: East Asia Market Value (USD Million) Forecast by Country, 2021 to 2036
- Table 22: East Asia Market Value (USD Million) Forecast by Sales Channel, 2021 to 2036
- Table 23: East Asia Market Value (USD Million) Forecast by Vehicle, 2021 to 2036
- Table 24: East Asia Market Value (USD Million) Forecast by Position, 2021 to 2036
- Table 25: South Asia Market Value (USD Million) Forecast by Country, 2021 to 2036
- Table 26: South Asia Market Value (USD Million) Forecast by Sales Channel, 2021 to 2036
- Table 27: South Asia Market Value (USD Million) Forecast by Vehicle, 2021 to 2036
- Table 28: South Asia Market Value (USD Million) Forecast by Position, 2021 to 2036
List of Figures
- Figure 1: Global Market Pricing Analysis
- Figure 2: Global Market Value (USD Million) Forecast 2021-2036
- Figure 3: Global Market Value Share and BPS Analysis by Sales Channel, 2026 and 2036
- Figure 4: Global Market Y-o-Y Growth Comparison by Sales Channel, 2026-2036
- Figure 5: Global Market Attractiveness Analysis by Sales Channel
- Figure 6: Global Market Value Share and BPS Analysis by Vehicle, 2026 and 2036
- Figure 7: Global Market Y-o-Y Growth Comparison by Vehicle, 2026-2036
- Figure 8: Global Market Attractiveness Analysis by Vehicle
- Figure 9: Global Market Value Share and BPS Analysis by Position, 2026 and 2036
- Figure 10: Global Market Y-o-Y Growth Comparison by Position, 2026-2036
- Figure 11: Global Market Attractiveness Analysis by Position
- Figure 12: Global Market Value (USD Million) Share and BPS Analysis by Region, 2026 and 2036
- Figure 13: Global Market Y-o-Y Growth Comparison by Region, 2026-2036
- Figure 14: Global Market Attractiveness Analysis by Region
- Figure 15: North America Market Incremental Dollar Opportunity, 2026-2036
- Figure 16: Latin America Market Incremental Dollar Opportunity, 2026-2036
- Figure 17: Western Europe Market Incremental Dollar Opportunity, 2026-2036
- Figure 18: Eastern Europe Market Incremental Dollar Opportunity, 2026-2036
- Figure 19: East Asia Market Incremental Dollar Opportunity, 2026-2036
- Figure 20: South Asia Market Incremental Dollar Opportunity, 2026-2036
- Figure 21: North America Market Value Share and BPS Analysis by Country, 2026 and 2036
- Figure 22: North America Market Value Share and BPS Analysis by Sales Channel, 2026 and 2036
- Figure 23: North America Market Y-o-Y Growth Comparison by Sales Channel, 2026-2036
- Figure 24: North America Market Attractiveness Analysis by Sales Channel
- Figure 25: North America Market Value Share and BPS Analysis by Vehicle, 2026 and 2036
- Figure 26: North America Market Y-o-Y Growth Comparison by Vehicle, 2026-2036
- Figure 27: North America Market Attractiveness Analysis by Vehicle
- Figure 28: North America Market Value Share and BPS Analysis by Position, 2026 and 2036
- Figure 29: North America Market Y-o-Y Growth Comparison by Position, 2026-2036
- Figure 30: North America Market Attractiveness Analysis by Position
- Figure 31: Latin America Market Value Share and BPS Analysis by Country, 2026 and 2036
- Figure 32: Latin America Market Value Share and BPS Analysis by Sales Channel, 2026 and 2036
- Figure 33: Latin America Market Y-o-Y Growth Comparison by Sales Channel, 2026-2036
- Figure 34: Latin America Market Attractiveness Analysis by Sales Channel
- Figure 35: Latin America Market Value Share and BPS Analysis by Vehicle, 2026 and 2036
- Figure 36: Latin America Market Y-o-Y Growth Comparison by Vehicle, 2026-2036
- Figure 37: Latin America Market Attractiveness Analysis by Vehicle
- Figure 38: Latin America Market Value Share and BPS Analysis by Position, 2026 and 2036
- Figure 39: Latin America Market Y-o-Y Growth Comparison by Position, 2026-2036
- Figure 40: Latin America Market Attractiveness Analysis by Position
- Figure 41: Western Europe Market Value Share and BPS Analysis by Country, 2026 and 2036
- Figure 42: Western Europe Market Value Share and BPS Analysis by Sales Channel, 2026 and 2036
- Figure 43: Western Europe Market Y-o-Y Growth Comparison by Sales Channel, 2026-2036
- Figure 44: Western Europe Market Attractiveness Analysis by Sales Channel
- Figure 45: Western Europe Market Value Share and BPS Analysis by Vehicle, 2026 and 2036
- Figure 46: Western Europe Market Y-o-Y Growth Comparison by Vehicle, 2026-2036
- Figure 47: Western Europe Market Attractiveness Analysis by Vehicle
- Figure 48: Western Europe Market Value Share and BPS Analysis by Position, 2026 and 2036
- Figure 49: Western Europe Market Y-o-Y Growth Comparison by Position, 2026-2036
- Figure 50: Western Europe Market Attractiveness Analysis by Position
- Figure 51: Eastern Europe Market Value Share and BPS Analysis by Country, 2026 and 2036
- Figure 52: Eastern Europe Market Value Share and BPS Analysis by Sales Channel, 2026 and 2036
- Figure 53: Eastern Europe Market Y-o-Y Growth Comparison by Sales Channel, 2026-2036
- Figure 54: Eastern Europe Market Attractiveness Analysis by Sales Channel
- Figure 55: Eastern Europe Market Value Share and BPS Analysis by Vehicle, 2026 and 2036
- Figure 56: Eastern Europe Market Y-o-Y Growth Comparison by Vehicle, 2026-2036
- Figure 57: Eastern Europe Market Attractiveness Analysis by Vehicle
- Figure 58: Eastern Europe Market Value Share and BPS Analysis by Position, 2026 and 2036
- Figure 59: Eastern Europe Market Y-o-Y Growth Comparison by Position, 2026-2036
- Figure 60: Eastern Europe Market Attractiveness Analysis by Position
- Figure 61: East Asia Market Value Share and BPS Analysis by Country, 2026 and 2036
- Figure 62: East Asia Market Value Share and BPS Analysis by Sales Channel, 2026 and 2036
- Figure 63: East Asia Market Y-o-Y Growth Comparison by Sales Channel, 2026-2036
- Figure 64: East Asia Market Attractiveness Analysis by Sales Channel
- Figure 65: East Asia Market Value Share and BPS Analysis by Vehicle, 2026 and 2036
- Figure 66: East Asia Market Y-o-Y Growth Comparison by Vehicle, 2026-2036
- Figure 67: East Asia Market Attractiveness Analysis by Vehicle
- Figure 68: East Asia Market Value Share and BPS Analysis by Position, 2026 and 2036
- Figure 69: East Asia Market Y-o-Y Growth Comparison by Position, 2026-2036
- Figure 70: East Asia Market Attractiveness Analysis by Position
- Figure 71: South Asia Market Value Share and BPS Analysis by Country, 2026 and 2036
- Figure 72: South Asia Market Value Share and BPS Analysis by Sales Channel, 2026 and 2036
- Figure 73: South Asia Market Y-o-Y Growth Comparison by Sales Channel, 2026-2036
- Figure 74: South Asia Market Attractiveness Analysis by Sales Channel
- Figure 75: South Asia Market Value Share and BPS Analysis by Vehicle, 2026 and 2036
- Figure 76: South Asia Market Y-o-Y Growth Comparison by Vehicle, 2026-2036
- Figure 77: South Asia Market Attractiveness Analysis by Vehicle
- Figure 78: South Asia Market Value Share and BPS Analysis by Position, 2026 and 2036
- Figure 79: South Asia Market Y-o-Y Growth Comparison by Position, 2026-2036
- Figure 80: South Asia Market Attractiveness Analysis by Position
- Figure 81: Global Market - Tier Structure Analysis
- Figure 82: Global Market - Company Share Analysis
Frequently Asked Questions
How big is the truck and bus radial tire market in 2026?
FMI estimates the market at USD 57,200.0 million in 2026, up from USD 55,000.0 million in 2025. It is forecast to reach USD 88,829.9 million by 2036 at a 4.5% CAGR.
Which sales channel leads the truck and bus radial tire market in 2026?
Replacement leads by sales channel with 70.0% in 2026. All other segments together hold 30.0%.
Which vehicle and position lead in 2026?
Heavy trucks holds 62.0% by vehicle and Drive holds 38.0% by position in FMI's 2026 assessment.
Which market is forecast to grow fastest through 2036?
India has the highest forecast CAGR at 6.3% during 2026 to 2036, followed by Indonesia at 5.8%.
Does the market include retread tires?
Completed retreads are excluded. New casings sold into managed later-life programs are included at their first new-tire sale, with no retreading-service revenue added.
Preview the report firsthand - request a free sample
Get SampleGet the brochure for pricing and purchase details.
Get PDF
