The demand for 2-ethyl anthraquinone in the USA is expected to grow from USD 2.0 billion in 2025 to USD 3.2 billion by 2035, reflecting a compound annual growth rate (CAGR) of 4.90%. 2-ethyl anthraquinone is a key chemical used in the production of hydrogen peroxide, a widely used industrial chemical. Hydrogen peroxide plays an essential role in various applications, including paper and pulp bleaching, textile processing, water treatment, and industrial cleaning. The increasing demand for hydrogen peroxide, driven by these industries’ ongoing need for effective and sustainable solutions, will continue to fuel the demand for 2-ethyl anthraquinone over the next decade.
The growing global emphasis on sustainability and environmental responsibility is one of the primary factors driving this industry. Hydrogen peroxide, as a greener alternative to other chemicals in industrial processes, is increasingly being adopted in various sectors. As industries across the USA aim to reduce their environmental footprint, hydrogen peroxide’s role as a cleaner, safer, and more efficient chemical will only continue to expand. This will contribute significantly to the growth of 2-ethyl anthraquinone demand, as it remains a crucial component in the production of hydrogen peroxide.
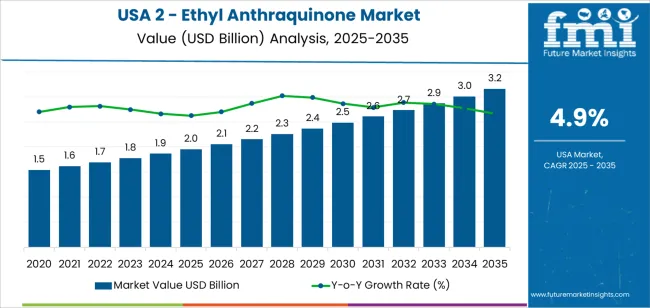
Between 2025 and 2030, the demand for 2-ethyl anthraquinone in the USA is expected to rise from USD 2.0 billion to USD 2.5 billion. This period will see steady growth, primarily driven by continued adoption in industries like paper and pulp, textiles, and water treatment, where hydrogen peroxide is used extensively. The rolling CAGR during this phase is expected to be moderate, as industries gradually increase their use of hydrogen peroxide for sustainable practices and environmental goals. New applications for hydrogen peroxide in emerging sectors such as pharmaceuticals and electronics will contribute to this steady growth.
From 2030 to 2035, the demand for 2-ethyl anthraquinone is projected to accelerate, reaching USD 3.2 billion by 2035. The sharp rise in demand during this phase is attributed to technological advancements in hydrogen peroxide production, making it more cost-effective and accessible across various industries. The increasing demand for hydrogen peroxide in advanced applications such as electronics manufacturing, pharmaceuticals, and large-scale water treatment will drive this acceleration. The ongoing shift toward more sustainable and environmentally friendly industrial practices will significantly increase the adoption of hydrogen peroxide, contributing to a higher rolling CAGR during this period.
| Metric | Value |
|---|---|
| Demand for 2-Ethyl Anthraquinone in USA Value (2025) | USD 2.0 billion |
| Demand for 2-Ethyl Anthraquinone in USA Forecast Value (2035) | USD 3.2 billion |
| Demand for 2-Ethyl Anthraquinone in USA Forecast CAGR (2025-2035) | 4.9% |
The demand for 2-Ethyl Anthraquinone in the USA is growing due to its critical role in producing hydrogen peroxide, a chemical widely used in industries such as textiles, paper, and environmental applications. 2-Ethyl Anthraquinone acts as a catalyst in the anthraquinone process, the primary method for hydrogen peroxide production. As industries increasingly seek sustainable and efficient chemical processes, the demand for 2-Ethyl Anthraquinone is rising.
One key driver of this growth is the rising demand for hydrogen peroxide in environmental applications like wastewater treatment and pollution control. Hydrogen peroxide’s effectiveness as an eco-friendly oxidizing agent in these processes is contributing to its growing use in both industrial and municipal settings. The expanding use of hydrogen peroxide in the textile and paper industries for bleaching and processing also boosts the need for 2-Ethyl Anthraquinone.
Advancements in hydrogen peroxide production technologies and the growing focus on sustainable chemical processes further drive demand. As industries prioritize improving efficiency and reducing environmental impact, the role of 2-Ethyl Anthraquinone in hydrogen peroxide production becomes more vital. This catalyst is essential for enhancing the effectiveness and sustainability of chemical processes, particularly in sectors that focus on eco-friendly solutions. As the demand for hydrogen peroxide continues to rise across various industries, the demand for 2-Ethyl Anthraquinone is expected to grow steadily through 2035.
Demand for 2-ethyl anthraquinone in the USA is segmented by chemical type, application, and region. By chemical type, demand is divided into crystals and granules, with crystals holding the largest share at 60%. The demand is also segmented by application, including textile, paper, detergent bleaches, water purification, and others, with textile leading the demand at 46.8%. Regionally, demand is divided into West USA, South USA, Northeast USA, and Midwest USA.
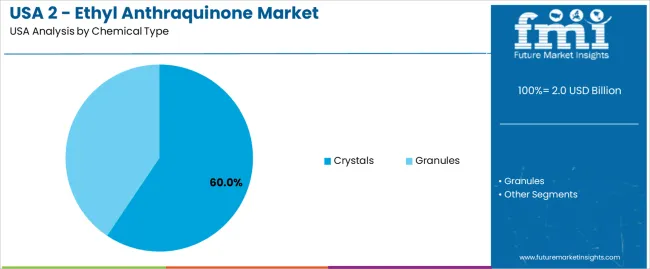
Crystals account for 60% of the demand for 2-ethyl anthraquinone in the USA. The crystalline form is preferred due to its high purity, stability, and effectiveness in various industrial applications. In the textile industry, crystalline 2-ethyl anthraquinone is a key component in the production of hydrogen peroxide, which is essential for the bleaching of fabrics. The high purity of crystalline 2-ethyl anthraquinone ensures efficient and consistent performance, particularly in applications where precise chemical reactions are crucial.
Crystals are also easier to handle and store compared to granules or other forms, making them more practical for large-scale manufacturing processes. The consistent quality and ease of handling make crystalline 2-ethyl anthraquinone ideal for industries that require high-performance chemicals. As industries continue to rely on superior-quality chemicals for efficiency and performance, crystalline 2-ethyl anthraquinone will continue to lead the industry due to its versatility and reliability.
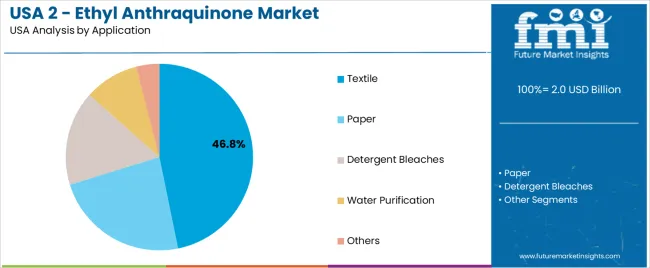
The textile industry accounts for 46.8% of the demand for 2-ethyl anthraquinone in the USA. This chemical is predominantly used in textile manufacturing, specifically for the production of hydrogen peroxide, which plays a vital role in fabric bleaching. The process of hydrogen peroxide generation involves 2-ethyl anthraquinone as a catalyst, facilitating the efficient production of hydrogen peroxide from oxygen. Hydrogen peroxide is essential for bleaching cotton and synthetic fabrics, ensuring that they are of high quality and free from impurities.
With increasing demand for high-quality textiles and a shift toward eco-friendly manufacturing methods, 2-ethyl anthraquinone remains a key ingredient in textile processing. The growing need for environmentally responsible production practices, along with the continued demand for bleached fabrics, will keep driving the demand for 2-ethyl anthraquinone. As the textile industry continues to innovate, its reliance on this chemical will ensure that the demand in this sector remains dominant.
The main driver for 2‑EAQ in the USA is the growth of the production of Hydrogen Peroxide (H₂O₂) via the anthraquinone process, in which 2‑EAQ is a key intermediate. As industries such as pulp & paper, textiles, water treatment, and electronics demand more H₂O₂ for bleaching, sterilisation and oxidation, the need for 2‑EAQ rises. Additional drivers include stricter environmental regulations favouring H₂O₂ over conventional oxidants and growth in speciality chemicals that require high‑purity intermediates. Restraints in the USA include the cost and complexity of producing or procuring 2‑EAQ at high purity, competition from alternative synthetic routes or processes for H₂O₂ production, and the fact that North America’s growth is moderate relative to some emerging regions, which may limit rate of demand increase.
In the USA, demand for 2‑EAQ is increasing as industries such as water purification, pulp bleaching, detergent formulation, and semiconductor cleaning rely more on hydrogen peroxide (H₂O₂), which requires 2‑EAQ in its production. H₂O₂ is favoured for its strong oxidising properties and low environmental impact, making it essential for these applications. The anthraquinone process, where 2‑EAQ plays a key role, remains the most established method for large‑scale H₂O₂ production. Furthermore, as USA chemical and industrial infrastructure evolves to meet sustainability regulations, the need for reliable intermediates like 2‑EAQ rises. The USA chemical manufacturing base supports continuous demand for the precursors and catalysts involved in H₂O₂ production, ensuring long‑term stability in demand for 2‑EAQ.
Technological advancements are driving growth in the demand for 2‑EAQ in the USA by improving the efficiency, quality, and scalability of production processes. Innovations such as enhanced catalyst designs and more efficient purification methods have improved 2‑EAQ yields while reducing impurities. These advances make it easier to produce high‑quality 2‑EAQ more cost‑effectively. In addition, improvements in reactor technology and downstream H₂O₂ production allow for better integration of the anthraquinone loop, reducing waste and increasing scalability.
Furthermore, advancements in material handling, such as switching to granules over crystals, and improvements in packaging and logistics have streamlined the supply chain. These innovations help make 2‑EAQ more accessible for broader industrial applications and enhance its competitiveness.
Despite growing demand, several challenges hinder the widespread adoption of 2‑EAQ in the USA. One major issue is the high cost of synthesising high‑purity 2‑EAQ, which requires capital‑intensive processes and tight quality control. Fluctuations in the supply of raw materials or precursor anthraquinones can disrupt production and create supply‑chain risks. Regulatory and environmental challenges also contribute to adoption barriers; the stringent scrutiny on chemical intermediates and processes in the USA adds complexity to obtaining necessary permits and meeting compliance standards. Furthermore, some industries are exploring alternative oxidants or processes that could replace the anthraquinone method, which could reduce future reliance on 2‑EAQ for H₂O₂ production.
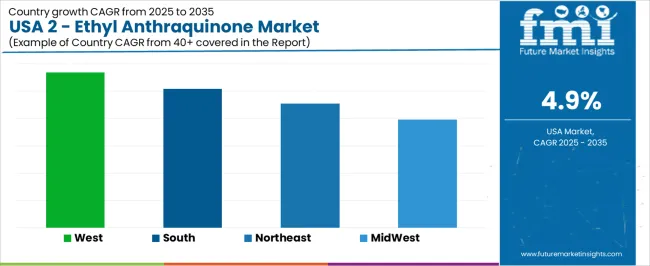
Demand for 2-Ethyl Anthraquinone in the USA is growing across all regions, with the West leading at a 5.7% CAGR. This growth is driven by the region’s strong industrial base in chemicals, energy, and manufacturing sectors, which rely heavily on hydrogen peroxide production. The South follows with a 5.1% CAGR, supported by its large petrochemical industry and expanding manufacturing sector. The Northeast shows a steady 4.5% CAGR, driven by its chemical, pharmaceutical, and environmental industries that use hydrogen peroxide.
The Midwest experiences the lowest growth at a 4.0% CAGR, with demand primarily coming from the chemical and agricultural industries. As industries continue to prioritize efficiency and sustainability in manufacturing processes, the demand for 2-Ethyl Anthraquinone is expected to grow steadily in all regions.
| Region | CAGR (%) |
|---|---|
| West | 5.7 |
| South | 5.1 |
| Northeast | 4.5 |
| Midwest | 4.0 |
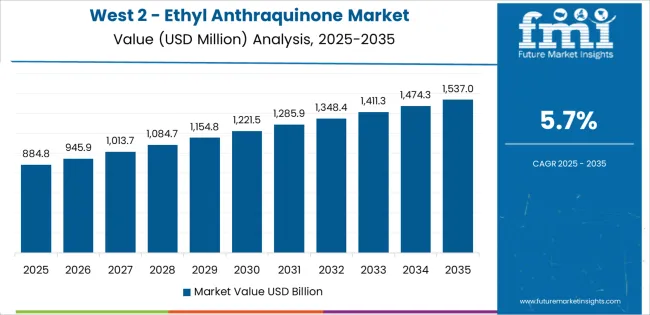
The West is experiencing the highest demand for 2-Ethyl Anthraquinone in the USA, with a 5.7% CAGR. This growth is driven by the region’s strong industrial base, including chemicals, agriculture, and energy sectors. 2-Ethyl Anthraquinone is a key component in hydrogen peroxide production, which is widely used in industries such as pulp and paper, textiles, and electronics. The West’s emphasis on clean energy and renewable materials also contributes to the increasing demand for hydrogen peroxide in environmental and industrial applications.
Industries such as oil and gas, which are prevalent in states like California, use 2-Ethyl Anthraquinone in chemical processes for refining and water treatment. As the region continues to invest in sustainable industrial practices, the demand for 2-Ethyl Anthraquinone is expected to grow at a strong pace, supported by its vital role in chemical manufacturing and green technologies.
The South is seeing steady demand for 2-Ethyl Anthraquinone in the USA, with a 5.1% CAGR. The region’s growing chemical manufacturing and energy sectors are driving this demand, as 2-Ethyl Anthraquinone is essential for the production of hydrogen peroxide, a chemical used in various industrial processes. The South is home to a large number of refineries, paper mills, and water treatment facilities, where hydrogen peroxide plays a critical role.
States like Texas and Louisiana, with their strong petrochemical industries, rely on 2-Ethyl Anthraquinone for hydrogen peroxide production used in refining, bleaching, and environmental applications. The increasing adoption of more sustainable manufacturing practices in the South, along with expanding industrial applications for hydrogen peroxide, ensures that demand for 2-Ethyl Anthraquinone will continue to rise steadily. As industries in the South focus on improving process efficiencies and reducing environmental impact, the need for 2-Ethyl Anthraquinone is expected to grow.
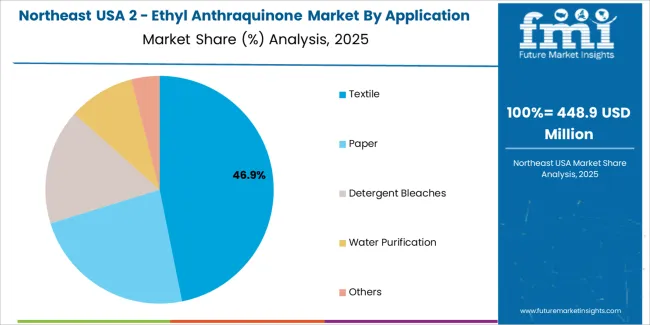
The Northeast is experiencing moderate demand for 2-Ethyl Anthraquinone in the USA, with a 4.5% CAGR. This demand is largely driven by the region’s strong industrial base in chemicals, pharmaceuticals, and energy. Hydrogen peroxide, produced using 2-Ethyl Anthraquinone, is widely used in the Northeast’s chemical manufacturing, medical, and environmental industries. In particular, the region’s pharmaceutical industry uses hydrogen peroxide for sterilization, while industries like pulp and paper rely on it for bleaching.
The Northeast also has a high concentration of research institutions and industries focused on environmental technologies, where hydrogen peroxide is used in wastewater treatment and pollution control. As environmental regulations continue to tighten and industries shift towards greener practices, the demand for hydrogen peroxide and thus for 2-Ethyl Anthraquinone is expected to remain strong. The region’s continued investment in sustainable manufacturing will support growth in demand for 2-Ethyl Anthraquinone over time.
The Midwest is seeing the lowest growth in demand for 2-Ethyl Anthraquinone in the USA, with a 4.0% CAGR. The demand in this region is primarily driven by the chemical, agricultural, and paper industries, where hydrogen peroxide is essential in manufacturing, pulp and paper processing, and wastewater treatment. States like Illinois, Ohio, and Michigan, with strong manufacturing sectors, use hydrogen peroxide in various chemical processes, including bleaching and oxidation.
The agricultural sector in the Midwest uses hydrogen peroxide for crop treatment and water treatment. While the growth rate is slower compared to other regions, steady demand remains due to the region’s continued focus on improving industrial processes and environmental compliance. As industries in the Midwest seek to enhance efficiency and reduce environmental impact, the need for 2-Ethyl Anthraquinone in the production of hydrogen peroxide will continue, albeit at a slower rate than in other regions.
In the USA, demand for 2‑Ethyl Anthraquinone is underpinned by its critical role as a catalyst/intermediate in the production of hydrogen peroxide, which is in turn used extensively in pulp & paper, water treatment, chemical synthesis, and bleaching applications. As industries increasingly seek efficient and safe oxidising agents, the demand for supplies of 2‑Ethyl Anthraquinone remains significant.
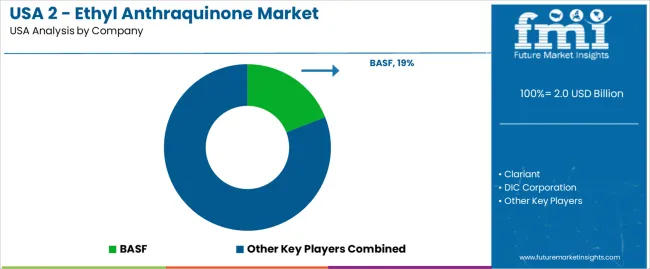
Key suppliers serving the USA industry include BASF with approximately 19.1% share, along with Clariant, DIC Corporation, Hebei Kailte Sensitizing Chemicals Co., and Henan Baofeng Chemical Industry Co.. These firms differentiate through production capacity, manufacturing of high‑purity grades, and their ability to service industrial customers in the USA with consistent supply, technical support and regulatory compliance.
Competitive dynamics are shaped by several factors. First, the demand‑push from hydrogen peroxide production sets the underlying volume growth; companies that can link effectively into the supply chain and ensure catalyst/intermediate supply will perform well. Second, quality and purity are important: many applications require high‑grade material to meet process demands and downstream regulatory standards.
Third, challenges include feed‑stock volatility (since the sourcing of anthraquinone derivatives can be impacted by raw material costs and availability), competition from alternative production routes or chemicals, and logistical constraints to service large industrial customers in the USA. Suppliers that combine high‑quality manufacturing, reliable delivery, and strong technical/customer‑service support will be best placed to lead in the USA 2‑Ethyl Anthraquinone demand environment.
| Items | Values |
|---|---|
| Quantitative Units (2025) | USD billion |
| Chemical Type | Crystals, Granules |
| Application | Textile, Paper, Detergent Bleaches, Water Purification, Others |
| Region | West USA, South USA, Northeast USA, Midwest USA |
| Countries Covered | USA |
| Key Companies Profiled | BASF, Clariant, DIC Corporation, Hebei Kailite Sensitizing Chemicals Co., Henan Baofeng Chemical Industry Co. |
| Additional Attributes | Dollar sales by chemical type and application; regional CAGR and adoption trends; demand trends in 2-ethyl anthraquinone; growth in textile, paper, and detergent sectors; technology adoption for chemical processing; vendor offerings including raw materials and solutions; regulatory influences and industry standards |
The demand for 2 - ethyl anthraquinone in usa is estimated to be valued at USD 2.0 billion in 2025.
The market size for the 2 - ethyl anthraquinone in usa is projected to reach USD 3.2 billion by 2035.
The demand for 2 - ethyl anthraquinone in usa is expected to grow at a 4.9% CAGR between 2025 and 2035.
The key product types in 2 - ethyl anthraquinone in usa are crystals and granules.
In terms of application, textile segment is expected to command 46.8% share in the 2 - ethyl anthraquinone in usa in 2025.


Our Research Products

The "Full Research Suite" delivers actionable market intel, deep dives on markets or technologies, so clients act faster, cut risk, and unlock growth.

The Leaderboard benchmarks and ranks top vendors, classifying them as Established Leaders, Leading Challengers, or Disruptors & Challengers.

Locates where complements amplify value and substitutes erode it, forecasting net impact by horizon

We deliver granular, decision-grade intel: market sizing, 5-year forecasts, pricing, adoption, usage, revenue, and operational KPIs—plus competitor tracking, regulation, and value chains—across 60 countries broadly.

Spot the shifts before they hit your P&L. We track inflection points, adoption curves, pricing moves, and ecosystem plays to show where demand is heading, why it is changing, and what to do next across high-growth markets and disruptive tech

Real-time reads of user behavior. We track shifting priorities, perceptions of today’s and next-gen services, and provider experience, then pace how fast tech moves from trial to adoption, blending buyer, consumer, and channel inputs with social signals (#WhySwitch, #UX).

Partner with our analyst team to build a custom report designed around your business priorities. From analysing market trends to assessing competitors or crafting bespoke datasets, we tailor insights to your needs.
Supplier Intelligence
Discovery & Profiling
Capacity & Footprint
Performance & Risk
Compliance & Governance
Commercial Readiness
Who Supplies Whom
Scorecards & Shortlists
Playbooks & Docs
Category Intelligence
Definition & Scope
Demand & Use Cases
Cost Drivers
Market Structure
Supply Chain Map
Trade & Policy
Operating Norms
Deliverables
Buyer Intelligence
Account Basics
Spend & Scope
Procurement Model
Vendor Requirements
Terms & Policies
Entry Strategy
Pain Points & Triggers
Outputs
Pricing Analysis
Benchmarks
Trends
Should-Cost
Indexation
Landed Cost
Commercial Terms
Deliverables
Brand Analysis
Positioning & Value Prop
Share & Presence
Customer Evidence
Go-to-Market
Digital & Reputation
Compliance & Trust
KPIs & Gaps
Outputs
Full Research Suite comprises of:
Market outlook & trends analysis
Interviews & case studies
Strategic recommendations
Vendor profiles & capabilities analysis
5-year forecasts
8 regions and 60+ country-level data splits
Market segment data splits
12 months of continuous data updates
DELIVERED AS:
PDF EXCEL ONLINE
2 - Ethyl Anthraquinone Market Growth - Trends & Forecast 2025 to 2035
Demand for 2 - Ethyl Anthraquinone in Japan Size and Share Forecast Outlook 2025 to 2035
2-Ethyl-3,4-ethylenedioxythiophene Market Size and Share Forecast Outlook 2025 to 2035
2-EthylHexyl Acetate Market Size and Share Forecast Outlook 2025 to 2035
2-ethylhexanol (2-EH) Market Growth - Trends & Forecast 2025 to 2035
2-Methylfuran Market Size and Share Forecast Outlook 2025 to 2035
Methyl 2-Fluoro-3-Oxopentanoate Market Size and Share Forecast Outlook 2025 to 2035
Methyl 2-Naphthyl Ether Market Size and Share Forecast Outlook 2025 to 2035
N-Ethyl-2-Pyrrolidone Market Growth - Trends & Forecast 2025 to 2035
2-(4-(Bromomethyl)phenyl)propionic Acid (BMPPA) Market Forecast and Outlook 2025 to 2035
N-Methyl-2-Pyrrolidone Market Trends – Size, Demand & Forecast 2024–2034
Methyl 3-Methyl-2-Butenoate Market Size and Share Forecast Outlook 2025 to 2035
3-Methyl-3-penten-2-one (3M3P) Market Forecast and Outlook 2025 to 2035
Demand for CO2-reduced Concrete in USA Size and Share Forecast Outlook 2025 to 2035
Demand for R290 Air Source Heat Pump in USA Size and Share Forecast Outlook 2025 to 2035
Demand for CO2-based Polycarbonate Polyol in USA Size and Share Forecast Outlook 2025 to 2035
Demand for 1,8-Dinitroanthraquinone in USA Size and Share Forecast Outlook 2025 to 2035
Demand for 4-Propyl-1,3,2-dioxathiolane 2,2-dioxide in USA Size and Share Forecast Outlook 2025 to 2035
Ethylene Carbonate Market Size and Share Forecast Outlook 2025 to 2035
Ethylene Glycol Market Forecast and Outlook 2025 to 2035

Thank you!
You will receive an email from our Business Development Manager. Please be sure to check your SPAM/JUNK folder too.
Chat With
MaRIA