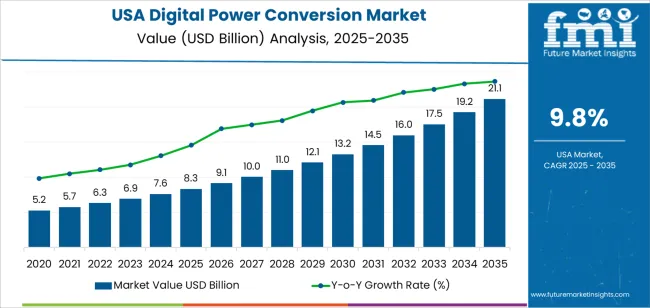
The USA digital power conversion demand is valued at USD 8.3 billion in 2025 and is expected to reach USD 21.1 billion by 2035, recording a CAGR of 9.8%. Demand is driven by expanding use of power-electronic systems across data centres, industrial automation, electric mobility, and consumer electronics. Digital control architectures support higher efficiency, improved thermal management, and stable operation under variable load conditions. Growth is also shaped by continued migration toward energy-efficient equipment, increased use of wide-bandgap semiconductors, and sustained investment in connected power-management platforms across commercial and industrial environments.
AC/DC power conversion represents the leading product type due to its broad integration into servers, telecom equipment, industrial drives, and residential devices. These systems convert grid-sourced alternating current into controlled direct-current outputs suited for electronic circuits and battery-based applications. Digital control functions, such as adaptive regulation, fault-response management, and real-time performance monitoring, support higher reliability and enhanced power-quality performance. Developments in silicon carbide and gallium-nitride devices continue to influence efficiency gains in AC/DC architectures.
Demand is strongest in the West, South, and Northeast, supported by concentrations of data-centre capacity, semiconductor manufacturing activity, and advanced industrial facilities. Key suppliers include Texas Instruments, Infineon Technologies AG, STMicroelectronics, ON Semiconductor (onsemi), Mitsubishi Electric Corporation, and ABB Ltd. These companies provide digital controllers, power-conversion modules, and semiconductor components for high-density, high-efficiency conversion systems.
The acceleration and deceleration pattern shows a strong early-phase rise from 2025 to 2029, driven by broad adoption of digitally controlled converters across data centres, industrial automation, and high-efficiency power-supply systems. Growth during this period is supported by expanding cloud-computing workloads, wider use of power-dense server architectures, and increased deployment of digitally managed motor-drive and renewable-energy systems. Early acceleration is further influenced by regulatory efficiency requirements and the transition toward advanced semiconductor components.
Between 2030 and 2035, the segment enters a controlled deceleration phase as adoption becomes more uniform and procurement aligns with equipment-lifecycle patterns. Growth remains positive but steadier, shaped by routine upgrades in telecom power systems, incremental improvements in digital control algorithms, and deeper integration of power-management ICs in consumer and industrial electronics. Replacement cycles and system optimisation, rather than new-capacity surges, drive late-period momentum. The overall pattern reflects a technology segment moving from rapid digital-infrastructure expansion toward a mature phase characterised by predictable utilisation, lifecycle-based upgrades, and stable reliance on digitally managed power systems across USA industrial and commercial applications.
| Metric | Value |
|---|---|
| USA Digital Power Conversion Sales Value (2025) | USD 8.3 billion |
| USA Digital Power Conversion Forecast Value (2035) | USD 21.1 billion |
| USA Digital Power Conversion Forecast CAGR (2025-2035) | 9.8% |
Demand for digital power conversion in the USA is increasing as industrial, automotive, data-centre and renewables sectors require sophisticated power management systems that improve efficiency, reduce losses and enable advanced control. Digital power conversion uses microcontrollers, sensors and software-based regulation methods to deliver flexibility and integration across modern applications, such as electric vehicle inverters, server racks, telecom modules and renewable-energy inverters. Growth is supported by expansion of cloud infrastructure, server farms, electric mobility and grid-edge deployments, all of which require efficient, scalable and digitally controlled power systems.
Regulatory focus on energy efficiency, carbon emissions reduction and clean-tech innovation drives system upgrades and adoption of digital power conversion solutions. Constraints include high initial cost of switching to digital conversion platforms, the technical complexity of retrofitting legacy analog or discrete-component systems, and the long qualification cycles in critical applications such as aerospace and automotive. Some manufacturers may delay investment until cost-benefit outcomes become clear.
Demand for digital power-conversion systems in the United States reflects increased reliance on controlled, efficient, and programmable power-management architectures across electronics, industrial equipment, and high-reliability applications. Product-category distribution is shaped by load requirements, conversion stages, and integration needs within hybrid and fully electrical systems. Application patterns reflect power-density needs, thermal constraints, and digital-system compatibility. Control-type distribution shows how users balance advanced digital management with mixed-signal approaches in systems requiring performance predictability.

AC/DC power-conversion units hold 26.6% of national demand and represent the leading product category. These converters support grid-to-device power transformation across consumer electronics, industrial systems, and automotive components requiring stable regulated output. DC-DC converters represent 22.0%, used for voltage regulation within multilayer electronic architectures. Non-isolated converters hold 16.1%, providing compact, board-level regulation for low-voltage circuits. Isolated converters represent 12.1%, serving applications where electrical separation is required. DC-AC converters account for 11.0%, supporting inverter-based systems. The remaining 12.2% includes specialised modules. Product distribution reflects voltage-control needs, power density considerations, and integration across increasingly digitalised devices.
Key drivers and attributes:
IT and telecommunications systems hold 31.0% of national demand and form the leading application category. Data centres, networking hardware, and communication infrastructure require stable, high-efficiency conversion with digital monitoring to support uptime and load-balancing requirements. Automotive applications represent 18.0%, reflecting increased electrification and integration of digital power modules in EV components and onboard electronics. Consumer electronics account for 12.4%, spanning mobile devices, computing, and home electronics. Industrial uses represent 12.0%, supporting automation equipment and process-control systems. Aerospace and defense hold 11.0%, with reliability-based requirements. Healthcare accounts for 6.0%, and renewable energy represents 9.6%, where converters support inverters and storage systems.
Key drivers and attributes:
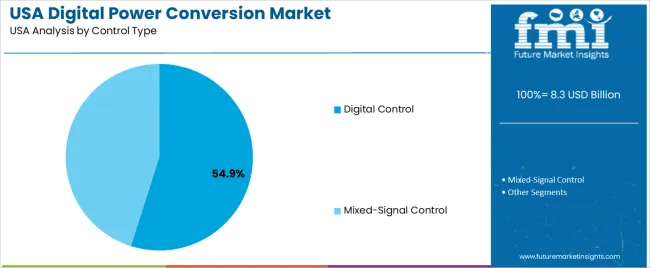
Digital control holds 54.9% of USA demand and represents the primary control category. Digital controllers support programmable regulation, telemetry, fault detection, and adaptive control loops in modern power-management systems. These functions enable dynamic response to load changes and efficient power distribution across complex electronic platforms. Mixed-signal control represents 45.1%, combining analog responsiveness with digital supervision in systems where low-latency analog behaviour remains important. Mixed-signal architectures support automotive, industrial, and defense environments requiring fast transient response and predictable analog behaviour while retaining digital oversight. Control-type distribution reflects the balance between fully programmable architectures and hybrid approaches needed for specialised applications.
Key drivers and attributes:
Growing demand for electrification, data-centre build-out, and emphasis on energy-efficient systems are driving growth.
In the United States, demand for digital power conversion solutions is increasing as industries adopt wide-band-gap semiconductors, software-defined power architectures, and electric-vehicle (EV) power management systems. The expansion of data centres and cloud infrastructure pulls in power-conversion units that enable high-density, low-loss power delivery with real-time digital control. USA utility grids, manufacturing plants and clean-energy facilities also seek digital power converters to optimise energy use, monitor performance and support smart infrastructure. These shifts in electric power demand patterns favour digital power conversion over legacy analogue systems.
Supply complexity, higher upfront cost and integration challenges pose restraints.
Digital power conversion systems require advanced control electronics, firmware, and precision components which increase design and manufacturing cost. Many end-users face integration challenges when migrating from analogue systems to digital-based power conversion, including firmware updates, thermal-management redesign and software verification. The pace of wide-band-gap component uptake and standardisation lags in some sectors, which can delay full deployment of digital power conversion solutions.
Shift toward modular, ‘plug-and-play’ digital power modules, increased deployment in EV chargers and data-centres, and stronger regulatory focus on efficiency and carbon reduction define key trends.
Suppliers are releasing modular digital power conversion modules that simplify system design, reduce time-to-market and support scalable architectures across data-centre and EV infrastructure. The USA industry is seeing greater penetration of digital converters in EV charging stations, server-rack power supplies and smart factories. Regulatory and corporate commitments to energy-efficiency and decarbonisation are encouraging adoption of digital power conversion systems that offer measurable performance gains, monitoring capability and lifecycle cost benefits.
Demand for digital power conversion in the USA is rising through 2035 as manufacturers, data-center operators, utilities, and electronics producers adopt digitally managed power systems for improved efficiency, monitoring, and reliability. Digital power conversion supports advanced energy architectures through real-time control loops, integrated sensing, remote diagnostics, and parameter optimization across industrial, commercial, and consumer applications. Adoption is influenced by electrification trends, semiconductor integration, renewable-energy expansion, and increased deployment of smart infrastructure. Regional growth reflects differences in technology ecosystems, industrial capacity, and power-electronics manufacturing networks. The West leads with an 11.3% CAGR, followed by the South (10.1%), the Northeast (9.0%), and the Midwest (7.8%).
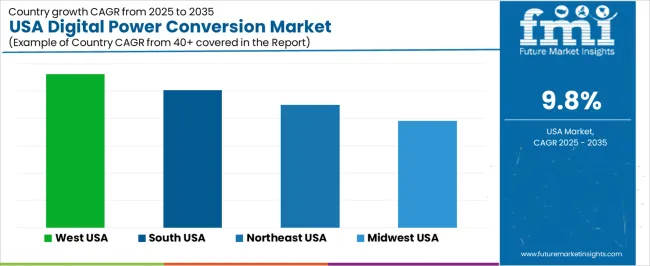
| Region | CAGR (2025-2035) |
|---|---|
| West | 11.3% |
| South | 10.1% |
| Northeast | 9.0% |
| Midwest | 7.8% |

The West grows at 11.3% CAGR, supported by significant activity in data centers, renewable-energy systems, and advanced electronics manufacturing across California, Washington, and Oregon. Data-center operators adopt digital power conversion units to improve power-supply efficiency, maintain voltage stability, and support remote thermal management. Renewable-energy developers integrate digital converters into solar inverters, battery-storage systems, and grid-tie interfaces. Semiconductor and electronics companies deploy digitally controlled power modules for precision control within high-density circuit designs. Electric-vehicle infrastructure expansion in California increases the use of digitally managed chargers capable of dynamic load balancing and real-time monitoring.
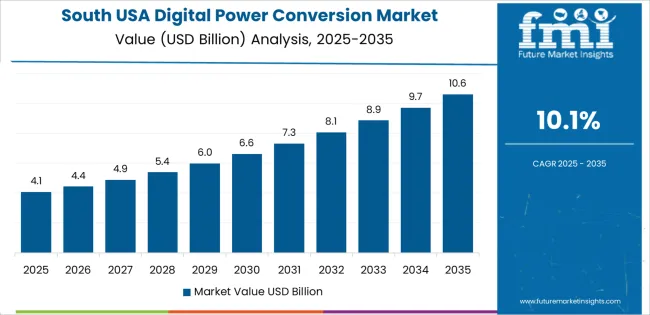
The South grows at 10.1% CAGR, supported by strong industrial activity, energy-sector modernization, and increased investment in large-scale manufacturing across Texas, Florida, Georgia, and Tennessee. Utilities adopt digital power conversion to support grid-stability programs and renewable-capacity expansion. Industrial facilities implement digitally controlled drives, converters, and rectifiers to enhance motor efficiency and equipment uptime. Data-center growth across Texas increases demand for digitally regulated power supplies. Electric-vehicle and appliance manufacturers integrate digitally managed power modules into production lines. Consistent industrial upgrades support ongoing adoption of digital conversion technologies.

The Northeast grows at 9.0% CAGR, supported by adoption in financial-services data centers, research institutions, telecommunications providers, and medical-equipment manufacturers across New York, Massachusetts, and Pennsylvania. Data-intensive companies implement digital power systems to maintain stable runtime and reduce energy consumption. Research labs use digitally regulated power modules for precision instrumentation. Telecom operators rely on digital conversion for stable power across network nodes. Medical-device manufacturers use digitally controlled power supplies to support imaging equipment, diagnostic tools, and electronic-medical systems. Dense institutional activity supports steady demand for digital power-management solutions.
The Midwest grows at 7.8% CAGR, supported by manufacturing facilities, automotive plants, and industrial-automation networks across Illinois, Michigan, Ohio, and Minnesota. Manufacturers adopt digital power systems to improve energy efficiency and support automated production lines. Automotive companies integrate digitally controlled converters, inverters, and power modules into EV component production and testing environments. Regional utilities implement digital conversion for grid-equipment upgrades and distributed-energy coordination. Although adoption is slower than in coastal regions, strong industrial presence ensures continuous use of digital power-conversion technologies.
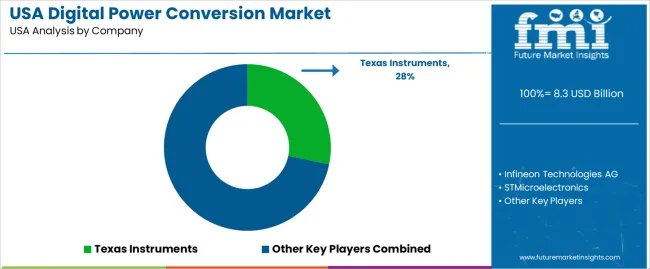
Demand for digital power-conversion solutions in the USA is shaped by a concentrated group of semiconductor and industrial-electronics suppliers supporting data centres, telecom infrastructure, renewable-energy systems, EV power stages, and industrial automation. Texas Instruments holds the leading position with an estimated 28.2% share, supported by a broad portfolio of digital controllers, power-management ICs, and mixed-signal devices. Its position is reinforced by predictable control-loop behaviour, stable thermal performance, and long-term supply continuity valued by USA OEMs.
Infineon Technologies AG and STMicroelectronics follow as major participants, providing digital-control ICs, MOSFETs, SiC devices, and integrated driver solutions used across high-efficiency AC-DC, DC-DC, and motor-control applications. Their strengths include reliable switching behaviour, documented efficiency gains, and strong alignment with data-centre and renewable-energy requirements. ON Semiconductor (onsemi) maintains a notable presence through high-performance power semiconductors and digital controllers that support EV charging, industrial automation, and energy-storage systems.
Mitsubishi Electric Corporation contributes capability through digital modules and high-reliability power devices suited to heavy-industrial equipment and distributed-energy systems. ABB Ltd. adds further depth with automation-focused digital-power components and control modules used in industrial drives and grid-connected systems.
Competition across this segment centres on conversion efficiency, switching precision, thermal stability, digital-control flexibility, and long-duration reliability. Demand continues to expand as USA industries adopt high-efficiency digital power architectures for data-centre growth, electrification trends, and advanced industrial power platforms requiring precise, programmable control.
| Items | Values |
|---|---|
| Quantitative Units | USD billion |
| Product | AC/DC Power Conversion, DC-DC Converters, Isolated Converters, Non-Isolated Converters, DC-AC Converters (Inverters), Others |
| Application | Consumer Electronics, Automotive, Industrial, IT and Telecommunications, Healthcare, Aerospace & Defense, Renewable Energy |
| Control Type | Digital Control, Mixed-Signal Control |
| Regions Covered | West, Midwest, South, Northeast |
| Key Companies Profiled | Texas Instruments, Infineon Technologies AG, STMicroelectronics, ON Semiconductor (onsemi), Mitsubishi Electric Corporation, ABB Ltd. |
| Additional Attributes | Dollar sales by product category, application area, and control type; regional adoption trends across West, Midwest, South, and Northeast; competitive landscape of digital and mixed-signal power conversion manufacturers; advancements in wide-bandgap semiconductors, high-frequency switching, intelligent power modules, and energy-efficient conversion architectures; integration with EV powertrains, renewable energy systems, industrial automation, telecommunications infrastructure, and high-reliability healthcare and aerospace equipment in the USA. |
The global demand for digital power conversion in USA is estimated to be valued at USD 8.3 billion in 2025.
The market size for the demand for digital power conversion in USA is projected to reach USD 21.1 billion by 2035.
The demand for digital power conversion in USA is expected to grow at a 9.8% CAGR between 2025 and 2035.
The key product types in demand for digital power conversion in USA are ac/dc power conversion, dc-dc converters, isolated converters, non-isolated converters, dc-ac converters (inverters) and others.
In terms of application, consumer electronics segment to command 12.4% share in the demand for digital power conversion in USA in 2025.


Our Research Products

The "Full Research Suite" delivers actionable market intel, deep dives on markets or technologies, so clients act faster, cut risk, and unlock growth.

The Leaderboard benchmarks and ranks top vendors, classifying them as Established Leaders, Leading Challengers, or Disruptors & Challengers.

Locates where complements amplify value and substitutes erode it, forecasting net impact by horizon

We deliver granular, decision-grade intel: market sizing, 5-year forecasts, pricing, adoption, usage, revenue, and operational KPIs—plus competitor tracking, regulation, and value chains—across 60 countries broadly.

Spot the shifts before they hit your P&L. We track inflection points, adoption curves, pricing moves, and ecosystem plays to show where demand is heading, why it is changing, and what to do next across high-growth markets and disruptive tech

Real-time reads of user behavior. We track shifting priorities, perceptions of today’s and next-gen services, and provider experience, then pace how fast tech moves from trial to adoption, blending buyer, consumer, and channel inputs with social signals (#WhySwitch, #UX).

Partner with our analyst team to build a custom report designed around your business priorities. From analysing market trends to assessing competitors or crafting bespoke datasets, we tailor insights to your needs.
Supplier Intelligence
Discovery & Profiling
Capacity & Footprint
Performance & Risk
Compliance & Governance
Commercial Readiness
Who Supplies Whom
Scorecards & Shortlists
Playbooks & Docs
Category Intelligence
Definition & Scope
Demand & Use Cases
Cost Drivers
Market Structure
Supply Chain Map
Trade & Policy
Operating Norms
Deliverables
Buyer Intelligence
Account Basics
Spend & Scope
Procurement Model
Vendor Requirements
Terms & Policies
Entry Strategy
Pain Points & Triggers
Outputs
Pricing Analysis
Benchmarks
Trends
Should-Cost
Indexation
Landed Cost
Commercial Terms
Deliverables
Brand Analysis
Positioning & Value Prop
Share & Presence
Customer Evidence
Go-to-Market
Digital & Reputation
Compliance & Trust
KPIs & Gaps
Outputs
Full Research Suite comprises of:
Market outlook & trends analysis
Interviews & case studies
Strategic recommendations
Vendor profiles & capabilities analysis
5-year forecasts
8 regions and 60+ country-level data splits
Market segment data splits
12 months of continuous data updates
DELIVERED AS:
PDF EXCEL ONLINE
Digital Power Conversion Market Report - Trends & Forecast 2025 to 2035
Demand for Digital Power Conversion in Japan Size and Share Forecast Outlook 2025 to 2035
USA Power Tool Market Insights – Size, Trends & Forecast 2025-2035
USA Digital Illustration App Market Insights – Growth & Demand 2025-2035
USA Digital Commerce Market Growth – Innovations, Trends & Forecast 2025-2035
USA Digital Textile Printing Market Trends – Growth, Demand & Forecast 2025-2035
Digital Power Meter Market Growth - Trends & Forecast 2025 to 2035
String Power Conversion System(PCS) Market Size and Share Forecast Outlook 2025 to 2035
Digital Hall Effect Gaussmeter Market Size and Share Forecast Outlook 2025 to 2035
Digital Group Dining Service Market Size and Share Forecast Outlook 2025 to 2035
Digital Pathology Displays Market Size and Share Forecast Outlook 2025 to 2035
Digital Rights Management Market Size and Share Forecast Outlook 2025 to 2035
Power Grid Fault Prediction Service Market Size and Share Forecast Outlook 2025 to 2035
Digital Liquid Filling Systems Market Size and Share Forecast Outlook 2025 to 2035
Digital Transformation Industry Analysis in MENA Size and Share Forecast Outlook 2025 to 2035
Power Plant Boiler Market Forecast Outlook 2025 to 2035
Power Ring Rolling Machine Market Size and Share Forecast Outlook 2025 to 2035
Digital X-Ray Equipment Market Size and Share Forecast Outlook 2025 to 2035
Power Supply Equipment for Data Center Market Size and Share Forecast Outlook 2025 to 2035
Digital Marketing Analytics Industry Analysis in Latin America Forecast Outlook 2025 to 2035

Thank you!
You will receive an email from our Business Development Manager. Please be sure to check your SPAM/JUNK folder too.
Chat With
MaRIA