Urinary Bag Market Size and Share Forecast Outlook 2025 to 2035

The global Urinary Bag Market is estimated to be valued at USD 2,070.115 Million in 2025 and is projected to reach USD 3,064.276 Million by 2035, registering a compound annual growth rate (CAGR) of 4.0% over the forecast period.

Quick Stats for Urinary Bag Market

  • Industry Value (2025): USD 2,070.115 million
  • Forecast Value (2035): USD 3,064.276 million
  • Forecast CAGR: 4.0%
  • Leading Segment in 2025: Drainage Bags (52.9% share)
  • Key Growth Region: North America, Europe, Asia Pacific
  • Top Key Players: B. Braun Melsungen AG, Coloplast A/S, ConvaTec Group PLC, Teleflex Incorporated, Medline Industries LP, Hollister Incorporated, McKesson Medical-Surgical, Cardinal Health, Romsons Group, Flexicare Medical Ltd
Metric Value
Market Size (2025E) USD 2,070.115 million
Market Value (2035F) USD 3,064.276 million
CAGR (2025 to 2035) 4.0%

The urinary bag market is witnessing consistent expansion driven by the rising incidence of chronic urinary disorders, an aging population, and the increasing prevalence of long-term catheterization across hospital and home care settings.

Improvements in infection prevention materials and user-centric product designs are influencing purchasing decisions among clinicians and patients alike. Manufacturers are focusing on advanced anti-reflux valves, secure drainage mechanisms, and antimicrobial components that enhance safety and usability.

Healthcare providers have demonstrated a preference for urinary bags that integrate leak-proof construction and simplified emptying systems, aligning with infection control guidelines emphasized in recent clinical publications. Regulatory authorities have supported innovation through streamlined pathways for product upgrades, which has accelerated the introduction of improved designs.

The market outlook is expected to be further strengthened by rising awareness campaigns about continence care, increased reimbursement coverage for home-use drainage solutions, and technological integration such as urine output monitoring features.
Analyzing Urinary Bag Market by Top Investment Segments

Drainage Bags Leading the Product Type Segment

Urinary Bag Market Analysis By Product Type

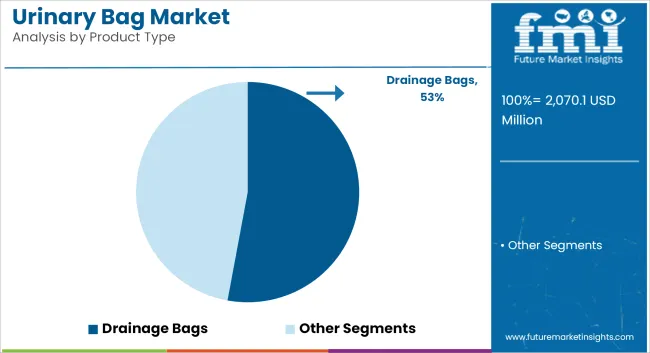
In 2025, drainage bags are anticipated to hold a 52.9% revenue share in the urinary bag market. This segment’s leadership has been driven by their critical role in managing urinary incontinence and supporting long-term catheterized patients.

Clinical preferences have favored drainage bags due to their capacity for continuous urine collection and reduced risk of overflow incidents, which has contributed to their widespread adoption across acute care, long-term care, and home care settings. Enhanced features such as anti-reflux valves, clear volume markings, and closed drainage systems have been integrated to improve infection control and simplify usage.

Reimbursement support and clinician training initiatives have further reinforced demand, while manufacturers have prioritized investments in high-quality materials to enhance patient comfort and compliance. These factors collectively have established drainage bags as the cornerstone of the product segment in urological management.
1000 ml as the Preferred Capacity Segment

Urinary Bag Market Analysis By Capacity

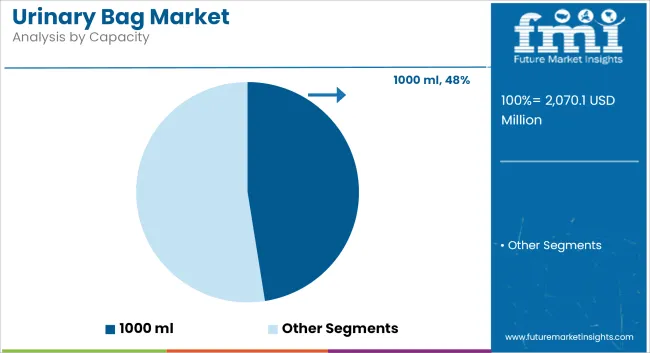
The 1000 ml capacity segment is projected to account for 47.5% of the market share in 2025. Its prominence has been attributed to the optimal balance it offers between capacity and portability, meeting clinical requirements for safe urine collection without frequent emptying. Healthcare providers have demonstrated strong preference for 1000 ml bags in both hospital and home care settings due to reduced handling frequency and minimized spillage risks.

Design improvements have included reinforced hanger systems and advanced drainage ports that enhance convenience and patient independence. Regulatory approvals have consistently supported this capacity configuration, further validating its safety and efficacy in long-term use. The segment has also benefited from the standardization of care protocols recommending mid-range capacities for patients requiring moderate drainage volumes, securing its role as the preferred choice in the

Challenges and Opportunities

Challenge

Risk of Infections and Hygiene Maintenance

One major challenge in the urinary bag market is how to make certain sure its hygienic use prevents urinary tract infections (UTIs) and other complications. Inadequate maintenance of catheters and over-long use of bags can mean bacterial growth, imperilling the patient.

Product Comfort and Discreetness

Due to uncomfortable and ungainly volumes, patients often new find themselves self-conscious about urinary bags. Manufacturers keep iterating design options that combine effectiveness, comfort, and a discreet manner.

Opportunity

Aging Population and Increase in Chronic Conditions

As the world’s population grows older and conditions related to urology such as incontinence, bladder cancer and so on become more frequent, the demand for urinary bags is increasing dramatically. In-home care is a big contributor to this growth in market expansion.

Product Innovation and Sustainability

Improved performance has come from developments in anti-reflux valves, odour control and user-friendly taps. Also, with an eye fashionable 'green ' materials and reusable products to meet new global protection trends.
Country-wise Outlook

Urinary Bag Market Cagr Analysis By Country

United States

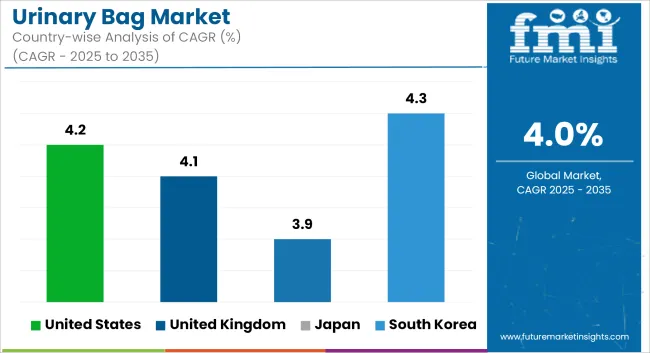
The United States' urinary bag market has been increase strong growth for years, with continence-related diseases and chronic urological conditions becoming more common. The high average age of population after decades in America, and a rising number of surgical procedures are some key drivers that brought about growing demand for urinary collection devices.

Country CAGR (2025 to 2035)
United States 4.2%

United Kingdom

The urinary bag market in the United Kingdom has been growing steadily, with increased awareness and improvements in home healthcare services. Government support for care over the long-term and a growing geriatric demographic contribute to this growth.

Country CAGR (2025 to 2035)
United Kingdom 4.1%

European Union

The urinary bag market in the European Union is steadily increasing, powered by an aging population and the presence of threat diseases like prostate cancer or neurogenic bladder. Both better medical facilities and favourable reimbursement policies help the market grow, while companies get free loans to assist during this time.

Country CAGR (2025 to 2035)
European Union 4.0%

Japan

Japan’s urinary bag market is seeing moderate growth, supported by one of the world’s most rapidly aging populations and a high incidence of urological and post-surgical care requirements. Demand is increasing for compact, discreet, and ergonomically designed urinary bags that cater to both hospital and homecare segments.

Country CAGR (2025 to 2035)
Japan 3.9%

South Korea

South Korea's urinary bag market is growing, with the demand for urological devices being driven by patients themselves and an increased emphasis on cleanliness and comfort in long-term care settings. Technological advances and greater awareness are fuelling adoption.

Country CAGR (2025 to 2035)
South Korea 4.3%

Competition Outlook

The urinary bag market is moderately consolidated, with competition driven by innovation in anti-reflux mechanisms, user comfort features, and infection prevention solutions. Leading manufacturers are investing in high-quality materials, ergonomic designs, and advanced drainage valves to improve patient experience in acute care, long-term care, and home settings. Strategic acquisitions, regional distribution agreements, and product line extensions are central to sustaining market share and expanding global reach.

Additionally, rising incidence of chronic urinary retention, incontinence, and increasing surgical volumes are fueling demand across hospital and outpatient environments. Emphasis on closed-system drainage, antimicrobial coatings, and convenient emptying mechanisms is shaping competitive differentiation.

Key Segments

In December 2024, Teleflex introduced a line of closed-system urinary collection bags with advanced anti-reflux valves designed to reduce catheter-associated urinary tract infections (CAUTI).

In February 2024, Mexple has launched its revolutionary UroMen and UroWomen urine collection kits, designed for male and female incontinence. These innovative products combine advanced design, comfort, and functionality to meet the growing demand for superior home medical care, significantly enhancing the user experience.

Companies

  • Medline Industries, Inc.,
  • Cardinal Health, Inc.,
  • Hollister Incorporated,
  • Teleflex Incorporated,
  • Cook Medical,
  • Moore Medical LLC,
  • McKesson Medical-Surgical Inc.,
  • Arcus Medical LLC,
  • Urocare,
  • Hollister Incorporated
  • Coloplast A/S
  • B. Braun Melsungen AG
  • ConvaTec Group PLC

 Key Segmentation

By Product Type:

  • Drainage Bags
  • Leg Bags
  • Large Capacity Bags
  • Belly Bags

By Capacity:

  • Less than 500 ml
  • 500 ml
  • 1000 ml
  • 2000 ml
  • 4000 ml

By Usage:

  • Reusable Urinary Bags
  • Disposable Urinary Bags

By Patient Age:

  • Pediatric
  • Adult

By End User:

  • Hospitals
  • Clinics
  • Ambulatory Surgical Centers
  • Long Term Care Centers
  • Home Care

By Region:

  • North America
  • Latin America
  • Europe
  • South Asia
  • East Asia
  • Oceania
  • The Middle East and Africa

Table of Content

  1. Executive Summary
  2. Industry Introduction, including Taxonomy and Market Definition
  3. Urinary Bag Market Trends and Success Factors, including Macro-economic Factors, Market Dynamics, and Recent Industry Developments
  4. Global Market Demand Analysis 2020 to 2024 and Forecast 2025 to 2035, including Historical Analysis and Future Projections
  5. Pricing Analysis
  6. Global Market Analysis 2020 to 2024 and Forecast 2025 to 2035
    • Product Type
    • Capacity
    • Usage
    • Patient Age
    • End User
  7. Global Market Analysis 2020 to 2024 and Forecast 2025 to 2035, By Product Type
    • Drainage Bags
    • Leg Bags
    • Large Capacity Bags
    • Belly Bags
  8. Global Market Analysis 2020 to 2024 and Forecast 2025 to 2035, By Capacity
    • Less than 500 ml
    • 500 ml
    • 1000 ml
    • 2000 ml
    • 4000 ml
  9. Global Market Analysis 2020 to 2024 and Forecast 2025 to 2035, By Usage
    • Reusable Urinary Bags
    • Disposable Urinary Bags
  10. Global Market Analysis 2020 to 2024 and Forecast 2025 to 2035, By Patient Age
    • Pediatric
    • Adult
  11. Global Market Analysis 2020 to 2024 and Forecast 2025 to 2035, By End User
    • Hospitals
    • Clinics
    • Ambulatory Surgical Centers
    • Long Term Care Centers
    • Home Care
  12. Global Market Analysis 2020 to 2024 and Forecast 2025 to 2035, By Region
    • North America
    • Latin America
    • Western Europe
    • Eastern Europe
    • East Asia
    • South Asia Pacific
    • Middle East and Africa
  13. North America Sales Analysis 2020 to 2024 and Forecast 2025 to 2035, by Key Segments and Countries
  14. Latin America Sales Analysis 2020 to 2024 and Forecast 2025 to 2035, by Key Segments and Countries
  15. Western Europe Sales Analysis 2020 to 2024 and Forecast 2025 to 2035, by Key Segments and Countries
  16. Eastern Europe Sales Analysis 2020 to 2024 and Forecast 2025 to 2035, by Key Segments and Countries
  17. East Asia Sales Analysis 2020 to 2024 and Forecast 2025 to 2035, by Key Segments and Countries
  18. South Asia Pacific Sales Analysis 2020 to 2024 and Forecast 2025 to 2035, by Key Segments and Countries
  19. Middle East and Africa Sales Analysis 2020 to 2024 and Forecast 2025 to 2035, by Key Segments and Countries
  20. Sales Forecast 2025 to 2035 by Product Type, Capacity, Usage, Patient Age, and End User for 30 Countries
  21. Competition Outlook, including Market Structure Analysis, Company Share Analysis by Key Players, and Competition Dashboard
  22. Company Profile
    • Medline Industries, Inc.
    • Cardinal Health, Inc.
    • Hollister Incorporated
    • Teleflex Incorporated
    • Cook Medical
    • Moore Medical LLC
    • Mckesson Medical-Surgical Inc.
    • Arcus Medical LLc
    • Urocare
    • Covidien

List of Tables

  • Table 1: Global Market Value (USD Million) Forecast by Region, 2020 to 2035
  • Table 2: Global Market Volume (Units) Forecast by Region, 2020 to 2035
  • Table 3: Global Market Value (USD Million) Forecast by Product, 2020 to 2035
  • Table 4: Global Market Volume (Units) Forecast by Product, 2020 to 2035
  • Table 5: Global Market Value (USD Million) Forecast by Usage, 2020 to 2035
  • Table 6: Global Market Volume (Units) Forecast by Usage, 2020 to 2035
  • Table 7: Global Market Value (USD Million) Forecast by Capacity, 2020 to 2035
  • Table 8: Global Market Volume (Units) Forecast by Capacity, 2020 to 2035
  • Table 9: Global Market Value (USD Million) Forecast by End User, 2020 to 2035
  • Table 10: Global Market Volume (Units) Forecast by End User, 2020 to 2035
  • Table 11: North America Market Value (USD Million) Forecast by Country, 2020 to 2035
  • Table 12: North America Market Volume (Units) Forecast by Country, 2020 to 2035
  • Table 13: North America Market Value (USD Million) Forecast by Product, 2020 to 2035
  • Table 14: North America Market Volume (Units) Forecast by Product, 2020 to 2035
  • Table 15: North America Market Value (USD Million) Forecast by Usage, 2020 to 2035
  • Table 16: North America Market Volume (Units) Forecast by Usage, 2020 to 2035
  • Table 17: North America Market Value (USD Million) Forecast by Capacity, 2020 to 2035
  • Table 18: North America Market Volume (Units) Forecast by Capacity, 2020 to 2035
  • Table 19: North America Market Value (USD Million) Forecast by End User, 2020 to 2035
  • Table 20: North America Market Volume (Units) Forecast by End User, 2020 to 2035
  • Table 21: Latin America Market Value (USD Million) Forecast by Country, 2020 to 2035
  • Table 22: Latin America Market Volume (Units) Forecast by Country, 2020 to 2035
  • Table 23: Latin America Market Value (USD Million) Forecast by Product, 2020 to 2035
  • Table 24: Latin America Market Volume (Units) Forecast by Product, 2020 to 2035
  • Table 25: Latin America Market Value (USD Million) Forecast by Usage, 2020 to 2035
  • Table 26: Latin America Market Volume (Units) Forecast by Usage, 2020 to 2035
  • Table 27: Latin America Market Value (USD Million) Forecast by Capacity, 2020 to 2035
  • Table 28: Latin America Market Volume (Units) Forecast by Capacity, 2020 to 2035
  • Table 29: Latin America Market Value (USD Million) Forecast by End User, 2020 to 2035
  • Table 30: Latin America Market Volume (Units) Forecast by End User, 2020 to 2035
  • Table 31: Europe Market Value (USD Million) Forecast by Country, 2020 to 2035
  • Table 32: Europe Market Volume (Units) Forecast by Country, 2020 to 2035
  • Table 33: Europe Market Value (USD Million) Forecast by Product, 2020 to 2035
  • Table 34: Europe Market Volume (Units) Forecast by Product, 2020 to 2035
  • Table 35: Europe Market Value (USD Million) Forecast by Usage, 2020 to 2035
  • Table 36: Europe Market Volume (Units) Forecast by Usage, 2020 to 2035
  • Table 37: Europe Market Value (USD Million) Forecast by Capacity, 2020 to 2035
  • Table 38: Europe Market Volume (Units) Forecast by Capacity, 2020 to 2035
  • Table 39: Europe Market Value (USD Million) Forecast by End User, 2020 to 2035
  • Table 40: Europe Market Volume (Units) Forecast by End User, 2020 to 2035
  • Table 41: Asia Pacific Market Value (USD Million) Forecast by Country, 2020 to 2035
  • Table 42: Asia Pacific Market Volume (Units) Forecast by Country, 2020 to 2035
  • Table 43: Asia Pacific Market Value (USD Million) Forecast by Product, 2020 to 2035
  • Table 44: Asia Pacific Market Volume (Units) Forecast by Product, 2020 to 2035
  • Table 45: Asia Pacific Market Value (USD Million) Forecast by Usage, 2020 to 2035
  • Table 46: Asia Pacific Market Volume (Units) Forecast by Usage, 2020 to 2035
  • Table 47: Asia Pacific Market Value (USD Million) Forecast by Capacity, 2020 to 2035
  • Table 48: Asia Pacific Market Volume (Units) Forecast by Capacity, 2020 to 2035
  • Table 49: Asia Pacific Market Value (USD Million) Forecast by End User, 2020 to 2035
  • Table 50: Asia Pacific Market Volume (Units) Forecast by End User, 2020 to 2035
  • Table 51: MEA Market Value (USD Million) Forecast by Country, 2020 to 2035
  • Table 52: MEA Market Volume (Units) Forecast by Country, 2020 to 2035
  • Table 53: MEA Market Value (USD Million) Forecast by Product, 2020 to 2035
  • Table 54: MEA Market Volume (Units) Forecast by Product, 2020 to 2035
  • Table 55: MEA Market Value (USD Million) Forecast by Usage, 2020 to 2035
  • Table 56: MEA Market Volume (Units) Forecast by Usage, 2020 to 2035
  • Table 57: MEA Market Value (USD Million) Forecast by Capacity, 2020 to 2035
  • Table 58: MEA Market Volume (Units) Forecast by Capacity, 2020 to 2035
  • Table 59: MEA Market Value (USD Million) Forecast by End User, 2020 to 2035
  • Table 60: MEA Market Volume (Units) Forecast by End User, 2020 to 2035

List of Figures

  • Figure 1: Global Market Value (USD Million) by Product, 2025 to 2035
  • Figure 2: Global Market Value (USD Million) by Usage, 2025 to 2035
  • Figure 3: Global Market Value (USD Million) by Capacity, 2025 to 2035
  • Figure 4: Global Market Value (USD Million) by End User, 2025 to 2035
  • Figure 5: Global Market Value (USD Million) by Region, 2025 to 2035
  • Figure 6: Global Market Value (USD Million) Analysis by Region, 2020 to 2035
  • Figure 7: Global Market Volume (Units) Analysis by Region, 2020 to 2035
  • Figure 8: Global Market Value Share (%) and BPS Analysis by Region, 2025 to 2035
  • Figure 9: Global Market Y-o-Y Growth (%) Projections by Region, 2025 to 2035
  • Figure 10: Global Market Value (USD Million) Analysis by Product, 2020 to 2035
  • Figure 11: Global Market Volume (Units) Analysis by Product, 2020 to 2035
  • Figure 12: Global Market Value Share (%) and BPS Analysis by Product, 2025 to 2035
  • Figure 13: Global Market Y-o-Y Growth (%) Projections by Product, 2025 to 2035
  • Figure 14: Global Market Value (USD Million) Analysis by Usage, 2020 to 2035
  • Figure 15: Global Market Volume (Units) Analysis by Usage, 2020 to 2035
  • Figure 16: Global Market Value Share (%) and BPS Analysis by Usage, 2025 to 2035
  • Figure 17: Global Market Y-o-Y Growth (%) Projections by Usage, 2025 to 2035
  • Figure 18: Global Market Value (USD Million) Analysis by Capacity, 2020 to 2035
  • Figure 19: Global Market Volume (Units) Analysis by Capacity, 2020 to 2035
  • Figure 20: Global Market Value Share (%) and BPS Analysis by Capacity, 2025 to 2035
  • Figure 21: Global Market Y-o-Y Growth (%) Projections by Capacity, 2025 to 2035
  • Figure 22: Global Market Value (USD Million) Analysis by End User, 2020 to 2035
  • Figure 23: Global Market Volume (Units) Analysis by End User, 2020 to 2035
  • Figure 24: Global Market Value Share (%) and BPS Analysis by End User, 2025 to 2035
  • Figure 25: Global Market Y-o-Y Growth (%) Projections by End User, 2025 to 2035
  • Figure 26: Global Market Attractiveness by Product, 2025 to 2035
  • Figure 27: Global Market Attractiveness by Usage, 2025 to 2035
  • Figure 28: Global Market Attractiveness by Capacity, 2025 to 2035
  • Figure 29: Global Market Attractiveness by End User, 2025 to 2035
  • Figure 30: Global Market Attractiveness by Region, 2025 to 2035
  • Figure 31: North America Market Value (USD Million) by Product, 2025 to 2035
  • Figure 32: North America Market Value (USD Million) by Usage, 2025 to 2035
  • Figure 33: North America Market Value (USD Million) by Capacity, 2025 to 2035
  • Figure 34: North America Market Value (USD Million) by End User, 2025 to 2035
  • Figure 35: North America Market Value (USD Million) by Country, 2025 to 2035
  • Figure 36: North America Market Value (USD Million) Analysis by Country, 2020 to 2035
  • Figure 37: North America Market Volume (Units) Analysis by Country, 2020 to 2035
  • Figure 38: North America Market Value Share (%) and BPS Analysis by Country, 2025 to 2035
  • Figure 39: North America Market Y-o-Y Growth (%) Projections by Country, 2025 to 2035
  • Figure 40: North America Market Value (USD Million) Analysis by Product, 2020 to 2035
  • Figure 41: North America Market Volume (Units) Analysis by Product, 2020 to 2035
  • Figure 42: North America Market Value Share (%) and BPS Analysis by Product, 2025 to 2035
  • Figure 43: North America Market Y-o-Y Growth (%) Projections by Product, 2025 to 2035
  • Figure 44: North America Market Value (USD Million) Analysis by Usage, 2020 to 2035
  • Figure 45: North America Market Volume (Units) Analysis by Usage, 2020 to 2035
  • Figure 46: North America Market Value Share (%) and BPS Analysis by Usage, 2025 to 2035
  • Figure 47: North America Market Y-o-Y Growth (%) Projections by Usage, 2025 to 2035
  • Figure 48: North America Market Value (USD Million) Analysis by Capacity, 2020 to 2035
  • Figure 49: North America Market Volume (Units) Analysis by Capacity, 2020 to 2035
  • Figure 50: North America Market Value Share (%) and BPS Analysis by Capacity, 2025 to 2035
  • Figure 51: North America Market Y-o-Y Growth (%) Projections by Capacity, 2025 to 2035
  • Figure 52: North America Market Value (USD Million) Analysis by End User, 2020 to 2035
  • Figure 53: North America Market Volume (Units) Analysis by End User, 2020 to 2035
  • Figure 54: North America Market Value Share (%) and BPS Analysis by End User, 2025 to 2035
  • Figure 55: North America Market Y-o-Y Growth (%) Projections by End User, 2025 to 2035
  • Figure 56: North America Market Attractiveness by Product, 2025 to 2035
  • Figure 57: North America Market Attractiveness by Usage, 2025 to 2035
  • Figure 58: North America Market Attractiveness by Capacity, 2025 to 2035
  • Figure 59: North America Market Attractiveness by End User, 2025 to 2035
  • Figure 60: North America Market Attractiveness by Country, 2025 to 2035
  • Figure 61: Latin America Market Value (USD Million) by Product, 2025 to 2035
  • Figure 62: Latin America Market Value (USD Million) by Usage, 2025 to 2035
  • Figure 63: Latin America Market Value (USD Million) by Capacity, 2025 to 2035
  • Figure 64: Latin America Market Value (USD Million) by End User, 2025 to 2035
  • Figure 65: Latin America Market Value (USD Million) by Country, 2025 to 2035
  • Figure 66: Latin America Market Value (USD Million) Analysis by Country, 2020 to 2035
  • Figure 67: Latin America Market Volume (Units) Analysis by Country, 2020 to 2035
  • Figure 68: Latin America Market Value Share (%) and BPS Analysis by Country, 2025 to 2035
  • Figure 69: Latin America Market Y-o-Y Growth (%) Projections by Country, 2025 to 2035
  • Figure 70: Latin America Market Value (USD Million) Analysis by Product, 2020 to 2035
  • Figure 71: Latin America Market Volume (Units) Analysis by Product, 2020 to 2035
  • Figure 72: Latin America Market Value Share (%) and BPS Analysis by Product, 2025 to 2035
  • Figure 73: Latin America Market Y-o-Y Growth (%) Projections by Product, 2025 to 2035
  • Figure 74: Latin America Market Value (USD Million) Analysis by Usage, 2020 to 2035
  • Figure 75: Latin America Market Volume (Units) Analysis by Usage, 2020 to 2035
  • Figure 76: Latin America Market Value Share (%) and BPS Analysis by Usage, 2025 to 2035
  • Figure 77: Latin America Market Y-o-Y Growth (%) Projections by Usage, 2025 to 2035
  • Figure 78: Latin America Market Value (USD Million) Analysis by Capacity, 2020 to 2035
  • Figure 79: Latin America Market Volume (Units) Analysis by Capacity, 2020 to 2035
  • Figure 80: Latin America Market Value Share (%) and BPS Analysis by Capacity, 2025 to 2035
  • Figure 81: Latin America Market Y-o-Y Growth (%) Projections by Capacity, 2025 to 2035
  • Figure 82: Latin America Market Value (USD Million) Analysis by End User, 2020 to 2035
  • Figure 83: Latin America Market Volume (Units) Analysis by End User, 2020 to 2035
  • Figure 84: Latin America Market Value Share (%) and BPS Analysis by End User, 2025 to 2035
  • Figure 85: Latin America Market Y-o-Y Growth (%) Projections by End User, 2025 to 2035
  • Figure 86: Latin America Market Attractiveness by Product, 2025 to 2035
  • Figure 87: Latin America Market Attractiveness by Usage, 2025 to 2035
  • Figure 88: Latin America Market Attractiveness by Capacity, 2025 to 2035
  • Figure 89: Latin America Market Attractiveness by End User, 2025 to 2035
  • Figure 90: Latin America Market Attractiveness by Country, 2025 to 2035
  • Figure 91: Europe Market Value (USD Million) by Product, 2025 to 2035
  • Figure 92: Europe Market Value (USD Million) by Usage, 2025 to 2035
  • Figure 93: Europe Market Value (USD Million) by Capacity, 2025 to 2035
  • Figure 94: Europe Market Value (USD Million) by End User, 2025 to 2035
  • Figure 95: Europe Market Value (USD Million) by Country, 2025 to 2035
  • Figure 96: Europe Market Value (USD Million) Analysis by Country, 2020 to 2035
  • Figure 97: Europe Market Volume (Units) Analysis by Country, 2020 to 2035
  • Figure 98: Europe Market Value Share (%) and BPS Analysis by Country, 2025 to 2035
  • Figure 99: Europe Market Y-o-Y Growth (%) Projections by Country, 2025 to 2035
  • Figure 100: Europe Market Value (USD Million) Analysis by Product, 2020 to 2035
  • Figure 101: Europe Market Volume (Units) Analysis by Product, 2020 to 2035
  • Figure 102: Europe Market Value Share (%) and BPS Analysis by Product, 2025 to 2035
  • Figure 103: Europe Market Y-o-Y Growth (%) Projections by Product, 2025 to 2035
  • Figure 104: Europe Market Value (USD Million) Analysis by Usage, 2020 to 2035
  • Figure 105: Europe Market Volume (Units) Analysis by Usage, 2020 to 2035
  • Figure 106: Europe Market Value Share (%) and BPS Analysis by Usage, 2025 to 2035
  • Figure 107: Europe Market Y-o-Y Growth (%) Projections by Usage, 2025 to 2035
  • Figure 108: Europe Market Value (USD Million) Analysis by Capacity, 2020 to 2035
  • Figure 109: Europe Market Volume (Units) Analysis by Capacity, 2020 to 2035
  • Figure 110: Europe Market Value Share (%) and BPS Analysis by Capacity, 2025 to 2035
  • Figure 111: Europe Market Y-o-Y Growth (%) Projections by Capacity, 2025 to 2035
  • Figure 112: Europe Market Value (USD Million) Analysis by End User, 2020 to 2035
  • Figure 113: Europe Market Volume (Units) Analysis by End User, 2020 to 2035
  • Figure 114: Europe Market Value Share (%) and BPS Analysis by End User, 2025 to 2035
  • Figure 115: Europe Market Y-o-Y Growth (%) Projections by End User, 2025 to 2035
  • Figure 116: Europe Market Attractiveness by Product, 2025 to 2035
  • Figure 117: Europe Market Attractiveness by Usage, 2025 to 2035
  • Figure 118: Europe Market Attractiveness by Capacity, 2025 to 2035
  • Figure 119: Europe Market Attractiveness by End User, 2025 to 2035
  • Figure 120: Europe Market Attractiveness by Country, 2025 to 2035
  • Figure 121: Asia Pacific Market Value (USD Million) by Product, 2025 to 2035
  • Figure 122: Asia Pacific Market Value (USD Million) by Usage, 2025 to 2035
  • Figure 123: Asia Pacific Market Value (USD Million) by Capacity, 2025 to 2035
  • Figure 124: Asia Pacific Market Value (USD Million) by End User, 2025 to 2035
  • Figure 125: Asia Pacific Market Value (USD Million) by Country, 2025 to 2035
  • Figure 126: Asia Pacific Market Value (USD Million) Analysis by Country, 2020 to 2035
  • Figure 127: Asia Pacific Market Volume (Units) Analysis by Country, 2020 to 2035
  • Figure 128: Asia Pacific Market Value Share (%) and BPS Analysis by Country, 2025 to 2035
  • Figure 129: Asia Pacific Market Y-o-Y Growth (%) Projections by Country, 2025 to 2035
  • Figure 130: Asia Pacific Market Value (USD Million) Analysis by Product, 2020 to 2035
  • Figure 131: Asia Pacific Market Volume (Units) Analysis by Product, 2020 to 2035
  • Figure 132: Asia Pacific Market Value Share (%) and BPS Analysis by Product, 2025 to 2035
  • Figure 133: Asia Pacific Market Y-o-Y Growth (%) Projections by Product, 2025 to 2035
  • Figure 134: Asia Pacific Market Value (USD Million) Analysis by Usage, 2020 to 2035
  • Figure 135: Asia Pacific Market Volume (Units) Analysis by Usage, 2020 to 2035
  • Figure 136: Asia Pacific Market Value Share (%) and BPS Analysis by Usage, 2025 to 2035
  • Figure 137: Asia Pacific Market Y-o-Y Growth (%) Projections by Usage, 2025 to 2035
  • Figure 138: Asia Pacific Market Value (USD Million) Analysis by Capacity, 2020 to 2035
  • Figure 139: Asia Pacific Market Volume (Units) Analysis by Capacity, 2020 to 2035
  • Figure 140: Asia Pacific Market Value Share (%) and BPS Analysis by Capacity, 2025 to 2035
  • Figure 141: Asia Pacific Market Y-o-Y Growth (%) Projections by Capacity, 2025 to 2035
  • Figure 142: Asia Pacific Market Value (USD Million) Analysis by End User, 2020 to 2035
  • Figure 143: Asia Pacific Market Volume (Units) Analysis by End User, 2020 to 2035
  • Figure 144: Asia Pacific Market Value Share (%) and BPS Analysis by End User, 2025 to 2035
  • Figure 145: Asia Pacific Market Y-o-Y Growth (%) Projections by End User, 2025 to 2035
  • Figure 146: Asia Pacific Market Attractiveness by Product, 2025 to 2035
  • Figure 147: Asia Pacific Market Attractiveness by Usage, 2025 to 2035
  • Figure 148: Asia Pacific Market Attractiveness by Capacity, 2025 to 2035
  • Figure 149: Asia Pacific Market Attractiveness by End User, 2025 to 2035
  • Figure 150: Asia Pacific Market Attractiveness by Country, 2025 to 2035
  • Figure 151: MEA Market Value (USD Million) by Product, 2025 to 2035
  • Figure 152: MEA Market Value (USD Million) by Usage, 2025 to 2035
  • Figure 153: MEA Market Value (USD Million) by Capacity, 2025 to 2035
  • Figure 154: MEA Market Value (USD Million) by End User, 2025 to 2035
  • Figure 155: MEA Market Value (USD Million) by Country, 2025 to 2035
  • Figure 156: MEA Market Value (USD Million) Analysis by Country, 2020 to 2035
  • Figure 157: MEA Market Volume (Units) Analysis by Country, 2020 to 2035
  • Figure 158: MEA Market Value Share (%) and BPS Analysis by Country, 2025 to 2035
  • Figure 159: MEA Market Y-o-Y Growth (%) Projections by Country, 2025 to 2035
  • Figure 160: MEA Market Value (USD Million) Analysis by Product, 2020 to 2035
  • Figure 161: MEA Market Volume (Units) Analysis by Product, 2020 to 2035
  • Figure 162: MEA Market Value Share (%) and BPS Analysis by Product, 2025 to 2035
  • Figure 163: MEA Market Y-o-Y Growth (%) Projections by Product, 2025 to 2035
  • Figure 164: MEA Market Value (USD Million) Analysis by Usage, 2020 to 2035
  • Figure 165: MEA Market Volume (Units) Analysis by Usage, 2020 to 2035
  • Figure 166: MEA Market Value Share (%) and BPS Analysis by Usage, 2025 to 2035
  • Figure 167: MEA Market Y-o-Y Growth (%) Projections by Usage, 2025 to 2035
  • Figure 168: MEA Market Value (USD Million) Analysis by Capacity, 2020 to 2035
  • Figure 169: MEA Market Volume (Units) Analysis by Capacity, 2020 to 2035
  • Figure 170: MEA Market Value Share (%) and BPS Analysis by Capacity, 2025 to 2035
  • Figure 171: MEA Market Y-o-Y Growth (%) Projections by Capacity, 2025 to 2035
  • Figure 172: MEA Market Value (USD Million) Analysis by End User, 2020 to 2035
  • Figure 173: MEA Market Volume (Units) Analysis by End User, 2020 to 2035
  • Figure 174: MEA Market Value Share (%) and BPS Analysis by End User, 2025 to 2035
  • Figure 175: MEA Market Y-o-Y Growth (%) Projections by End User, 2025 to 2035
  • Figure 176: MEA Market Attractiveness by Product, 2025 to 2035
  • Figure 177: MEA Market Attractiveness by Usage, 2025 to 2035
  • Figure 178: MEA Market Attractiveness by Capacity, 2025 to 2035
  • Figure 179: MEA Market Attractiveness by End User, 2025 to 2035
  • Figure 180: MEA Market Attractiveness by Country, 2025 to 2035

Frequently Asked Questions

What was the overall size of the Urinary Bag market in 2025?

The overall market size for Urinary Bag market was USD 2,070.115 Million in 2025.

How big the bio is based Urinary Bag market expected in 2035?

The Urinary Bag market is expected to reach USD 3,064.276 Million in 2035.

What will drive the demand for Urinary Bag market during the forecast period?

Increasing prevalence of urinary incontinence, rising aging population, post-surgical care needs, and growing demand for convenient, high-capacity urinary solutions will drive the urinary bag market during the forecast period.

List the top 5 countries contributing in Urinary Bag market?

The top 5 countries which drives the development of Urinary Bag market are USA, European Union, Japan, South Korea and UK.

Which segment in type is expected to lead Urinary Bag market?

Drainage Bags demand supplier to command significant share over the assessment period.

Explore Similar Insights

Future Market Insights

Urinary Bag Market