

- Market Size (2026)
- USD 860.6 Mn
- Forecast (2036)
- USD 1677.2 Mn
- CAGR (2026 to 2036)
- 6.9%
How big is the VLF Test Equipment Market in 2026?
USD 860.6 million in 2026 and USD 1,677.2 million by 2036 at a 6.9% CAGR.
Grid owners are moving from pass-fail cable testing toward proof that supports energization decisions and asset replacement plans. IEEE Standards Association published IEEE 400.2-2024 in September 2024 for field testing of shielded power cable systems using VLF below 1 Hz. That reference gives utilities a common method for comparing withstand tests and diagnostic records. The shift supports demand for electrical testing equipment that can create repeatable results for cable owners and contractors. Substation teams can connect those records to high voltage power transformer acceptance and feeder readiness reviews.
Utilities and cable contractors buy VLF systems for commissioning work and maintenance diagnostics. Industrial plants and renewable project owners use the same tools before collector circuits or internal distribution lines enter service. Buyers value portable voltage output that supports varied field sites. They also need guided workflows and reporting that asset teams can review. This buyer pattern also supports electrical testing services in markets where skilled crews or project schedules make equipment ownership less practical. Industrial buyers using medium voltage drives also need cable tests that protect shutdown schedules.
North America and Western Europea adoption is shaped by grid renewal and regulated network spending. East Asian and South Asian demand is influenced by renewable interconnection and industrial load growth. Distribution reliability work adds another purchase reason. VLF equipment gains value from connected cable acceptance and tan delta diagnostics. Partial discharge checks and cable fault locator workflows add further value. The strategic issue for buyers is selecting equipment that fits field crews and produces credible records for asset decisions. Industrial maintenance teams apply the same evidence mindset used in machine condition monitoring programs.
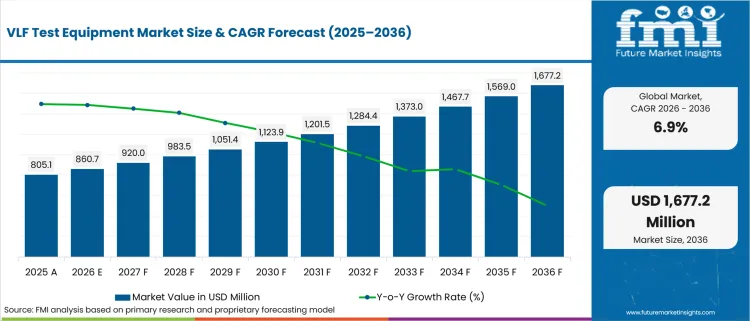
| Metric | Value |
|---|---|
| 2025 Market Size | USD 805.1 million |
| 2026 Market Size | USD 860.6 million |
| 2036 Market Size | USD 1,677.2 million |
| Forecast CAGR (2026-2036) | 6.9% |
| Equipment Type Focus | VLF Hipot Testers |
| VLF Hipot Testers Share (2026) | 41.0% |
| Voltage Rating Focus | 30-60 kV |
| 30-60 kV Share (2026) | 47.0% |
| Application Focus | Medium Voltage Cable Testing |
| Medium Voltage Cable Testing Share (2026) | 52.0% |
| Fastest-growing Country | China |
| China CAGR by 2036 | 7.8% |
Summary of the VLF Test Equipment Market
| Market Signal | Commercial Impact |
|---|---|
| Demand and Growth Drivers | Demand for VLF test equipment is increasing as utilities, renewable developers, and cable contractors strengthen cable commissioning, condition assessment, and standards-based testing programs.
|
| Product and Segment View | VLF Hipot testers, 30-60 kV systems, and medium-voltage cable testing continue to dominate procurement as utilities prioritize portable, standards-compliant cable diagnostics.
|
| Geography and Growth Outlook | Asia remains the strongest growth region through renewable energy expansion and transmission investment, while the United States supports demand through ongoing grid modernization and utility-scale generation projects.
|
| Competitive Landscape | Competition increasingly focuses on diagnostic integration, field reporting, waveform capability, calibration support, and service depth across utility cable testing applications.
|
| Analyst Perspective | VLF test equipment is evolving into a cable asset management tool where diagnostic capability, reporting quality, operator support, and standards compliance increasingly determine supplier selection.
- Nikhil Kaitwade, Principal Consultant at Future Market Insights |
How is the VLF test equipment market segmented?
The VLF Test Equipment industry is segmented by equipment type, voltage rating, application, end use, sales channel, and region.
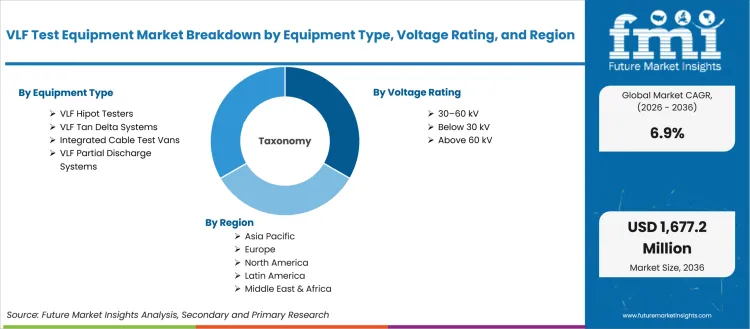
The VLF test equipment market is segmented by equipment type, voltage rating, application, end use, sales channel, and region. By equipment type, the market covers VLF Hipot Testers, VLF Tan Delta Systems, VLF Partial Discharge Systems, and Integrated Cable Test Vans. Voltage rating includes below 30 kV, 30-60 kV, and above 60 kV. Application covers Medium Voltage Cable Testing, High Voltage Cable Testing, Commissioning, and Maintenance Diagnostics. End use includes Utilities, Cable Contractors, Industrial Plants, and Renewable Energy Projects. Sales channel spans Direct OEM, Electrical Test Distributors, and Rental or Service. Regional coverage extends across North America, Latin America, Western Europe, Eastern Europe, East Asia, South Asia and Pacific, and the Middle East and Africa.
Why do VLF Hipot Testers matter within the equipment type category?
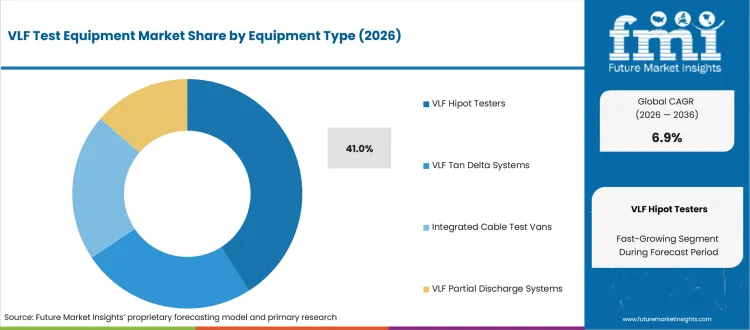
Cable owners need a clear withstand test before a new or repaired circuit enters service. VLF hipot units remain relevant due to their direct role in proving cable insulation under field conditions. Contractors also prefer simple systems for acceptance projects that do not justify a full diagnostic van. This keeps the equipment type tied to commissioning work and repeat maintenance schedules.
- In 2026, VLF Hipot Testers are anticipated to hold 41.0% of equipment type demand. The share is driven by portable pass-fail testing needs across utility and contractor work. HV Diagnostics describes its HVA34 as a single-piece unit weighing 44 lbs. That portability helps crews manage site-to-site cable testing.
- For contractors, VLF hipot systems reduce project risk by creating an acceptance record before the circuit is energized. Buyers can match voltage output and test duration to bid requirements. Reporting needs can be covered without buying a heavier diagnostic package at the first stage.
How do buyers evaluate 30-60 kV systems within the voltage rating category?
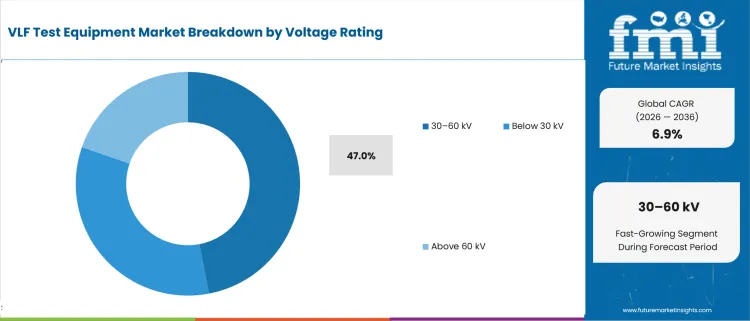
Medium-voltage assets create the main voltage-selection problem for buyers as too little output limits cable coverage and too much system weight reduces field practicality. The 30-60 kV band fits many feeder and collector-circuit tests that utility and renewable crews perform under tight access windows. This makes voltage rating a balance between capacity and portability. Service support remains part of the same decision.
- The 30-60 kV category is predicted to hold 47.0% share in 2026, supported by medium-voltage feeder coverage and renewable collector circuits. b2 electronics lists the HVA54-3 at 54 kV peak output. That product range shows why buyers cluster around this voltage band.
- Utility maintenance teams using 30-60 kV equipment can cover common MV cable classes and keep field transport practical. The executive case is fewer equipment substitutions during commissioning work and a clearer path for standard reports across multiple service territories.
What supports demand for Medium Voltage Cable Testing applications?
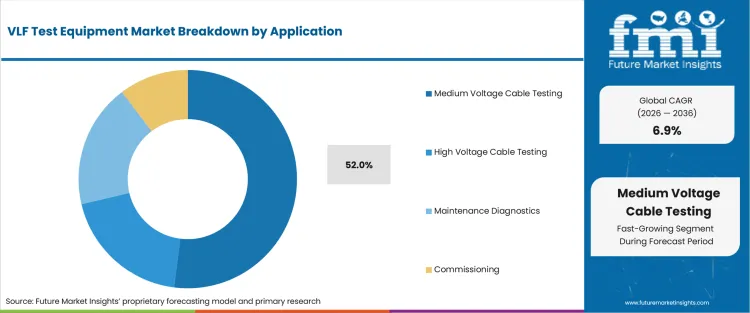
Medium-voltage networks create recurring test needs across substations and feeders. Plants and renewable collector systems add further field demand. These assets are numerous enough to create repeat equipment purchases and critical enough to require proof before energization. Buyers need systems that cover withstand testing and diagnostic checks without turning each maintenance visit into a large engineering project.
- Medium Voltage Cable Testing is anticipated to account for 52.0% share in 2026, attributable to commissioning and maintenance work on distribution assets. Megger identifies VLF Sine 37 kV as suited to typical MV distribution cables. This supports the application’s role in routine field programs.
- Asset managers benefit from MV-focused VLF systems due to better handover records and fewer uncertain insulation decisions. The workflow value is reinforced by field crews that can combine sheath checks and withstand tests. Diagnostic exports during the same maintenance visit improve the record.
Why are utilities meaningfully positioned within end use?
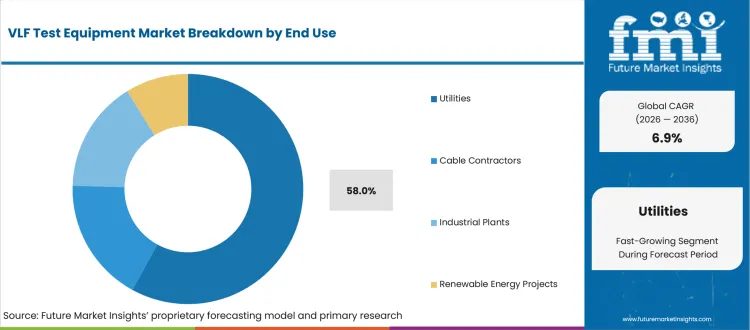
Utilities set the acceptance rules that contractors and equipment suppliers must follow. Their operating problem is not only cable failure but the documentation needed to approve switching plans and maintenance work. VLF systems become relevant for utilities due to the link between test records and asset planning. Safety review and outage control add further value.
- Utilities is predicted to hold 58.0% share in 2026, led by their role in defining test procedures and acceptance evidence. The USA Department of Energy’s November 2024 undergrounding report reinforces attention on transmission and distribution cable choices. That policy context supports repeat testing needs.
- Utility buyers gain value from VLF systems that produce consistent results across service areas and contractor teams. This reduces debate over whether a cable passed acceptance criteria and helps asset managers prioritize repair or replacement before a planned outage closes.
How is Direct OEM positioned within the sales channel category?
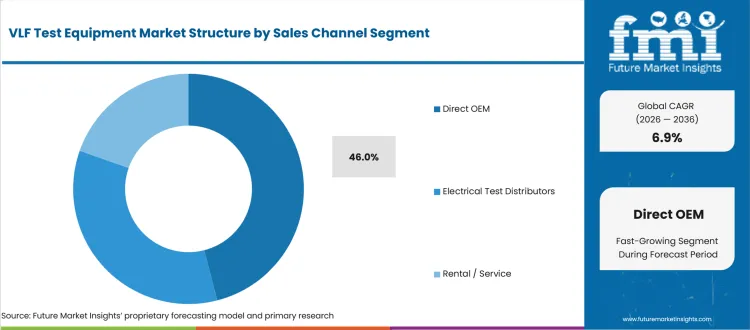
VLF purchasing often creates support questions after the equipment arrives. Buyers need calibration and operator training. Reporting setup and fast repair access also shape channel preference. Direct OEM buying remains relevant due to safety and interpretation risk in high-voltage test systems. Distributors still matter for availability, yet complex diagnostic systems often need the supplier closer to the user.
- Direct OEM is estimated to hold 46.0% share in 2026, reinforced by buyer preference for one accountable support route. BAUR states that it can calibrate the PHG 80 TD PD under ISO/IEC 17025 accreditation. This shows why OEM service depth influences procurement.
- For procurement leaders, direct OEM engagement reduces handoff risk during setup and troubleshooting. Buyers gain a clearer route for application guidance and software questions. Calibration planning across fleet assets supports high-voltage cable work.
What are the drivers, restraints, and opportunities in the VLF test equipment market?
Near-term purchases are being shaped by the cable acceptance requirement, technician-capacity constraint, and diagnostic upgrade route outlined below.
- Driver: Cable acceptance spending is driven by renewable interconnection and utility renewal programs that require proof before energization.
- Restraint: Diagnostic upgrade adoption is constrained by skilled operator availability and the need to interpret tan delta or partial discharge results.
- Opportunity: Integrated VLF platforms gain traction from buyers that want withstand testing and diagnostics in one field workflow. Reporting adds a further value point.
Renewable and grid-connection programs are expanding the number of cable circuits that need acceptance evidence. The International Energy Agency reported in 2025 that renewable electricity additions for 2025 to 2030 total 4,600 GW. That figure points to a larger installed base of collector circuits and substations. Distribution links add further testing points. VLF suppliers gain opportunity from equipment that shortens acceptance testing and gives asset owners records that are easy to review.
Operator capacity can delay adoption of tan delta and partial discharge functions even where buyers understand their diagnostic value. The USA Bureau of Labor Statistics reported 9,600 annual openings for electrical and electronics installers and repairers across 2024 to 2034. That labor signal matters for VLF vendors. Suppliers that build training and guided workflows into the offer can convert the restraint into a service-led sales route. Remote support strengthens that route.
Integrated platforms create a better commercial route for suppliers that can combine hardware and reporting. Diagnostic expansion adds the premium value layer. Doble describes an AC VLF fault locator and hipot burn supply able to test feeders from 4 kV to 33 kV. That type of combined field capability supports buyers that want fewer handoffs between fault location and acceptance testing. It also gives suppliers a path toward premium support contracts.
Which country CAGRs are profiled in the VLF test equipment market?
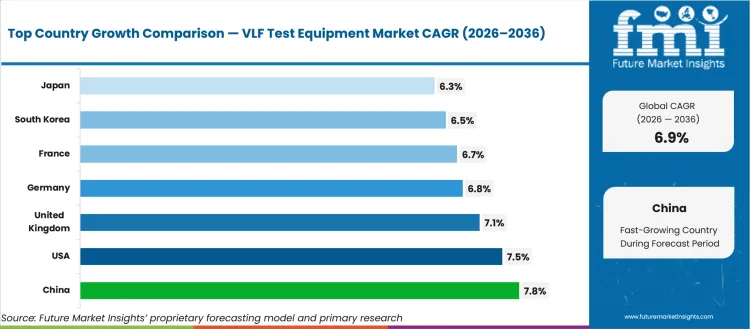
| Country | CAGR |
|---|---|
| United States | 7.5% |
| United Kingdom | 7.1% |
| Germany | 6.8% |
| France | 6.7% |
| Japan | 6.3% |
| China | 7.8% |
| South Korea | 6.5% |
| India | 7.3% |
How do country-level CAGRs compare in the VLF test equipment market?
Country CAGR profiles should be read against the cable work that supports grid investment. North America and Western Europe connect purchases to utility renewal and regulated networks. Contractor service channels shape field access. East Asian demand reflects renewable integration and compact high-reliability grids. South Asian demand is closer to transmission buildout and project handover. These differences matter for buyers and suppliers. A country showing a similar CAGR can still need a different channel model and training plan. Voltage mix or rental access can alter supplier strategy.
- By 2036, the United States is projected to record 7.5% CAGR. The profile is shaped by power-capacity additions and utility renewal work. The USA Energy Information Administration reported in February 2026 that developers planned 86 GW of new utility-scale generating capacity for 2026. That pipeline supports collector-circuit and substation testing. The USA profile differs due to its rental ecosystem and national service expectations.
- The United Kingdom is expected to grow at 7.1% CAGR during the forecast period, supported by regulated distribution investment and DNO procurement discipline. Ofgem reported in January 2026 that distribution companies expect to invest around GBP 23.1 billion under RIIO-ED2. This supports planned cable reinforcement and acceptance testing. The UK profile is more framework-led than project-spot buying.
- Over the assessment period, Germany is forecast to advance at 6.8% CAGR. The profile is attributable to renewable capacity and technically conservative utility evaluation. Germany’s economy ministry reported about 178.1 GW of renewable net capacity. Solar represented 90.3 GW and wind represented 70.8 GW. This scale supports cable diagnostics and procurement remains tied to standards. Calibration and local technical support affect supplier acceptance.
- Through 2036, France is anticipated to post 6.7% CAGR. The profile is reinforced by solar growth and structured network procurement. RTE reported that French solar capacity expanded by 5.9 GW in 2025 and reached 30.4 GW at year end. That addition creates MV connection work and recurring cable tests. France differs due to concentrated buyer influence around network operators.
- Japan is likely to expand at 6.3% CAGR by 2036, influenced by renewable targets and dense urban reliability needs. Japan’s energy agency reported in November 2025 that solar power generation is expected to move from 9.8% in FY2023 to 23-29% in FY2040. This supports careful cable assessment. Japan’s profile favors compact equipment and local service confidence.
- China is estimated to rise at 7.8% CAGR between 2026 and 2036, propelled by renewable additions and large utility connection programs. The State Council reported in January 2025 that renewable energy added 373 million kilowatts of capacity in 2024. This creates many commissioning points. China differs due to scale and regional service needs. Price-sensitive procurement also shapes supplier positioning.
- Demand in South Korea is projected to grow at 6.5% CAGR by 2036, supported by distributed-grid reform and industrial reliability requirements. The Ministry of Climate, Energy and Environment announced in February 2026 that the initiative carries about KRW 321 billion in government funding. This profile links VLF demand to flexible distribution assets and local maintenance planning.
- The VLF test equipment sector in India is forecast to record 7.3% CAGR over the assessment period, driven by renewable-linked transmission approvals and EPC project handover needs. India’s Press Information Bureau reported in January 2026 that 25.8 GW of RE-linked ISTS capacity was approved from January to November 2025. India differs due to price sensitivity and rental-channel relevance.
Who are the notable companies in the VLF test equipment market?
Megger, BAUR, HV Diagnostics, High Voltage Inc., OMICRON, Haefely, b2 electronics, and SCOPE T&M are the notable companies shaping this market.
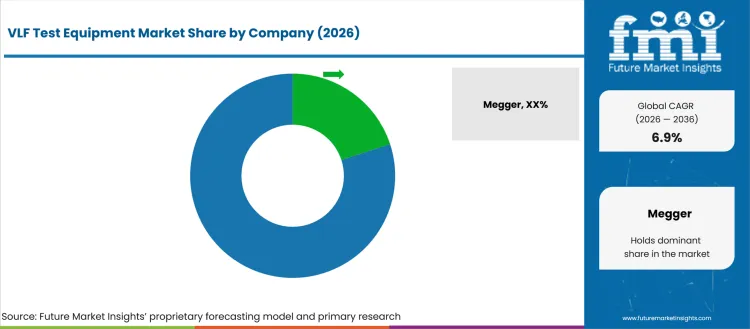
Supplier competition is structured around how much of the cable-testing workflow a buyer wants to control in one purchase. Megger and BAUR are more relevant for buyers seeking VLF output and tan delta diagnostics. Report depth also matters in integrated systems. HV Diagnostics and High Voltage Inc. are suited to buyers that prioritize portable VLF hardware. b2 electronics is relevant for field serviceability. OMICRON and Haefely matter for diagnostic-heavy users. SCOPE T&M and distributors gain relevance in India and project-led accounts due to local access. Specialist distributors that sell fiber optic test equipment understand calibration-led field purchases. Safety-focused buyers also compare cable proof workflows against EV charging cable and connector durability testing programs.
- Megger and BAUR address buyers that want integrated cable diagnostics beyond standalone voltage output. Megger’s VLF range includes VLF Sine 37 kV and VLF Sine 45 kV. VLF Sine Wave 62 kV extends the range. BAUR’s PHG 80 TD PD supports VLF and tan delta workflows. Partial discharge capability extends the diagnostic fit.
- Contractor-led accounts often evaluate HV Diagnostics and High Voltage Inc. b2 electronics also fits buyers seeking portable field equipment and broader voltage choices. HV Diagnostics describes HVA instruments as portable oil-free VLF and DC systems. b2 electronics positions the HVA series across MV and HV cable testing.
- Diagnostic-heavy utilities consider OMICRON and Haefely due to partial discharge analysis and broader insulation assessment needs. OMICRON describes offline power cable testing that covers dielectric condition and partial discharge. Power factor and dielectric response extend the assessment scope. This makes the group relevant to condition-based programs.
- Regional channels matter for buyers that need training and repair response closer to the project site. SCOPE T&M states that it serves electrical energy systems and customers in 50 countries. This type of local support helps price-sensitive buyers compare imported systems against service access and rental availability.
Competitive Benchmarking: VLF Test Equipment Market
| Company | VLF Output Portfolio | Diagnostic Integration | Service Fit | Geographic Reach |
|---|---|---|---|---|
| Megger | High | Strong | Strong | Global |
| BAUR | High | Strong | Strong | Global |
| HV Diagnostics | High | Medium | Strong | Global |
| High Voltage Inc. | High | Medium | Medium | North America and Export |
| b2 electronics | High | Strong | Medium | Global |
| OMICRON | Medium | Strong | Strong | Global |
| Haefely | Medium | Strong | Medium | Global |
| SCOPE T&M | Medium | Medium | Strong | India and Export |
Source: Future Market Insights competitive analysis, 2026. Ratings reflect portfolio relevance and workflow fit. Service capability and geographic reach are also considered.
Key Developments in the VLF Test Equipment Market
- In June 2025, High Voltage Inc. featured its VLF E-Series as its quarterly product line for VLF AC hipot testing. The company highlighted 0-34 kV peak and 0-65 kV peak models with E-Link remote operation and TD-65E tan delta bridge integration. Field buyers gain a clearer route to combine withstand testing with diagnostics without changing the full test setup.
- In April 2025, Megger published field evidence comparing VLF sine testing with DAC and VLF CR/Slope excitation for medium-voltage cable diagnostics. The case showed that DAC and VLF CR/Slope identified seven critical defects at 1.7 U0 while 0.1 Hz VLF sine identified four. The finding supports demand for test platforms that give utilities more than a basic withstand result during condition assessment.
Key Players in the VLF Test Equipment Market
Integrated Cable Diagnostic Suppliers
- Megger
- BAUR
- OMICRON
- Haefely
Portable VLF Specialists
- HV Diagnostics
- High Voltage Inc.
- b2 electronics
Regional and Channel Providers
- SCOPE T&M
- Electrical test distributors
- Rental and service providers
VLF Test Equipment Market - Report Scope
| Coverage field | Report scope |
|---|---|
| Market breakdown | VLF Test Equipment Market Breakdown By Equipment Type, Voltage Rating, Application, End Use, Sales Channel, and Region |
| Market Definition | Very low frequency high-voltage systems used to test shielded medium and high-voltage cable insulation during commissioning and maintenance. |
| Regions Covered | North America, Latin America, Western Europe, Eastern Europe, East Asia, South Asia and Pacific, Middle East and Africa |
| Countries Covered | United States, United Kingdom, Germany, France, Japan, China, South Korea, India, and broader regional coverage |
| Key Companies Profiled | Megger, BAUR, HV Diagnostics, High Voltage Inc., OMICRON, Haefely, b2 electronics, and SCOPE T&M |
| Forecast Period | 2026 to 2036 |
| Approach | Hybrid bottom-up and top-down sizing using equipment scope, channel behavior, country grid activity, and supplier portfolio validation |
VLF Test Equipment Market - Research Methodology
| Method | Approach |
|---|---|
| Primary Research | FMI analysts reviewed input from utility engineers, cable contractors, industrial maintenance teams, rental firms, and high-voltage test-equipment suppliers. The review focused on test frequency, voltage-rating choice, outage limits, reporting needs, and channel preference. |
| Desk Research | Desk research covered IEEE guidance, government grid and renewable data, official energy reports, regulator publications, and supplier product pages. Company relevance was checked against public VLF, tan delta, partial discharge, and cable diagnostics portfolios. |
| Market Sizing and Forecasting | The model combined equipment volumes, average system prices, voltage-rating mix, country grid activity, end-use demand, and sales-channel structure. Replacement purchases and project-based rentals were treated separately to reduce double counting. |
| Data Validation | Forecasts were checked against grid spending signals, renewable interconnection activity, supplier product evidence, and electrical testing service demand. Duplicate external statistics were removed before final allocation to maintain section-level evidence uniqueness. |
VLF Test Equipment Market by Segments
VLF Test Equipment Market segmented by Equipment Type:
- VLF Hipot Testers
- VLF Tan Delta Systems
- VLF Partial Discharge Systems
- Integrated Cable Test Vans
VLF Test Equipment Market segmented by Voltage Rating:
- Below 30 kV
- 30-60 kV
- Above 60 kV
VLF Test Equipment Market segmented by Application:
- Medium Voltage Cable Testing
- High Voltage Cable Testing
- Commissioning
- Maintenance Diagnostics
VLF Test Equipment Market segmented by End Use:
- Utilities
- Cable Contractors
- Industrial Plants
- Renewable Energy Projects
VLF Test Equipment Market segmented by Sales Channel:
- Direct OEM
- Electrical Test Distributors
- Rental / Service
VLF Test Equipment Market by Region:
- North America
- United States
- Canada
- Mexico
- Latin America
- Brazil
- Chile
- Rest of Latin America
- Western Europe
- Germany
- United Kingdom
- Italy
- Spain
- France
- Nordics
- BENELUX
- Rest of Western Europe
- Eastern Europe
- Russia
- Poland
- Hungary
- Balkan and Baltic Countries
- Rest of Eastern Europe
- East Asia
- China
- Japan
- South Korea
- South Asia and Pacific
- India
- ASEAN
- Australia and New Zealand
- Rest of South Asia and Pacific
- Middle East and Africa
- Kingdom of Saudi Arabia
- Other GCC Countries
- Turkiye
- South Africa
- Other African Union
- Rest of Middle East and Africa
Research Sources and Bibliography
- IEEE Standards Association. (2024, September 27). IEEE Guide for Field Testing of Shielded Power Cable Systems Using Very Low Frequency (VLF) (less than 1 Hz). IEEE.
- USA Energy Information Administration. (2026, February 20). New USA electric generating capacity expected to reach a record high in 2026. USA EIA.
- International Energy Agency. (2025, October). Renewable electricity - Renewables 2025 - Analysis. IEA.
- Office of Gas and Electricity Markets. (2026, January 15). RIIO-2 Electricity Distribution: annual report 2024 to 2025. Ofgem.
- Federal Ministry for Economic Affairs and Energy. (2026). An electricity market for the energy transition. BMWE.
- RTE. (2026). 2025 Review - Key findings. RTE.
- Agency for Natural Resources and Energy. (2025, November 11). A Closer Look at the 7th Strategic Energy Plan. METI.
- The State Council of the People’s Republic of China. (2025, January 28). Renewable energy accounts for 56 pct of China’s total installed capacity. The State Council.
- Ministry of Climate, Energy and Environment. (2026, February 20). Carbon-Neutral “Next-Generation Distributed Power Grid” Launches Full-Scale Rollout This Year. Republic of Korea.
- Press Information Bureau. (2026, January 16). Year End Review of Ministry of Power - 2025. Government of India.
- USA Bureau of Labor Statistics. (2025, August). Electrical Power-Line Installers and Repairers. Occupational Outlook Handbook.
- USA Bureau of Labor Statistics. (2026, May 15). Electrical and Electronics Installers and Repairers. Occupational Outlook Handbook.
- b2 electronics. (2026). VLF Cable Test Sets. b2 electronics.
- Doble Engineering Company. (2026). AC VLF Fault Locator/Hipot/Burn Supply. Doble.
- High Voltage Inc. June 2025. HVI Q2 2025 Newsletter. High Voltage Inc.
- Megger. April 14, 2025. Advanced cable test and diagnostics in action. Megger.
This bibliography is provided for reader reference and uses primary government sources. Standards-body sources, official trade body sources and company sources are also included.
This Report Answers
- What is the expected value of the VLF Test Equipment Market in 2026 and 2036?
- What CAGR is projected for VLF test equipment demand from 2026 to 2036?
- Which equipment type holds a notable share in the market during 2026?
- Which voltage rating is meaningfully positioned in VLF test equipment demand?
- How do utilities use VLF testing during cable commissioning and maintenance?
- Which countries show relevant growth in VLF test equipment demand?
- How do tan delta and partial discharge functions affect supplier positioning?
- Which companies compete in VLF cable testing and diagnostic equipment?
- How does FMI estimate market size and forecast growth for VLF test equipment?
Frequently Asked Questions
What is driving growth in the VLF Test Equipment Market?
Growth is driven by renewable interconnection work and utility cable renewal. Standard-based test records and diagnostic reporting add support.
Why should executives track the VLF Test Equipment Market?
Executives should track this market because VLF testing is becoming central to cable acceptance decisions that affect grid reliability outage risk and asset life planning.
What business problem does the VLF Test Equipment Market address?
It provides a standardized low stress method to verify medium voltage cable insulation before energization or maintenance handover.
What should procurement leaders evaluate before selecting suppliers?
Procurement leaders should evaluate voltage range diagnostic capability reporting quality operator training support and local calibration access.
What can limit return on investment for buyers?
Return on investment can be limited by skilled operator shortages complex diagnostic interpretation and limited integration with asset management records.
How can suppliers build executive confidence?
Suppliers build confidence by delivering portable field safe equipment clear audit ready reports reliable service support and structured training programs.
Preview the report firsthand - request a free sample
Get SampleGet the brochure for pricing and purchase details.
Get PDFTable of Content
- Key Takeaways
- Market Size and CAGR
- Top Growth Driver
- Fastest Growing Segment
- Leading Region
- Key Companies
- Emerging Opportunities
- Executive Summary
- Global Market Outlook
- Demand-side Trends
- Supply-side Trends
- Technology Roadmap Analysis
- Analysis and Recommendations
- Analyst Perspective (What is happening? Why now? What should investors know?)
- Key Questions Answered
- How large is the market?
- What is the CAGR?
- What are key trends?
- Which region dominates?
- Who are the leaders?
- Market Overview
- Market Coverage / Taxonomy
- Market Definition / Scope / Limitations
- Research Methodology
- Chapter Orientation
- Analytical Lens and Working Hypotheses
- Market Structure, Signals, and Trend Drivers
- Benchmarking and Cross-market Comparability
- Market Sizing, Forecasting, and Opportunity Mapping
- Research Design and Evidence Framework
- Desk Research Programme (Secondary Evidence)
- Expert Input and Fieldwork (Primary Evidence)
- Tooling, Models, and Reference Databases
- Data Engineering and Model Build
- Quality Assurance and Audit Trail
- Market Background
- Market Dynamics (Drivers, Restraints, Opportunity, Trends)
- Scenario Forecast (Optimistic, Likely, Conservative)
- Impact Analysis
- AI Impact
- Sustainability Impact
- Regulatory Impact
- Technology Impact
- Consumer / Buyer Analysis
- Purchase Drivers
- Adoption Barriers
- Buyer Journey
- Opportunity Map Analysis
- Product Life Cycle Analysis
- Supply Chain Analysis
- Investment Feasibility Matrix
- Value Chain Analysis
- PESTLE and Porter's Analysis
- Regulatory Landscape
- Regional Parent Market Outlook
- Production and Consumption Statistics
- Import and Export Statistics
- Global Market Analysis and Forecast, 2021 to 2036
- Historical Market Size Value (USD Million) & Volume (Unit) Analysis, 2021 to 2025
- Current and Future Market Size Value (USD Million) & Volume (Unit) Projections, 2026 to 2036
- Y-o-Y Growth Trend Analysis
- Absolute $ Opportunity Analysis
- Global Market Pricing Analysis, 2021 to 2036
- Global Market Analysis and Forecast, By Equipment Type, 2021 to 2036
- Introduction / Key Findings
- Historical Market Size Value (USD Million) & Volume (Unit) Analysis By Equipment Type, 2021 to 2025
- Current and Future Market Size Value (USD Million) & Volume (Unit) Analysis and Forecast By Equipment Type, 2026 to 2036
- VLF Hipot Testers
- VLF Tan Delta Systems
- Integrated Cable Test Vans
- VLF Partial Discharge Systems
- VLF Hipot Testers
- Y-o-Y Growth Trend Analysis By Equipment Type, 2021 to 2025
- Absolute $ Opportunity Analysis By Equipment Type, 2026 to 2036
- Global Market Analysis and Forecast, By Voltage Rating, 2021 to 2036
- Introduction / Key Findings
- Historical Market Size Value (USD Million) & Volume (Unit) Analysis By Voltage Rating, 2021 to 2025
- Current and Future Market Size Value (USD Million) & Volume (Unit) Analysis and Forecast By Voltage Rating, 2026 to 2036
- 30-60 kV
- Below 30 kV
- Above 60 kV
- 30-60 kV
- Y-o-Y Growth Trend Analysis By Voltage Rating, 2021 to 2025
- Absolute $ Opportunity Analysis By Voltage Rating, 2026 to 2036
- Global Market Analysis and Forecast, By Application, 2021 to 2036
- Introduction / Key Findings
- Historical Market Size Value (USD Million) & Volume (Unit) Analysis By Application, 2021 to 2025
- Current and Future Market Size Value (USD Million) & Volume (Unit) Analysis and Forecast By Application, 2026 to 2036
- Medium Voltage Cable Testing
- High Voltage Cable Testing
- Maintenance Diagnostics
- Commissioning
- Medium Voltage Cable Testing
- Y-o-Y Growth Trend Analysis By Application, 2021 to 2025
- Absolute $ Opportunity Analysis By Application, 2026 to 2036
- Global Market Analysis and Forecast, By End Use, 2021 to 2036
- Introduction / Key Findings
- Historical Market Size Value (USD Million) & Volume (Unit) Analysis By End Use, 2021 to 2025
- Current and Future Market Size Value (USD Million) & Volume (Unit) Analysis and Forecast By End Use, 2026 to 2036
- Utilities
- Cable Contractors
- Industrial Plants
- Renewable Energy Projects
- Utilities
- Y-o-Y Growth Trend Analysis By End Use, 2021 to 2025
- Absolute $ Opportunity Analysis By End Use, 2026 to 2036
- Global Market Analysis and Forecast, By Sales Channel, 2021 to 2036
- Introduction / Key Findings
- Historical Market Size Value (USD Million) & Volume (Unit) Analysis By Sales Channel, 2021 to 2025
- Current and Future Market Size Value (USD Million) & Volume (Unit) Analysis and Forecast By Sales Channel, 2026 to 2036
- Direct OEM
- Electrical Test Distributors
- Rental / Service
- Direct OEM
- Y-o-Y Growth Trend Analysis By Sales Channel, 2021 to 2025
- Absolute $ Opportunity Analysis By Sales Channel, 2026 to 2036
- Global Market Analysis and Forecast, By Region, 2021 to 2036
- Introduction
- Historical Market Size Value (USD Million) & Volume (Unit) Analysis By Region, 2021 to 2025
- Current Market Size Value (USD Million) & Volume (Unit) Analysis and Forecast By Region, 2026 to 2036
- North America
- Latin America
- Western Europe
- Eastern Europe
- East Asia
- South Asia and Pacific
- Middle East & Africa
- Market Attractiveness Analysis By Region
- North America Market Analysis and Forecast, By Country, 2021 to 2036
- Historical Market Size Value (USD Million) & Volume (Unit) Trend Analysis By Market Taxonomy, 2021 to 2025
- Market Size Value (USD Million) & Volume (Unit) Forecast By Market Taxonomy, 2026 to 2036
- By Country
- USA
- Canada
- Mexico
- By Equipment Type
- By Voltage Rating
- By Application
- By End Use
- By Sales Channel
- By Country
- Market Attractiveness Analysis
- By Country
- By Equipment Type
- By Voltage Rating
- By Application
- By End Use
- By Sales Channel
- Key Takeaways
- Latin America Market Analysis and Forecast, By Country
- Historical Market Size Value (USD Million) & Volume (Unit) Trend Analysis By Market Taxonomy, 2021 to 2025
- Market Size Value (USD Million) & Volume (Unit) Forecast By Market Taxonomy, 2026 to 2036
- By Country
- Brazil
- Chile
- Rest of Latin America
- By Equipment Type
- By Voltage Rating
- By Application
- By End Use
- By Sales Channel
- By Country
- Market Attractiveness Analysis
- By Country
- By Equipment Type
- By Voltage Rating
- By Application
- By End Use
- By Sales Channel
- Key Takeaways
- Western Europe Market Analysis and Forecast, By Country
- Historical Market Size Value (USD Million) & Volume (Unit) Trend Analysis By Market Taxonomy, 2021 to 2025
- Market Size Value (USD Million) & Volume (Unit) Forecast By Market Taxonomy, 2026 to 2036
- By Country
- Germany
- UK
- Italy
- Spain
- France
- Nordic
- BENELUX
- Rest of Western Europe
- By Equipment Type
- By Voltage Rating
- By Application
- By End Use
- By Sales Channel
- By Country
- Market Attractiveness Analysis
- By Country
- By Equipment Type
- By Voltage Rating
- By Application
- By End Use
- By Sales Channel
- Key Takeaways
- Eastern Europe Market Analysis and Forecast, By Country
- Historical Market Size Value (USD Million) & Volume (Unit) Trend Analysis By Market Taxonomy, 2021 to 2025
- Market Size Value (USD Million) & Volume (Unit) Forecast By Market Taxonomy, 2026 to 2036
- By Country
- Russia
- Poland
- Hungary
- Balkan & Baltic
- Rest of Eastern Europe
- By Equipment Type
- By Voltage Rating
- By Application
- By End Use
- By Sales Channel
- By Country
- Market Attractiveness Analysis
- By Country
- By Equipment Type
- By Voltage Rating
- By Application
- By End Use
- By Sales Channel
- Key Takeaways
- East Asia Market Analysis and Forecast, By Country
- Historical Market Size Value (USD Million) & Volume (Unit) Trend Analysis By Market Taxonomy, 2021 to 2025
- Market Size Value (USD Million) & Volume (Unit) Forecast By Market Taxonomy, 2026 to 2036
- By Country
- China
- Japan
- South Korea
- By Equipment Type
- By Voltage Rating
- By Application
- By End Use
- By Sales Channel
- By Country
- Market Attractiveness Analysis
- By Country
- By Equipment Type
- By Voltage Rating
- By Application
- By End Use
- By Sales Channel
- Key Takeaways
- South Asia and Pacific Market Analysis and Forecast, By Country
- Historical Market Size Value (USD Million) & Volume (Unit) Trend Analysis By Market Taxonomy, 2021 to 2025
- Market Size Value (USD Million) & Volume (Unit) Forecast By Market Taxonomy, 2026 to 2036
- By Country
- India
- ASEAN
- Australia & New Zealand
- Rest of South Asia and Pacific
- By Equipment Type
- By Voltage Rating
- By Application
- By End Use
- By Sales Channel
- By Country
- Market Attractiveness Analysis
- By Country
- By Equipment Type
- By Voltage Rating
- By Application
- By End Use
- By Sales Channel
- Key Takeaways
- Middle East & Africa Market Analysis and Forecast, By Country
- Historical Market Size Value (USD Million) & Volume (Unit) Trend Analysis By Market Taxonomy, 2021 to 2025
- Market Size Value (USD Million) & Volume (Unit) Forecast By Market Taxonomy, 2026 to 2036
- By Country
- Kingdom of Saudi Arabia
- Other GCC Countries
- Türkiye
- South Africa
- Other African Union
- Rest of Middle East & Africa
- By Equipment Type
- By Voltage Rating
- By Application
- By End Use
- By Sales Channel
- By Country
- Market Attractiveness Analysis
- By Country
- By Equipment Type
- By Voltage Rating
- By Application
- By End Use
- By Sales Channel
- Key Takeaways
- Key Countries Market Analysis
- USA
- Pricing Analysis
- Market Share Analysis, 2025
- By Equipment Type
- By Voltage Rating
- By Application
- By End Use
- By Sales Channel
- Canada
- Pricing Analysis
- Market Share Analysis, 2025
- By Equipment Type
- By Voltage Rating
- By Application
- By End Use
- By Sales Channel
- Mexico
- Pricing Analysis
- Market Share Analysis, 2025
- By Equipment Type
- By Voltage Rating
- By Application
- By End Use
- By Sales Channel
- Brazil
- Pricing Analysis
- Market Share Analysis, 2025
- By Equipment Type
- By Voltage Rating
- By Application
- By End Use
- By Sales Channel
- Chile
- Pricing Analysis
- Market Share Analysis, 2025
- By Equipment Type
- By Voltage Rating
- By Application
- By End Use
- By Sales Channel
- Germany
- Pricing Analysis
- Market Share Analysis, 2025
- By Equipment Type
- By Voltage Rating
- By Application
- By End Use
- By Sales Channel
- UK
- Pricing Analysis
- Market Share Analysis, 2025
- By Equipment Type
- By Voltage Rating
- By Application
- By End Use
- By Sales Channel
- Italy
- Pricing Analysis
- Market Share Analysis, 2025
- By Equipment Type
- By Voltage Rating
- By Application
- By End Use
- By Sales Channel
- Spain
- Pricing Analysis
- Market Share Analysis, 2025
- By Equipment Type
- By Voltage Rating
- By Application
- By End Use
- By Sales Channel
- France
- Pricing Analysis
- Market Share Analysis, 2025
- By Equipment Type
- By Voltage Rating
- By Application
- By End Use
- By Sales Channel
- India
- Pricing Analysis
- Market Share Analysis, 2025
- By Equipment Type
- By Voltage Rating
- By Application
- By End Use
- By Sales Channel
- ASEAN
- Pricing Analysis
- Market Share Analysis, 2025
- By Equipment Type
- By Voltage Rating
- By Application
- By End Use
- By Sales Channel
- Australia & New Zealand
- Pricing Analysis
- Market Share Analysis, 2025
- By Equipment Type
- By Voltage Rating
- By Application
- By End Use
- By Sales Channel
- China
- Pricing Analysis
- Market Share Analysis, 2025
- By Equipment Type
- By Voltage Rating
- By Application
- By End Use
- By Sales Channel
- Japan
- Pricing Analysis
- Market Share Analysis, 2025
- By Equipment Type
- By Voltage Rating
- By Application
- By End Use
- By Sales Channel
- South Korea
- Pricing Analysis
- Market Share Analysis, 2025
- By Equipment Type
- By Voltage Rating
- By Application
- By End Use
- By Sales Channel
- Russia
- Pricing Analysis
- Market Share Analysis, 2025
- By Equipment Type
- By Voltage Rating
- By Application
- By End Use
- By Sales Channel
- Poland
- Pricing Analysis
- Market Share Analysis, 2025
- By Equipment Type
- By Voltage Rating
- By Application
- By End Use
- By Sales Channel
- Hungary
- Pricing Analysis
- Market Share Analysis, 2025
- By Equipment Type
- By Voltage Rating
- By Application
- By End Use
- By Sales Channel
- Kingdom of Saudi Arabia
- Pricing Analysis
- Market Share Analysis, 2025
- By Equipment Type
- By Voltage Rating
- By Application
- By End Use
- By Sales Channel
- Türkiye
- Pricing Analysis
- Market Share Analysis, 2025
- By Equipment Type
- By Voltage Rating
- By Application
- By End Use
- By Sales Channel
- South Africa
- Pricing Analysis
- Market Share Analysis, 2025
- By Equipment Type
- By Voltage Rating
- By Application
- By End Use
- By Sales Channel
- USA
- Market Structure Analysis
- Competition Dashboard
- Competition Benchmarking
- Market Share Analysis of Top Players
- By Regional
- By Equipment Type
- By Voltage Rating
- By Application
- By End Use
- By Sales Channel
- Emerging Startups
- Innovation Benchmarking
- Competition Analysis
- Competition Deep Dive
- Megger
- Overview
- Product Portfolio
- Profitability by Market Segments (Product/Region/Sales Channel)
- Sales Footprint
- Strategy Overview
- Marketing Strategy
- Product Strategy
- Channel Strategy
- BAUR
- OMICRON
- Haefely
- HV Diagnostics
- High Voltage Inc
- Megger
- Case Studies
- Success Stories
- Recent Developments
- Competition Deep Dive
- Assumptions & Acronyms Used


