Voice Commerce Services Market Size and Share Forecast Outlook 2025 to 2035

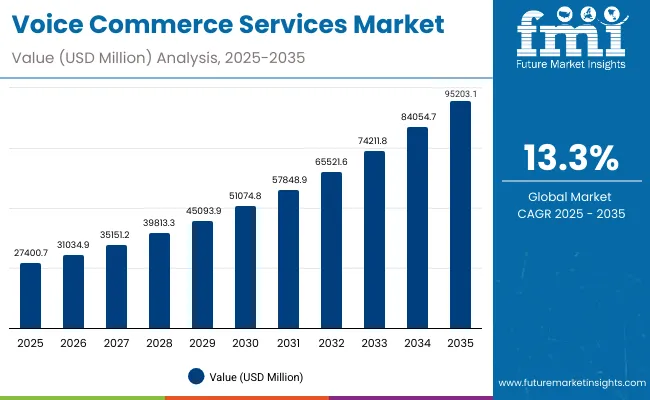
The Voice Commerce Services Market is expected to record a valuation of USD 27,400.7 million in 2025 and USD 95,203.1 million in 2035, with an increase of USD 67,802.4 million, which equals a growth of 193% over the decade. The overall expansion represents a CAGR of 13.3% and a 2X increase in market size.

Quick Stats for Voice Commerce Services Market

  • Voice Commerce Services Market Value (2025): USD 27,400.7 million
  • Voice Commerce Services Market Forecast Value (2035): USD 95,203.1 million
  • Voice Commerce Services Market Forecast CAGR: 13.3%
  • Leading Segment in Voice Commerce Services Market in 2025: Retail & e-commerce (57.5%)
  • Key Growth Regions in the Voice Commerce Services Market: China, India, USA, UK, Germany, Japan
  • Top Key Players in Voice Commerce Services Market: Amazon (Alexa), Google (Assistant), Apple (Siri), Samsung (Bixby), Alibaba (AliGenie), Baidu (DuerOS), SoundHound, Microsoft Cortana, TencentXiaowei, Xiaomi XiaoAI

Voice Commerce Services Market

Voice Commerce Services Market Key Takeaways

Metric Value
Market Estimated Value in (2025E) USD 27,400.7 million
Market Forecast Value in (2035F) USD 95,203.1 million
Forecast CAGR (2025 to 2035) 13.3%

During the first five-year period from 2025 to 2030, the market increases from USD 27,400.7 million to USD 51,074.8 million, adding USD 23,674.1 million, which accounts for 35% of the total decade growth. This phase records steady adoption in retail & e-commerce and banking/finance services, driven by the need for convenience and secure transactions. Voice-enabled ordering dominates this period as it caters to nearly 49.6% of applications requiring faster commerce execution.

The second half from 2030 to 2035 contributes USD 44,128.3 million, equal to 65% of total growth, as the market jumps from USD 51,074.8 million to USD 95,203.1 million. This acceleration is powered by widespread deployment of AI-based voice assistants, personalized shopping interfaces, and multi-lingual voice platforms in smart ecosystems. Smartphones and smart speakers together capture a larger share above 54.3% by the end of the decade. Cloud-led voice commerce and software-driven integrations add recurring revenue, increasing the service-based share beyond 50% in total value.

From 2020 to 2024, the Voice Commerce Services Market experienced rapid adoption, moving toward AI-powered assistants integrated into smartphones and smart speakers. During this period, the competitive landscape was dominated by technology giants (Amazon, Google, Apple, Alibaba, Baidu) controlling nearly 70% of global penetration, focusing on voice-enabled ordering, search, and authentication. Differentiation relied on ecosystem reach, language support, and AI personalization, while standalone third-party platforms had limited traction, contributing less than 15% of the overall market value.

Demand for voice commerce services will expand to USD 27,400.7 million in 2025 and further to USD 95,203.1 million by 2035, reflecting a 193% decade growth. The revenue mix will evolve as retail & e-commerce remains the dominant vertical but new sectors like banking/finance and travel bookings grow faster. Traditional leaders such as Amazon (Alexa) and Google Assistant face rising competition from regional AI-driven platforms (Baidu DuerOS, Alibaba AliGenie, Xiaomi XiaoAI, TencentXiaowei) offering multi-lingual capabilities, localized commerce, and cloud-based integrations.

By 2035, smartphones and smart speakers will together capture over 54% of device-led usage, but the competitive advantage will shift from hardware and voice activation alone to ecosystem strength, interoperability, and recurring subscription revenues. Emerging players focusing on AI-driven personalization, digital twin commerce models, and AR/VR-integrated shopping experiences are expected to gain share. The market is moving away from voice recognition accuracy alone toward scalability, contextual intelligence, and end-to-end commerce ecosystems.
Why the Voice Commerce Services Market is growing?

The growth of the Voice Commerce Services Market is strongly driven by seamless integration of voice assistants into retail and e-commerce platforms. Major players like Amazon, Alibaba, and Walmart are embedding voice-enabled ordering into their shopping ecosystems, enabling frictionless purchases and personalized promotions. This eliminates barriers such as app navigation and checkout delays, enhancing customer stickiness. Retail & e-commerce already captures 57.5% share, and the convenience-driven shift toward hands-free shopping ensures sustained adoption across smartphones, smart speakers, and in-car systems.

Beyond basic ordering, voice commerce is expanding through advanced AI-based authentication and personalization features. Companies are using biometrics-driven voice recognition to enable secure payments and financial transactions, especially in banking and fintech sectors. At the same time, personalized shopping experiences powered by natural language processing and contextual intelligence allow platforms to recommend products, services, and deals tailored to user behavior. This dual promise of security plus personalization is accelerating adoption, with countries like India and China showing high CAGR growth of 21.0% and 18.7% respectively.

Segmental Analysis

The Voice Commerce Services Market is segmented by service type, device, industry, and region. Service types include voice-enabled ordering, voice-based search & discovery, and voice payment & authentication, reflecting the core functionalities driving consumer adoption. Device segmentation spans smartphones, smart speakers, wearables, and in-car systems, enabling usage across personal, household, and mobility contexts. By industry, the market is categorized into retail & e-commerce, food delivery, travel booking, and banking/finance, each representing diverse applications of voice commerce solutions. Regionally, the scope covers major economies including the USA, China, India, UK, Germany, and Japan, with growth rates ranging from 8.1% in the USA to 21.0% in India, highlighting varied adoption curves across markets.
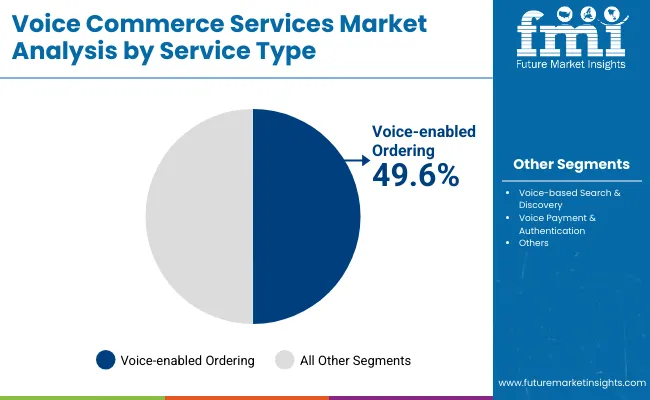
Insights into the Service Type Segment with Voice-Enabled Ordering Leading in Market Share

Voice Commerce Services Market By Service

Service Type Segment Market Value Share, 2025
Voice-enabled ordering 49.6%
Others 50.4%

The voice-enabled ordering segment is projected to contribute 49.6% of the Voice Commerce Services Market revenue in 2025, maintaining its lead as the dominant service type category. This is driven by ongoing demand for frictionless retail transactions, fast product reorders, and hands-free shopping experiences. Consumers are increasingly relying on smart devices to streamline purchases, especially in retail & e-commerce and food delivery verticals.

The segment’s growth is also supported by the integration of AI-based personalization and predictive commerce capabilities that simplify buying journeys. As digital ecosystems expand, players like Amazon Alexa, Google Assistant, and Alibaba AliGenie are strengthening voice ordering functions with loyalty programs and subscription tie-ins. The voice-enabled ordering segment is expected to retain its position as the backbone of voice commerce adoption through 2035.
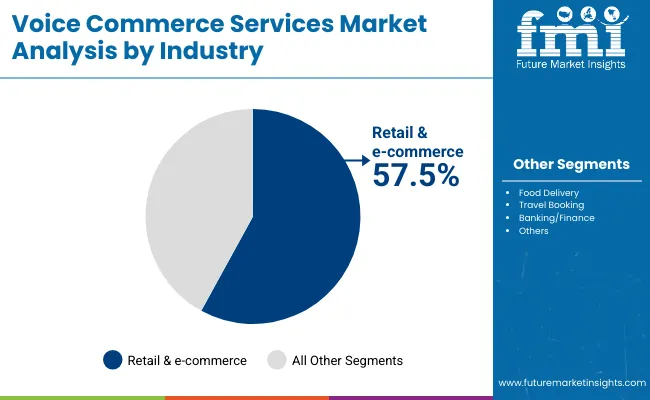
Insights into the Industry Segment with Retail & E-Commerce Dominating the Demand

Voice Commerce Services Market By Industry

Industry Value Share% 2025
Retail & e-commerce 57.5%
Others 42.5%

The retail & e-commerce segment is forecasted to hold 57.5% of the market share in 2025, led by its application in seamless voice-enabled shopping and ordering processes. This dominance is driven by consumer demand for frictionless checkout experiences, personalized promotions, and convenience-led digital commerce adoption.

The segment’s growth is further supported by integration of voice assistants with mobile apps, smart speakers, and in-car systems, which expand omnichannel engagement. Retailers are leveraging AI-powered voice platforms to enable hands-free reorders, subscription renewals, and product discovery, directly enhancing conversion rates.

As voice assistants become central to customer engagement and transaction execution, the retail & e-commerce segment is expected to continue driving overall adoption, anchoring its position as the leading revenue contributor within the Voice Commerce Services Market through 2035.
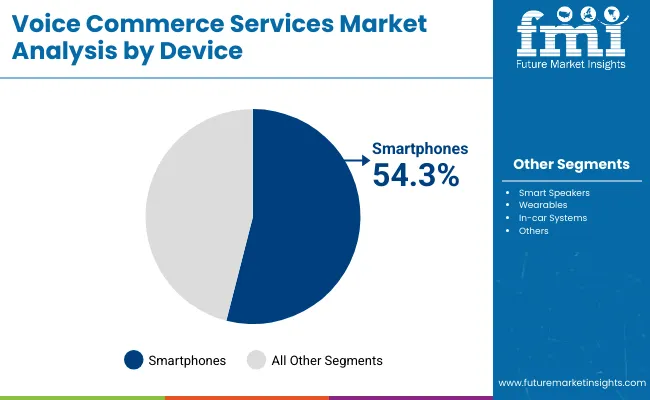
Insights into the Device Segment with Smartphones Leading in Market Share

Voice Commerce Services Market By Device

Device Value Share% 2025
Smartphones 54.3%
Others 45.7%

The smartphones segment is projected to account for 54.3% of the Voice Commerce Services Market revenue in 2025, establishing it as the leading device category. Smartphones dominate due to their ubiquity, user familiarity, and integration with AI-driven voice assistants such as Alexa, Google Assistant, Siri, and Bixby.

Their suitability for on-the-go purchases, banking transactions, and personalized shopping experiences makes them the most convenient medium for consumers. Continuous advancements in mobile processors, natural language processing (NLP), and app integration have further improved accuracy, responsiveness, and security in voice transactions.

Given their balance of accessibility, functionality, and ecosystem reach, smartphones are expected to maintain their leading role in the Voice Commerce Services Market through 2035, with strong adoption in high-growth regions such as China and India.

What are the Drivers, Restraints, and Key Trends of the Voice Commerce Services Market?

Seamless Integration into E-Commerce Ecosystems

Voice commerce adoption is accelerating as global e-commerce leaders like Amazon, Alibaba, and Walmart integrate voice assistants directly into shopping platforms. This integration allows consumers to reorder products, manage subscriptions, and discover personalized deals using natural speech. By eliminating complex navigation and checkout steps, voice-enabled ordering reduces friction, improving conversion rates and enhancing customer loyalty. Retail & e-commerce already represents 57.5% market share in 2025, and as smartphone and smart speaker penetration deepens, voice integration will become a cornerstone of omnichannel commerce strategies worldwide.

Rising Adoption in Banking and Finance

Beyond retail, voice commerce is witnessing growth in secure voice-based payment and authentication systems, particularly in banking and fintech. Biometric-enabled voice recognition provides a secure, frictionless alternative to PINs and passwords, addressing consumer concerns about fraud while simplifying transactions. Financial institutions in Asia-Pacific, especially India (21.0% CAGR) and China (18.7% CAGR), are at the forefront of this adoption. These systems also allow users to check balances, transfer funds, and initiate bill payments through conversational AI. The need for speed, convenience, and security is propelling this expansion across financial services.

Data Privacy and Security Concerns

Despite rapid adoption, privacy concerns remain a critical barrier for voice commerce. Voice-enabled devices continuously capture user data, raising fears of unauthorized access, surveillance, and data misuse. Incidents of accidental voice recordings and vulnerabilities in AI algorithms have heightened consumer skepticism, especially in Europe, where GDPR compliance is stringent. Banking and healthcare applications, in particular, face trust deficits as consumers worry about sensitive data being exposed. These challenges slow down adoption rates, requiring providers to invest heavily in end-to-end encryption, transparent policies, and secure authentication protocols to build confidence.

Multi-Lingual and Localized Voice Platforms

A defining trend in the Voice Commerce Services Market is the rise of multi-lingual and localized AI assistants, especially in high-growth regions like India, China, and Southeast Asia. Players like Baidu’s DuerOS and Alibaba’s AliGenie are embedding local dialects and cultural nuances to expand penetration in non-English-speaking markets. This trend aligns with the surge in smartphone-driven commerce, making voice shopping accessible to rural and semi-urban populations. By 2035, this localization will transform voice commerce into an inclusive global channel, moving beyond English-centric systems to contextual, culturally adaptive voice ecosystems.
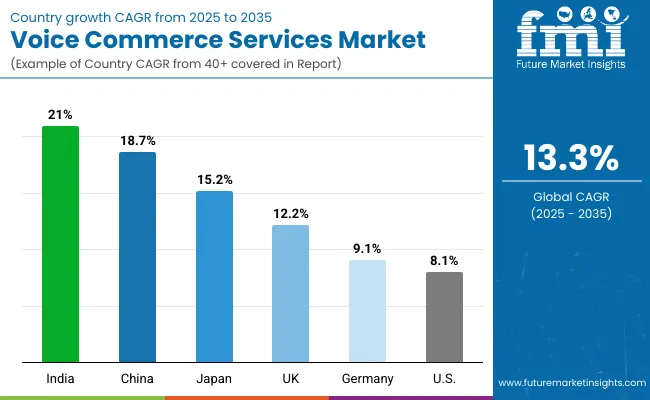
Analysis of Voice Commerce Services Market By Key Countries

Voice Commerce Services Market By Country

Countries Estimated CAGR (2025 to 2035)
China 18.7%
USA 8.1%
India 21.0%
UK 12.2%
Germany 9.1%
Japan 15.2%

The Voice Commerce Services Market is witnessing significant geographic variations in growth, with certain countries taking the lead due to unique digital ecosystems and consumer behavior patterns. India, with a CAGR of 21.0%, stands as the fastest-growing market globally, propelled by its massive smartphone penetration, digital-first consumer base, and the adoption of regional language-enabled AI assistants. The government’s digital initiatives, coupled with platforms like Reliance Jio and Flipkart integrating voice technologies, further accelerate adoption. China, projected to grow at 18.7% CAGR, is another powerhouse, driven by local tech giants such as Alibaba (AliGenie), Baidu (DuerOS), and Xiaomi (XiaoAI) who are embedding voice commerce into mainstream e-commerce, mobile payments, and entertainment services.

Japan, expanding at 15.2% CAGR, is leveraging advancements in consumer electronics and AI personalization, where domestic players are actively developing innovative voice solutions. The UK, with 12.2% CAGR, shows strong growth from smart speaker adoption and expansion into financial services and travel bookings, reflecting high consumer trust in AI-driven services. Germany, at 9.1%, is cautious but consistent, prioritizing secure, GDPR-compliant solutions, particularly in automotive applications like in-car commerce. Meanwhile, the USA market, growing at 8.1% CAGR, reflects maturity and saturation, with Amazon Alexa and Google Assistant dominating, while future growth depends on advanced applications in smart homes and vehicles.
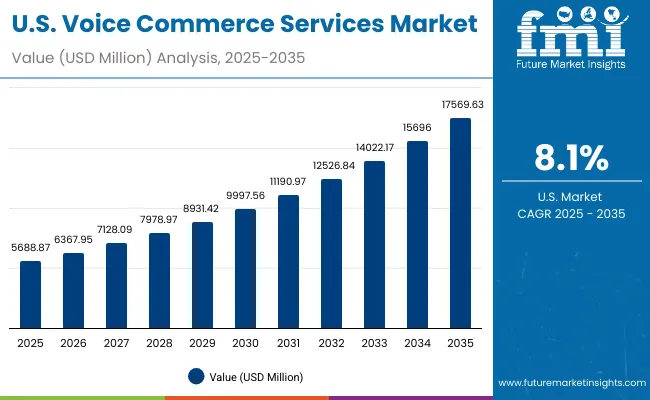
Sales Outlook for Voice Commerce Services in the United States

Voice Commerce Services Market Usa

Year USA Voice Commerce Services Market (USD Million)
2025 5688.87
2026 6367.95
2027 7128.09
2028 7978.97
2029 8931.42
2030 9997.56
2031 11190.97
2032 12526.84
2033 14022.17
2034 15696.00
2035 17569.63

The Voice Commerce Services Market in the United States is projected to grow at a CAGR of 8.1% from 2025 to 2035, reaching USD 17,569.6 million by the end of the period. Growth is led by strong adoption of Amazon Alexa and Google Assistant ecosystems, supported by smart home penetration, in-car integrations, and rising consumer comfort with voice-enabled shopping. The retail & e-commerce sector contributes 56.7% of the 2025 market share, highlighting the dominance of hands-free ordering and personalized shopping experiences. Financial services and travel bookings are expanding as voice payments and authentication gain traction. Privacy and data security concerns remain a limiting factor, but advancements in encryption and biometrics are improving user trust.

  • Retail & e-commerce is the leading use case, capturing 56.7% share in 2025.
  • In-car voice commerce adoption is accelerating with USA automakers integrating AI assistants.
  • Voice-enabled banking and payments are expanding as authentication technologies mature.

Growth and Expansion Outlook for Voice Commerce Services Market in the United Kingdom

The Voice Commerce Services Market in the United Kingdom is expected to grow at a CAGR of 12.2% from 2025 to 2035, driven by increasing adoption of voice assistants in retail, banking, and travel bookings. UK consumers are showing strong engagement with smart speakers and smartphone-based assistants, with retailers leveraging voice platforms to enable hands-free shopping, personalized promotions, and faster checkout. Financial institutions are also embracing voice authentication and payment technologies, expanding secure digital banking options. The UK government’s support for AI innovation, coupled with consumer openness toward smart ecosystems, positions the market for steady expansion.

  • Retail & e-commerce dominates adoption, with brands using voice assistants to strengthen omnichannel engagement.
  • Banking and financial services are scaling voice payments to enhance customer security and convenience.
  • Smart speakers are increasingly embedded in UK households, fueling voice-driven entertainment, shopping, and home automation.

Growth and Expansion Outlook for Voice Commerce Services Market in India

India is witnessing the fastest growth in the Voice Commerce Services Market, projected to expand at a CAGR of 21.0% through 2035. Rapid smartphone adoption, affordable internet access, and the integration of regional language-enabled voice assistants are driving penetration deep into tier-2 and tier-3 cities. E-commerce platforms and fintech companies are at the forefront, embedding voice technologies into apps to simplify shopping, payments, and financial transactions for first-time digital users. Educational institutions and training programs are increasingly incorporating voice AI modules and conversational commerce skills, preparing a workforce aligned with future digital retail needs. The government’s Digital India initiatives, combined with local innovation and private sector investments, continue to fuel nationwide expansion.

  • Voice commerce adoption in tier-2 and tier-3 cities is accelerating due to multi-lingual support and low-cost smartphones.
  • E-commerce and fintech leaders are leveraging voice assistants to simplify transactions and expand customer bases.
  • Educational programs are equipping youth with voice-AI skills, boosting ecosystem readiness for long-term growth.

Sales Outlook for Voice Commerce Services in China

The Voice Commerce Services Market in China is expected to grow at a CAGR of 18.7% from 2025 to 2035, the second-fastest among leading economies. Growth is fueled by strong ecosystem rollouts from Alibaba (AliGenie), Baidu (DuerOS), and Xiaomi (XiaoAI), who are embedding voice commerce into e-commerce, digital payments, and smart home ecosystems. The rapid expansion of AI-driven personalization, localized language support, and mobile-first platforms has made voice commerce accessible across both urban and rural markets. The government’s push for smart cities and digital innovation is further supporting adoption across multiple industries, from retail and finance to entertainment and education.
  • E-commerce giants Alibaba and JD.com are integrating voice assistants to drive frictionless shopping.
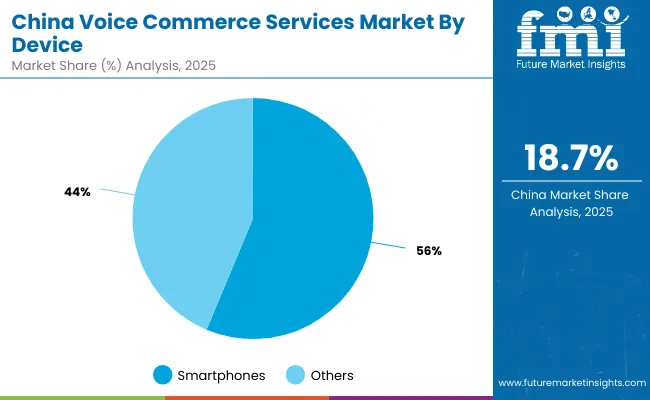
  • Smartphone-led commerce dominates adoption, with 56.3% share of device usage in 2025.
  • Affordable domestic AI platforms are enabling mass adoption in rural and regional markets through multi-lingual support.

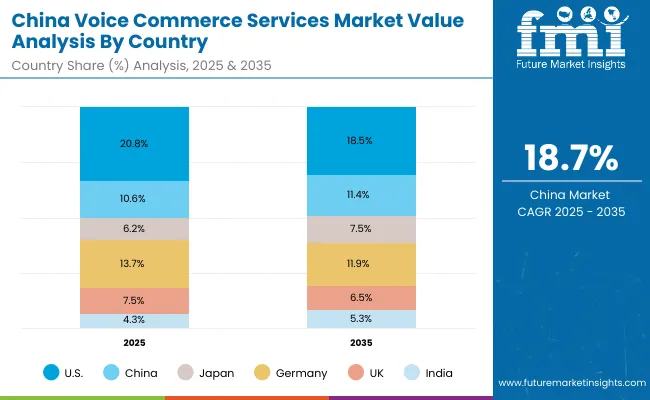
Sales Outlook for Voice Commerce Services in China

Voice Commerce Services Market China

Countries 2025 Share (%)
USA 20.8%
China 10.6%
Japan 6.2%
Germany 13.7%
UK 7.5%
India 4.3%
Countries 2035 Share (%)
USA 18.5%
China 11.4%
Japan 7.5%
Germany 11.9%
UK 6.5%
India 5.3%

The Voice Commerce Services Market in China is expected to grow at a CAGR of 18.7% from 2025 to 2035, the second-fastest among leading economies. Growth is fueled by strong ecosystem rollouts from Alibaba (AliGenie), Baidu (DuerOS), and Xiaomi (XiaoAI), who are embedding voice commerce into e-commerce, digital payments, and smart home ecosystems. The rapid expansion of AI-driven personalization, localized language support, and mobile-first platforms has made voice commerce accessible across both urban and rural markets. The government’s push for smart cities and digital innovation is further supporting adoption across multiple industries, from retail and finance to entertainment and education.
  • E-commerce giants Alibaba and JD.com are integrating voice assistants to drive frictionless shopping.
  • Smartphone-led commerce dominates adoption, with 56.3% share of device usage in 2025.
  • Affordable domestic AI platforms are enabling mass adoption in rural and regional markets through multi-lingual support.

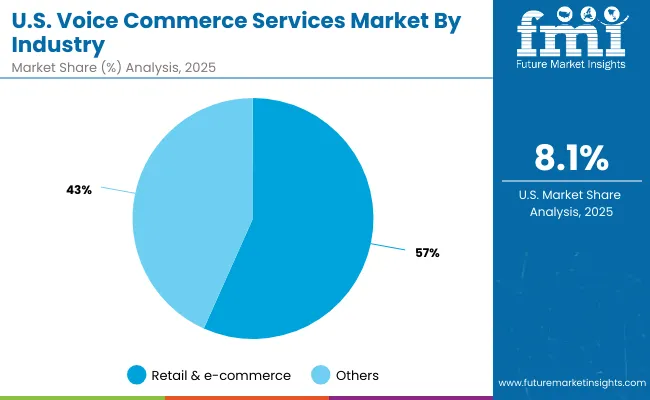
Growth Outlook for Voice Commerce Services Market in USA

Voice Commerce Services Market Usa 2

USA by Industry Value Share% 2025
Retail & e-commerce 56.7%
Others 43.3%

The Voice Commerce Services Market in the United States is projected at USD 5,688.9 million in 2025, with retail & e-commerce contributing 56.7% and other industries such as travel, finance, and food delivery accounting for 43.3%. This dominance reflects the maturity of the USA digital retail ecosystem, where Amazon Alexa and Google Assistant are firmly embedded into consumer shopping behaviors. Growth is supported by the expansion of voice-enabled payments, in-car commerce integrations, and smart home adoption, which extend the use of voice assistants beyond shopping into everyday transactions.

Advancements in AI-based personalization, contextual commerce, and biometrics-driven authentication are improving consumer trust and creating recurring service-based revenue opportunities. While privacy and data security remain key restraints, strong investments in encryption and regulatory compliance are addressing these concerns. The USA market is shifting toward a model where ecosystem integration, secure payments, and omnichannel adoption drive long-term growth.
  • Retail & e-commerce leads with 56.7% share in 2025, highlighting strong consumer adoption.
  • In-car voice commerce is gaining traction as automakers integrate assistants into infotainment systems.
  • Voice payments and authentication are expanding, positioning fintech as a key growth catalyst.

Opportunity Analysis of China Voice Commerce Services Market

Voice Commerce Services Market China 2

China by Device Value Share% 2025
Smartphones 56.3%
Others 43.7%

The Voice Commerce Services Market in China is projected at USD 6,018 million in 2025 from smartphones alone, with devices collectively capturing a significant share of adoption. Smartphones dominate with 56.3%, reflecting China’s mobile-first digital ecosystem, where super-apps and AI assistants are deeply integrated into daily commerce. Local platforms such as Alibaba’s AliGenie, Baidu’s DuerOS, and Xiaomi’s XiaoAI are shaping consumer behavior by embedding multi-lingual, payment-enabled, and personalized voice experiences into retail and financial ecosystems.

The opportunity lies in expanding voice commerce into lower-tier cities, where rising smartphone penetration and affordable data are opening new consumer bases. Cross-sector applications in food delivery, mobile banking, and entertainment streaming are accelerating, supported by favorable government policies for AI innovation and digital infrastructure. By leveraging AI-driven personalization, regional dialect support, and cloud integration, China is poised to remain a global leader in scaling voice commerce services.
  • Smartphones lead at 56.3% share in 2025, reinforcing China’s mobile-first adoption.
  • Alibaba, Baidu, and Xiaomi ecosystems dominate, driving localized voice commerce innovation.
  • Tier-2 and Tier-3 cities present untapped growth opportunities, supported by low-cost devices and regional language AI.

Competitive Landscape of Voice Commerce Services Market

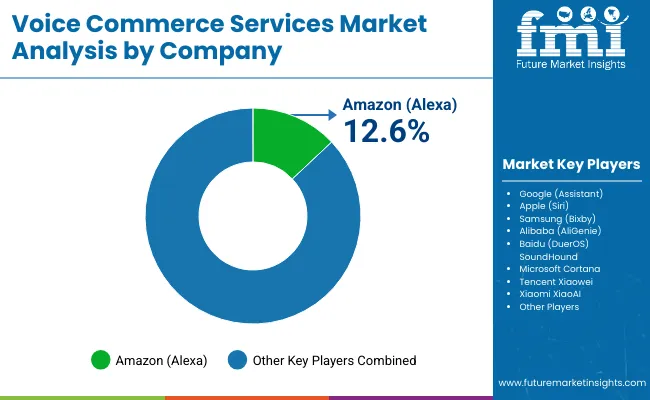
Voice Commerce Services Market By Company

The Voice Commerce Services Market is projected at USD 27,400.7 million in 2025, with smartphones capturing 54.3% share of device-led adoption. Smartphones dominate globally as the preferred medium for voice transactions, owing to their ubiquity and integration with major ecosystems such as Amazon Alexa, Google Assistant, Apple Siri, and Samsung Bixby. Smart speakers follow as the second-strongest device segment, driven by household adoption in developed markets.

Competition is shaped by a handful of tech giants controlling ecosystem access. Amazon and Google lead in North America and Europe, while Alibaba, Baidu, and Xiaomi dominate Asia-Pacific, embedding voice commerce into retail, payments, and entertainment. Apple maintains influence through Siri and iOS ecosystem lock-in, while TencentXiaowei and SoundHound are expanding niche applications. The market remains fragmented outside of these leaders, leaving opportunities for specialized providers offering AI-driven personalization, multilingual support, and cloud-based integrations.

The competitive advantage is shifting from device hardware to ecosystem strength, where integration with retail, banking, and travel platforms creates recurring revenue streams. Emerging markets, especially India and Southeast Asia, provide white space for regional players to scale localized platforms.

  • Smartphones dominate with 54.3% share in 2025, reinforcing global mobile-first adoption.
  • Amazon and Google ecosystems lead developed markets, while Alibaba, Baidu, and Xiaomi rule Asia.
  • Emerging markets provide white space for regional platforms, leveraging language support and low-cost devices.

Key Developments in Voice Commerce Services Market

  • In 2024, Amazon shifted its strategy for Alexaits voice commerce assistantby focusing on expanding practical integrations rather than deepening generative AI complexity. Instead of solely enhancing conversational AI, Amazon forged partnerships with Uber, OpenTable, Grubhub, and others. These alliances enable Alexa to complete tasks like ride bookings, dinner reservations, and food orders seamlessly via APIs, providing a smoother user experience. By Q3 of the following year, Amazon aims to have around 200 such partners, significantly broadening Alexa’s real-world utility beyond traditional voice skills.
  • At CES 2025, SoundHound AI unveiled the first in-vehicle voice commerce platform that allows drivers and passengers to order takeout using voice commands directly through the car’s infotainment systemhands-free. The system integrates ordering, payment, navigation, and nearby restaurant discovery. Backed by SoundHound’s recent acquisition of Allset, the platform is set to expand to banking, ticketing, and appointment services. SoundHound is collaborating with automakers and restaurant chains to roll out the technology later in the year, marking a major innovation milestone in voice commerce.

Scope of the Report

Item Value
Quantitative Units USD 27,400.7 Million
Service Type Voice-enabled ordering, Voice-based search & discovery, Voice payment & authentication
Device Smartphones, Smart speakers, Wearables, In-car systems
Retail & e-commerce Retail & e-commerce, Food delivery, Travel booking, Banking/finance
Regions Covered North America, Europe, Asia-Pacific, Latin America, Middle East & Africa
Country Covered United States, Canada, Germany, France, United Kingdom, China, Japan, India, Brazil, South Africa
Key Companies Profiled Amazon (Alexa), Google (Assistant), Apple (Siri), Samsung (Bixby), Alibaba (AliGenie), Baidu (DuerOS), SoundHound, Microsoft Cortana, Tencent Xiaowei, Xiaomi XiaoAI
Additional Attributes Dollar sales by service type (voice-enabled ordering, search & discovery, authentication) and device categories, adoption trends in retail & e-commerce and financial services, rising demand for smartphone-led voice commerce, sector-specific growth in food delivery, travel booking, and banking, revenue segmentation between hardware devices, software ecosystems, and AI-driven services, integration with multi-lingual support, cloud platforms, and digital payment systems, regional adoption influenced by smartphone penetration and government-led digitization, and innovations in AI-based personalization, biometric voice authentication, and contextual commerce experiences.

Key Segments

By Service Type:

  • Voice-enabled ordering
  • Voice-based search & discovery
  • Voice payment & authentication

By Device:

  • Smartphones
  • Smart speakers
  • Wearables
  • In-car systems

By Industry:

  • Retail & e-commerce
  • Food delivery
  • Travel booking
  • Banking/finance

By Region:

  • North America
  • Latin America
  • Europe
  • East Asia
  • South Asia & Pacific
  • Middle East and Africa

Table of Content

  1. Executive Summary
    • Global Market Outlook
    • Demand-side Trends
    • Supply-side Trends
    • Technology Roadmap Analysis
    • Analysis and Recommendations
  2. Market Overview
    • Market Coverage / Taxonomy
    • Market Definition / Scope / Limitations
  3. Market Background
    • Market Dynamics
      • Drivers
      • Restraints
      • Opportunity
      • Trends
    • Scenario Forecast
      • Demand in Optimistic Scenario
      • Demand in Likely Scenario
      • Demand in Conservative Scenario
    • Opportunity Map Analysis
    • Product Life Cycle Analysis
    • Supply Chain Analysis
      • Supply Side Participants and their Roles
        • Producers
        • Mid-Level Participants (Traders/ Agents/ Brokers)
        • Wholesalers and Distributors
      • Value Added and Value Created at Node in the Supply Chain
      • List of Raw Material Suppliers
      • List of Existing and Potential Buyer’s
    • Investment Feasibility Matrix
    • Value Chain Analysis
      • Profit Margin Analysis
      • Wholesalers and Distributors
      • Retailers
    • PESTLE and Porter’s Analysis
    • Regulatory Landscape
      • By Key Regions
      • By Key Countries
    • Regional Parent Market Outlook
    • Production and Consumption Statistics
    • Import and Export Statistics
  4. Global Market Analysis 2020 to 2024 and Forecast, 2025 to 2035
    • Historical Market Size Value (USD Million) & Volume (Units) Analysis, 2020 to 2024
    • Current and Future Market Size Value (USD Million) & Volume (Units) Projections, 2025 to 2035
      • Y-o-Y Growth Trend Analysis
      • Absolute $ Opportunity Analysis
  5. Global Market Analysis 2020 to 2024 and Forecast 2025 to 2035, By Service Type
    • Introduction / Key Findings
    • Historical Market Size Value (USD Million) & Volume (Units) Analysis By Service Type, 2020 to 2024
    • Current and Future Market Size Value (USD Million) & Volume (Units) Analysis and Forecast By Service Type, 2025 to 2035
      • Voice-enabled ordering
      • Voice-based search & discovery
      • Voice payment & authentication
    • Y-o-Y Growth Trend Analysis By Service Type, 2020 to 2024
    • Absolute $ Opportunity Analysis By Service Type, 2025 to 2035
  6. Global Market Analysis 2020 to 2024 and Forecast 2025 to 2035, By Device
    • Introduction / Key Findings
    • Historical Market Size Value (USD Million) & Volume (Units) Analysis By Device, 2020 to 2024
    • Current and Future Market Size Value (USD Million) & Volume (Units) Analysis and Forecast By Device, 2025 to 2035
      • Smartphones
      • Smart speakers
      • Wearables
      • In-car systems
    • Y-o-Y Growth Trend Analysis By Device, 2020 to 2024
    • Absolute $ Opportunity Analysis By Device, 2025 to 2035
  7. Global Market Analysis 2020 to 2024 and Forecast 2025 to 2035, By Industry
    • Introduction / Key Findings
    • Historical Market Size Value (USD Million) & Volume (Units) Analysis By Industry, 2020 to 2024
    • Current and Future Market Size Value (USD Million) & Volume (Units) Analysis and Forecast By Industry, 2025 to 2035
      • Retail & e-commerce
      • Food delivery
      • Travel booking
      • Banking/finance
    • Y-o-Y Growth Trend Analysis By Industry, 2020 to 2024
    • Absolute $ Opportunity Analysis By Industry, 2025 to 2035
  8. Global Market Analysis 2020 to 2024 and Forecast 2025 to 2035, By Region
    • Introduction
    • Historical Market Size Value (USD Million) & Volume (Units) Analysis By Region, 2020 to 2024
    • Current Market Size Value (USD Million) & Volume (Units) Analysis and Forecast By Region, 2025 to 2035
      • North America
      • Latin America
      • Europe
      • East Asia
      • South Asia & Pacific
      • Middle East and Africa
    • Market Attractiveness Analysis By Region
  9. North America Market Analysis 2020 to 2024 and Forecast 2025 to 2035, By Country
    • Historical Market Size Value (USD Million) & Volume (Units) Trend Analysis By Market Taxonomy, 2020 to 2024
    • Market Size Value (USD Million) & Volume (Units) Forecast By Market Taxonomy, 2025 to 2035
      • By Country
        • USA
        • Canada
      • By Service Type
      • By Device
      • By Industry
    • Market Attractiveness Analysis
      • By Country
      • By Service Type
      • By Device
      • By Industry
    • Key Takeaways
  10. Latin America Market Analysis 2020 to 2024 and Forecast 2025 to 2035, By Country
    • Historical Market Size Value (USD Million) & Volume (Units) Trend Analysis By Market Taxonomy, 2020 to 2024
    • Market Size Value (USD Million) & Volume (Units) Forecast By Market Taxonomy, 2025 to 2035
      • By Country
        • Brazil
        • Mexico
        • Colombia
        • Rest of Latin America
      • By Service Type
      • By Device
      • By Industry
    • Market Attractiveness Analysis
      • By Country
      • By Service Type
      • By Device
      • By Industry
    • Key Takeaways
  11. Europe Market Analysis 2020 to 2024 and Forecast 2025 to 2035, By Country
    • Historical Market Size Value (USD Million) & Volume (Units) Trend Analysis By Market Taxonomy, 2020 to 2024
    • Market Size Value (USD Million) & Volume (Units) Forecast By Market Taxonomy, 2025 to 2035
      • By Country
        • Germany
        • UK
        • France
        • Italy
        • Spain
        • Belgium
        • Netherlands
        • Nordic
        • Switzerland
        • Russia
        • Poland
        • Rest of Europe
      • By Service Type
      • By Device
      • By Industry
    • Market Attractiveness Analysis
      • By Country
      • By Service Type
      • By Device
      • By Industry
    • Key Takeaways
  12. East Asia Market Analysis 2020 to 2024 and Forecast 2025 to 2035, By Country
    • Historical Market Size Value (USD Million) & Volume (Units) Trend Analysis By Market Taxonomy, 2020 to 2024
    • Market Size Value (USD Million) & Volume (Units) Forecast By Market Taxonomy, 2025 to 2035
      • By Country
        • China
        • Japan
        • South Korea
      • By Service Type
      • By Device
      • By Industry
    • Market Attractiveness Analysis
      • By Country
      • By Service Type
      • By Device
      • By Industry
    • Key Takeaways
  13. South Asia & Pacific Market Analysis 2020 to 2024 and Forecast 2025 to 2035, By Country
    • Historical Market Size Value (USD Million) & Volume (Units) Trend Analysis By Market Taxonomy, 2020 to 2024
    • Market Size Value (USD Million) & Volume (Units) Forecast By Market Taxonomy, 2025 to 2035
      • By Country
        • India
        • Thailand
        • Malaysia
        • Indonesia
        • Singapore
        • Vietnam
        • Australia
        • New Zealand
        • Rest of South Asia
      • By Service Type
      • By Device
      • By Industry
    • Market Attractiveness Analysis
      • By Country
      • By Service Type
      • By Device
      • By Industry
    • Key Takeaways
  14. Middle East and Africa Market Analysis 2020 to 2024 and Forecast 2025 to 2035, By Country
    • Historical Market Size Value (USD Million) & Volume (Units) Trend Analysis By Market Taxonomy, 2020 to 2024
    • Market Size Value (USD Million) & Volume (Units) Forecast By Market Taxonomy, 2025 to 2035
      • By Country
        • Turkey
        • UAE
        • Saudi Arabia
        • Israel
        • Other GCC Countries
        • North Africa
        • South Africa
      • By Service Type
      • By Device
      • By Industry
    • Market Attractiveness Analysis
      • By Country
      • By Service Type
      • By Device
      • By Industry
    • Key Takeaways
  15. Key Countries Market Analysis
    • USA
      • Pricing Analysis
      • Market Share Analysis, 2024
        • By Service Type
        • By Device
        • By Industry
    • Canada
      • Pricing Analysis
      • Market Share Analysis, 2024
        • By Service Type
        • By Device
        • By Industry
    • Brazil
      • Pricing Analysis
      • Market Share Analysis, 2024
        • By Service Type
        • By Device
        • By Industry
    • Mexico
      • Pricing Analysis
      • Market Share Analysis, 2024
        • By Service Type
        • By Device
        • By Industry
    • Colombia
      • Pricing Analysis
      • Market Share Analysis, 2024
        • By Service Type
        • By Device
        • By Industry
    • Germany
      • Pricing Analysis
      • Market Share Analysis, 2024
        • By Service Type
        • By Device
        • By Industry
    • UK
      • Pricing Analysis
      • Market Share Analysis, 2024
        • By Service Type
        • By Device
        • By Industry
    • France
      • Pricing Analysis
      • Market Share Analysis, 2024
        • By Service Type
        • By Device
        • By Industry
    • Italy
      • Pricing Analysis
      • Market Share Analysis, 2024
        • By Service Type
        • By Device
        • By Industry
    • Spain
      • Pricing Analysis
      • Market Share Analysis, 2024
        • By Service Type
        • By Device
        • By Industry
    • Belgium
      • Pricing Analysis
      • Market Share Analysis, 2024
        • By Service Type
        • By Device
        • By Industry
    • Netherlands
      • Pricing Analysis
      • Market Share Analysis, 2024
        • By Service Type
        • By Device
        • By Industry
    • Nordic
      • Pricing Analysis
      • Market Share Analysis, 2024
        • By Service Type
        • By Device
        • By Industry
    • Switzerland
      • Pricing Analysis
      • Market Share Analysis, 2024
        • By Service Type
        • By Device
        • By Industry
    • Russia
      • Pricing Analysis
      • Market Share Analysis, 2024
        • By Service Type
        • By Device
        • By Industry
    • Poland
      • Pricing Analysis
      • Market Share Analysis, 2024
        • By Service Type
        • By Device
        • By Industry
    • China
      • Pricing Analysis
      • Market Share Analysis, 2024
        • By Service Type
        • By Device
        • By Industry
    • Japan
      • Pricing Analysis
      • Market Share Analysis, 2024
        • By Service Type
        • By Device
        • By Industry
    • South Korea
      • Pricing Analysis
      • Market Share Analysis, 2024
        • By Service Type
        • By Device
        • By Industry
    • India
      • Pricing Analysis
      • Market Share Analysis, 2024
        • By Service Type
        • By Device
        • By Industry
    • Thailand
      • Pricing Analysis
      • Market Share Analysis, 2024
        • By Service Type
        • By Device
        • By Industry
    • Indonesia
      • Pricing Analysis
      • Market Share Analysis, 2024
        • By Service Type
        • By Device
        • By Industry
    • Australia
      • Pricing Analysis
      • Market Share Analysis, 2024
        • By Service Type
        • By Device
        • By Industry
    • New Zealand
      • Pricing Analysis
      • Market Share Analysis, 2024
        • By Service Type
        • By Device
        • By Industry
    • Turkey
      • Pricing Analysis
      • Market Share Analysis, 2024
        • By Service Type
        • By Device
        • By Industry
    • UAE
      • Pricing Analysis
      • Market Share Analysis, 2024
        • By Service Type
        • By Device
        • By Industry
    • Saudi Arabia
      • Pricing Analysis
      • Market Share Analysis, 2024
        • By Service Type
        • By Device
        • By Industry
    • Israel
      • Pricing Analysis
      • Market Share Analysis, 2024
        • By Service Type
        • By Device
        • By Industry
    • North Africa
      • Pricing Analysis
      • Market Share Analysis, 2024
        • By Service Type
        • By Device
        • By Industry
    • South Africa
      • Pricing Analysis
      • Market Share Analysis, 2024
        • By Service Type
        • By Device
        • By Industry
  16. Market Structure Analysis
    • Competition Dashboard
    • Competition Benchmarking
    • Market Share Analysis of Top Players
      • By Regional
      • By Service Type
      • By Device
      • By Industry
  17. Competition Analysis
    • Competition Deep Dive
      • Amazon (Alexa)
        • Overview
        • Product Portfolio
        • Profitability by Market Segments (Product/Age /Sales Channel/Region)
        • Sales Footprint
        • Strategy Overview
          • Marketing Strategy
          • Product Strategy
          • Channel Strategy
      • Google (Assistant)
        • Overview
        • Product Portfolio
        • Profitability by Market Segments (Product/Age /Sales Channel/Region)
        • Sales Footprint
        • Strategy Overview
          • Marketing Strategy
          • Product Strategy
          • Channel Strategy
      • Apple (Siri)
        • Overview
        • Product Portfolio
        • Profitability by Market Segments (Product/Age /Sales Channel/Region)
        • Sales Footprint
        • Strategy Overview
          • Marketing Strategy
          • Product Strategy
          • Channel Strategy
      • Samsung (Bixby)
        • Overview
        • Product Portfolio
        • Profitability by Market Segments (Product/Age /Sales Channel/Region)
        • Sales Footprint
        • Strategy Overview
          • Marketing Strategy
          • Product Strategy
          • Channel Strategy
      • Alibaba (AliGenie)
        • Overview
        • Product Portfolio
        • Profitability by Market Segments (Product/Age /Sales Channel/Region)
        • Sales Footprint
        • Strategy Overview
          • Marketing Strategy
          • Product Strategy
          • Channel Strategy
      • Baidu (DuerOS)
        • Overview
        • Product Portfolio
        • Profitability by Market Segments (Product/Age /Sales Channel/Region)
        • Sales Footprint
        • Strategy Overview
          • Marketing Strategy
          • Product Strategy
          • Channel Strategy
      • SoundHound
        • Overview
        • Product Portfolio
        • Profitability by Market Segments (Product/Age /Sales Channel/Region)
        • Sales Footprint
        • Strategy Overview
          • Marketing Strategy
          • Product Strategy
          • Channel Strategy
      • Microsoft Cortana
        • Overview
        • Product Portfolio
        • Profitability by Market Segments (Product/Age /Sales Channel/Region)
        • Sales Footprint
        • Strategy Overview
          • Marketing Strategy
          • Product Strategy
          • Channel Strategy
      • Tencent Xiaowei
        • Overview
        • Product Portfolio
        • Profitability by Market Segments (Product/Age /Sales Channel/Region)
        • Sales Footprint
        • Strategy Overview
          • Marketing Strategy
          • Product Strategy
          • Channel Strategy
      • Xiaomi XiaoAI
        • Overview
        • Product Portfolio
        • Profitability by Market Segments (Product/Age /Sales Channel/Region)
        • Sales Footprint
        • Strategy Overview
          • Marketing Strategy
          • Product Strategy
          • Channel Strategy
      • Others
        • Overview
        • Product Portfolio
        • Profitability by Market Segments (Product/Age /Sales Channel/Region)
        • Sales Footprint
        • Strategy Overview
          • Marketing Strategy
          • Product Strategy
          • Channel Strategy
  18. Assumptions & Acronyms Used
  19. Research Methodology

List of Tables

  • Table 1: Global Market Value (USD Million) Forecast by Region, 2020-2035
  • Table 2: Global Market Volume (Units) Forecast by Region, 2020-2035
  • Table 3: Global Market Value (USD Million) Forecast by Service Type, 2020-2035
  • Table 4: Global Market Volume (Units) Forecast by Service Type, 2020-2035
  • Table 5: Global Market Value (USD Million) Forecast by Device, 2020-2035
  • Table 6: Global Market Volume (Units) Forecast by Device, 2020-2035
  • Table 7: Global Market Value (USD Million) Forecast by Industry, 2020-2035
  • Table 8: Global Market Volume (Units) Forecast by Industry, 2020-2035
  • Table 9: North America Market Value (USD Million) Forecast by Country, 2020-2035
  • Table 10: North America Market Volume (Units) Forecast by Country, 2020-2035
  • Table 11: North America Market Value (USD Million) Forecast by Service Type, 2020-2035
  • Table 12: North America Market Volume (Units) Forecast by Service Type, 2020-2035
  • Table 13: North America Market Value (USD Million) Forecast by Device, 2020-2035
  • Table 14: North America Market Volume (Units) Forecast by Device, 2020-2035
  • Table 15: North America Market Value (USD Million) Forecast by Industry, 2020-2035
  • Table 16: North America Market Volume (Units) Forecast by Industry, 2020-2035
  • Table 17: Latin America Market Value (USD Million) Forecast by Country, 2020-2035
  • Table 18: Latin America Market Volume (Units) Forecast by Country, 2020-2035
  • Table 19: Latin America Market Value (USD Million) Forecast by Service Type, 2020-2035
  • Table 20: Latin America Market Volume (Units) Forecast by Service Type, 2020-2035
  • Table 21: Latin America Market Value (USD Million) Forecast by Device, 2020-2035
  • Table 22: Latin America Market Volume (Units) Forecast by Device, 2020-2035
  • Table 23: Latin America Market Value (USD Million) Forecast by Industry, 2020-2035
  • Table 24: Latin America Market Volume (Units) Forecast by Industry, 2020-2035
  • Table 25: Europe Market Value (USD Million) Forecast by Country, 2020-2035
  • Table 26: Europe Market Volume (Units) Forecast by Country, 2020-2035
  • Table 27: Europe Market Value (USD Million) Forecast by Service Type, 2020-2035
  • Table 28: Europe Market Volume (Units) Forecast by Service Type, 2020-2035
  • Table 29: Europe Market Value (USD Million) Forecast by Device, 2020-2035
  • Table 30: Europe Market Volume (Units) Forecast by Device, 2020-2035
  • Table 31: Europe Market Value (USD Million) Forecast by Industry, 2020-2035
  • Table 32: Europe Market Volume (Units) Forecast by Industry, 2020-2035
  • Table 33: East Asia Market Value (USD Million) Forecast by Country, 2020-2035
  • Table 34: East Asia Market Volume (Units) Forecast by Country, 2020-2035
  • Table 35: East Asia Market Value (USD Million) Forecast by Service Type, 2020-2035
  • Table 36: East Asia Market Volume (Units) Forecast by Service Type, 2020-2035
  • Table 37: East Asia Market Value (USD Million) Forecast by Device, 2020-2035
  • Table 38: East Asia Market Volume (Units) Forecast by Device, 2020-2035
  • Table 39: East Asia Market Value (USD Million) Forecast by Industry, 2020-2035
  • Table 40: East Asia Market Volume (Units) Forecast by Industry, 2020-2035
  • Table 41: South Asia & Pacific Market Value (USD Million) Forecast by Country, 2020-2035
  • Table 42: South Asia & Pacific Market Volume (Units) Forecast by Country, 2020-2035
  • Table 43: South Asia & Pacific Market Value (USD Million) Forecast by Service Type, 2020-2035
  • Table 44: South Asia & Pacific Market Volume (Units) Forecast by Service Type, 2020-2035
  • Table 45: South Asia & Pacific Market Value (USD Million) Forecast by Device, 2020-2035
  • Table 46: South Asia & Pacific Market Volume (Units) Forecast by Device, 2020-2035
  • Table 47: South Asia & Pacific Market Value (USD Million) Forecast by Industry, 2020-2035
  • Table 48: South Asia & Pacific Market Volume (Units) Forecast by Industry, 2020-2035
  • Table 49: Middle East and Africa Market Value (USD Million) Forecast by Country, 2020-2035
  • Table 50: Middle East and Africa Market Volume (Units) Forecast by Country, 2020-2035
  • Table 51: Middle East and Africa Market Value (USD Million) Forecast by Service Type, 2020-2035
  • Table 52: Middle East and Africa Market Volume (Units) Forecast by Service Type, 2020-2035
  • Table 53: Middle East and Africa Market Value (USD Million) Forecast by Device, 2020-2035
  • Table 54: Middle East and Africa Market Volume (Units) Forecast by Device, 2020-2035
  • Table 55: Middle East and Africa Market Value (USD Million) Forecast by Industry, 2020-2035
  • Table 56: Middle East and Africa Market Volume (Units) Forecast by Industry, 2020-2035

List of Figures

  • Figure 1: Global Market Value (USD Million) by Service Type, 2025-2035
  • Figure 2: Global Market Value (USD Million) by Device, 2025-2035
  • Figure 3: Global Market Value (USD Million) by Industry, 2025-2035
  • Figure 4: Global Market Value (USD Million) by Region, 2025-2035
  • Figure 5: Global Market Value (USD Million) Analysis by Region, 2020-2035
  • Figure 6: Global Market Volume (Units) Analysis by Region, 2020-2035
  • Figure 7: Global Market Value Share (%) and BPS Analysis by Region, 2025-2035
  • Figure 8: Global Market Y-o-Y Growth (%) Projections by Region, 2025-2035
  • Figure 9: Global Market Value (USD Million) Analysis by Service Type, 2020-2035
  • Figure 10: Global Market Volume (Units) Analysis by Service Type, 2020-2035
  • Figure 11: Global Market Value Share (%) and BPS Analysis by Service Type, 2025-2035
  • Figure 12: Global Market Y-o-Y Growth (%) Projections by Service Type, 2025-2035
  • Figure 13: Global Market Value (USD Million) Analysis by Device, 2020-2035
  • Figure 14: Global Market Volume (Units) Analysis by Device, 2020-2035
  • Figure 15: Global Market Value Share (%) and BPS Analysis by Device, 2025-2035
  • Figure 16: Global Market Y-o-Y Growth (%) Projections by Device, 2025-2035
  • Figure 17: Global Market Value (USD Million) Analysis by Industry, 2020-2035
  • Figure 18: Global Market Volume (Units) Analysis by Industry, 2020-2035
  • Figure 19: Global Market Value Share (%) and BPS Analysis by Industry, 2025-2035
  • Figure 20: Global Market Y-o-Y Growth (%) Projections by Industry, 2025-2035
  • Figure 21: Global Market Attractiveness by Service Type, 2025-2035
  • Figure 22: Global Market Attractiveness by Device, 2025-2035
  • Figure 23: Global Market Attractiveness by Industry, 2025-2035
  • Figure 24: Global Market Attractiveness by Region, 2025-2035
  • Figure 25: North America Market Value (USD Million) by Service Type, 2025-2035
  • Figure 26: North America Market Value (USD Million) by Device, 2025-2035
  • Figure 27: North America Market Value (USD Million) by Industry, 2025-2035
  • Figure 28: North America Market Value (USD Million) by Country, 2025-2035
  • Figure 29: North America Market Value (USD Million) Analysis by Country, 2020-2035
  • Figure 30: North America Market Volume (Units) Analysis by Country, 2020-2035
  • Figure 31: North America Market Value Share (%) and BPS Analysis by Country, 2025-2035
  • Figure 32: North America Market Y-o-Y Growth (%) Projections by Country, 2025-2035
  • Figure 33: North America Market Value (USD Million) Analysis by Service Type, 2020-2035
  • Figure 34: North America Market Volume (Units) Analysis by Service Type, 2020-2035
  • Figure 35: North America Market Value Share (%) and BPS Analysis by Service Type, 2025-2035
  • Figure 36: North America Market Y-o-Y Growth (%) Projections by Service Type, 2025-2035
  • Figure 37: North America Market Value (USD Million) Analysis by Device, 2020-2035
  • Figure 38: North America Market Volume (Units) Analysis by Device, 2020-2035
  • Figure 39: North America Market Value Share (%) and BPS Analysis by Device, 2025-2035
  • Figure 40: North America Market Y-o-Y Growth (%) Projections by Device, 2025-2035
  • Figure 41: North America Market Value (USD Million) Analysis by Industry, 2020-2035
  • Figure 42: North America Market Volume (Units) Analysis by Industry, 2020-2035
  • Figure 43: North America Market Value Share (%) and BPS Analysis by Industry, 2025-2035
  • Figure 44: North America Market Y-o-Y Growth (%) Projections by Industry, 2025-2035
  • Figure 45: North America Market Attractiveness by Service Type, 2025-2035
  • Figure 46: North America Market Attractiveness by Device, 2025-2035
  • Figure 47: North America Market Attractiveness by Industry, 2025-2035
  • Figure 48: North America Market Attractiveness by Country, 2025-2035
  • Figure 49: Latin America Market Value (USD Million) by Service Type, 2025-2035
  • Figure 50: Latin America Market Value (USD Million) by Device, 2025-2035
  • Figure 51: Latin America Market Value (USD Million) by Industry, 2025-2035
  • Figure 52: Latin America Market Value (USD Million) by Country, 2025-2035
  • Figure 53: Latin America Market Value (USD Million) Analysis by Country, 2020-2035
  • Figure 54: Latin America Market Volume (Units) Analysis by Country, 2020-2035
  • Figure 55: Latin America Market Value Share (%) and BPS Analysis by Country, 2025-2035
  • Figure 56: Latin America Market Y-o-Y Growth (%) Projections by Country, 2025-2035
  • Figure 57: Latin America Market Value (USD Million) Analysis by Service Type, 2020-2035
  • Figure 58: Latin America Market Volume (Units) Analysis by Service Type, 2020-2035
  • Figure 59: Latin America Market Value Share (%) and BPS Analysis by Service Type, 2025-2035
  • Figure 60: Latin America Market Y-o-Y Growth (%) Projections by Service Type, 2025-2035
  • Figure 61: Latin America Market Value (USD Million) Analysis by Device, 2020-2035
  • Figure 62: Latin America Market Volume (Units) Analysis by Device, 2020-2035
  • Figure 63: Latin America Market Value Share (%) and BPS Analysis by Device, 2025-2035
  • Figure 64: Latin America Market Y-o-Y Growth (%) Projections by Device, 2025-2035
  • Figure 65: Latin America Market Value (USD Million) Analysis by Industry, 2020-2035
  • Figure 66: Latin America Market Volume (Units) Analysis by Industry, 2020-2035
  • Figure 67: Latin America Market Value Share (%) and BPS Analysis by Industry, 2025-2035
  • Figure 68: Latin America Market Y-o-Y Growth (%) Projections by Industry, 2025-2035
  • Figure 69: Latin America Market Attractiveness by Service Type, 2025-2035
  • Figure 70: Latin America Market Attractiveness by Device, 2025-2035
  • Figure 71: Latin America Market Attractiveness by Industry, 2025-2035
  • Figure 72: Latin America Market Attractiveness by Country, 2025-2035
  • Figure 73: Europe Market Value (USD Million) by Service Type, 2025-2035
  • Figure 74: Europe Market Value (USD Million) by Device, 2025-2035
  • Figure 75: Europe Market Value (USD Million) by Industry, 2025-2035
  • Figure 76: Europe Market Value (USD Million) by Country, 2025-2035
  • Figure 77: Europe Market Value (USD Million) Analysis by Country, 2020-2035
  • Figure 78: Europe Market Volume (Units) Analysis by Country, 2020-2035
  • Figure 79: Europe Market Value Share (%) and BPS Analysis by Country, 2025-2035
  • Figure 80: Europe Market Y-o-Y Growth (%) Projections by Country, 2025-2035
  • Figure 81: Europe Market Value (USD Million) Analysis by Service Type, 2020-2035
  • Figure 82: Europe Market Volume (Units) Analysis by Service Type, 2020-2035
  • Figure 83: Europe Market Value Share (%) and BPS Analysis by Service Type, 2025-2035
  • Figure 84: Europe Market Y-o-Y Growth (%) Projections by Service Type, 2025-2035
  • Figure 85: Europe Market Value (USD Million) Analysis by Device, 2020-2035
  • Figure 86: Europe Market Volume (Units) Analysis by Device, 2020-2035
  • Figure 87: Europe Market Value Share (%) and BPS Analysis by Device, 2025-2035
  • Figure 88: Europe Market Y-o-Y Growth (%) Projections by Device, 2025-2035
  • Figure 89: Europe Market Value (USD Million) Analysis by Industry, 2020-2035
  • Figure 90: Europe Market Volume (Units) Analysis by Industry, 2020-2035
  • Figure 91: Europe Market Value Share (%) and BPS Analysis by Industry, 2025-2035
  • Figure 92: Europe Market Y-o-Y Growth (%) Projections by Industry, 2025-2035
  • Figure 93: Europe Market Attractiveness by Service Type, 2025-2035
  • Figure 94: Europe Market Attractiveness by Device, 2025-2035
  • Figure 95: Europe Market Attractiveness by Industry, 2025-2035
  • Figure 96: Europe Market Attractiveness by Country, 2025-2035
  • Figure 97: East Asia Market Value (USD Million) by Service Type, 2025-2035
  • Figure 98: East Asia Market Value (USD Million) by Device, 2025-2035
  • Figure 99: East Asia Market Value (USD Million) by Industry, 2025-2035
  • Figure 100: East Asia Market Value (USD Million) by Country, 2025-2035
  • Figure 101: East Asia Market Value (USD Million) Analysis by Country, 2020-2035
  • Figure 102: East Asia Market Volume (Units) Analysis by Country, 2020-2035
  • Figure 103: East Asia Market Value Share (%) and BPS Analysis by Country, 2025-2035
  • Figure 104: East Asia Market Y-o-Y Growth (%) Projections by Country, 2025-2035
  • Figure 105: East Asia Market Value (USD Million) Analysis by Service Type, 2020-2035
  • Figure 106: East Asia Market Volume (Units) Analysis by Service Type, 2020-2035
  • Figure 107: East Asia Market Value Share (%) and BPS Analysis by Service Type, 2025-2035
  • Figure 108: East Asia Market Y-o-Y Growth (%) Projections by Service Type, 2025-2035
  • Figure 109: East Asia Market Value (USD Million) Analysis by Device, 2020-2035
  • Figure 110: East Asia Market Volume (Units) Analysis by Device, 2020-2035
  • Figure 111: East Asia Market Value Share (%) and BPS Analysis by Device, 2025-2035
  • Figure 112: East Asia Market Y-o-Y Growth (%) Projections by Device, 2025-2035
  • Figure 113: East Asia Market Value (USD Million) Analysis by Industry, 2020-2035
  • Figure 114: East Asia Market Volume (Units) Analysis by Industry, 2020-2035
  • Figure 115: East Asia Market Value Share (%) and BPS Analysis by Industry, 2025-2035
  • Figure 116: East Asia Market Y-o-Y Growth (%) Projections by Industry, 2025-2035
  • Figure 117: East Asia Market Attractiveness by Service Type, 2025-2035
  • Figure 118: East Asia Market Attractiveness by Device, 2025-2035
  • Figure 119: East Asia Market Attractiveness by Industry, 2025-2035
  • Figure 120: East Asia Market Attractiveness by Country, 2025-2035
  • Figure 121: South Asia & Pacific Market Value (USD Million) by Service Type, 2025-2035
  • Figure 122: South Asia & Pacific Market Value (USD Million) by Device, 2025-2035
  • Figure 123: South Asia & Pacific Market Value (USD Million) by Industry, 2025-2035
  • Figure 124: South Asia & Pacific Market Value (USD Million) by Country, 2025-2035
  • Figure 125: South Asia & Pacific Market Value (USD Million) Analysis by Country, 2020-2035
  • Figure 126: South Asia & Pacific Market Volume (Units) Analysis by Country, 2020-2035
  • Figure 127: South Asia & Pacific Market Value Share (%) and BPS Analysis by Country, 2025-2035
  • Figure 128: South Asia & Pacific Market Y-o-Y Growth (%) Projections by Country, 2025-2035
  • Figure 129: South Asia & Pacific Market Value (USD Million) Analysis by Service Type, 2020-2035
  • Figure 130: South Asia & Pacific Market Volume (Units) Analysis by Service Type, 2020-2035
  • Figure 131: South Asia & Pacific Market Value Share (%) and BPS Analysis by Service Type, 2025-2035
  • Figure 132: South Asia & Pacific Market Y-o-Y Growth (%) Projections by Service Type, 2025-2035
  • Figure 133: South Asia & Pacific Market Value (USD Million) Analysis by Device, 2020-2035
  • Figure 134: South Asia & Pacific Market Volume (Units) Analysis by Device, 2020-2035
  • Figure 135: South Asia & Pacific Market Value Share (%) and BPS Analysis by Device, 2025-2035
  • Figure 136: South Asia & Pacific Market Y-o-Y Growth (%) Projections by Device, 2025-2035
  • Figure 137: South Asia & Pacific Market Value (USD Million) Analysis by Industry, 2020-2035
  • Figure 138: South Asia & Pacific Market Volume (Units) Analysis by Industry, 2020-2035
  • Figure 139: South Asia & Pacific Market Value Share (%) and BPS Analysis by Industry, 2025-2035
  • Figure 140: South Asia & Pacific Market Y-o-Y Growth (%) Projections by Industry, 2025-2035
  • Figure 141: South Asia & Pacific Market Attractiveness by Service Type, 2025-2035
  • Figure 142: South Asia & Pacific Market Attractiveness by Device, 2025-2035
  • Figure 143: South Asia & Pacific Market Attractiveness by Industry, 2025-2035
  • Figure 144: South Asia & Pacific Market Attractiveness by Country, 2025-2035
  • Figure 145: Middle East and Africa Market Value (USD Million) by Service Type, 2025-2035
  • Figure 146: Middle East and Africa Market Value (USD Million) by Device, 2025-2035
  • Figure 147: Middle East and Africa Market Value (USD Million) by Industry, 2025-2035
  • Figure 148: Middle East and Africa Market Value (USD Million) by Country, 2025-2035
  • Figure 149: Middle East and Africa Market Value (USD Million) Analysis by Country, 2020-2035
  • Figure 150: Middle East and Africa Market Volume (Units) Analysis by Country, 2020-2035
  • Figure 151: Middle East and Africa Market Value Share (%) and BPS Analysis by Country, 2025-2035
  • Figure 152: Middle East and Africa Market Y-o-Y Growth (%) Projections by Country, 2025-2035
  • Figure 153: Middle East and Africa Market Value (USD Million) Analysis by Service Type, 2020-2035
  • Figure 154: Middle East and Africa Market Volume (Units) Analysis by Service Type, 2020-2035
  • Figure 155: Middle East and Africa Market Value Share (%) and BPS Analysis by Service Type, 2025-2035
  • Figure 156: Middle East and Africa Market Y-o-Y Growth (%) Projections by Service Type, 2025-2035
  • Figure 157: Middle East and Africa Market Value (USD Million) Analysis by Device, 2020-2035
  • Figure 158: Middle East and Africa Market Volume (Units) Analysis by Device, 2020-2035
  • Figure 159: Middle East and Africa Market Value Share (%) and BPS Analysis by Device, 2025-2035
  • Figure 160: Middle East and Africa Market Y-o-Y Growth (%) Projections by Device, 2025-2035
  • Figure 161: Middle East and Africa Market Value (USD Million) Analysis by Industry, 2020-2035
  • Figure 162: Middle East and Africa Market Volume (Units) Analysis by Industry, 2020-2035
  • Figure 163: Middle East and Africa Market Value Share (%) and BPS Analysis by Industry, 2025-2035
  • Figure 164: Middle East and Africa Market Y-o-Y Growth (%) Projections by Industry, 2025-2035
  • Figure 165: Middle East and Africa Market Attractiveness by Service Type, 2025-2035
  • Figure 166: Middle East and Africa Market Attractiveness by Device, 2025-2035
  • Figure 167: Middle East and Africa Market Attractiveness by Industry, 2025-2035
  • Figure 168: Middle East and Africa Market Attractiveness by Country, 2025-2035

Frequently Asked Questions

How big is the Voice Commerce Services Market in 2025?

The global Voice Commerce Services Market is estimated to be valued at USD 27,400.7 million in 2025.

What will be the size of Voice Commerce Services Market in 2035?

The market size for the Voice Commerce Services Market is projected to reach USD 95,203.1 million by 2035.

How much will be the Voice Commerce Services Market growth between 2025 and 2035?

The Voice Commerce Services Market is expected to grow at a 13.3% CAGR between 2025 and 2035.

What are the key service types in the Voice Commerce Services Market?

The key service types in the Voice Commerce Services Market are voice-enabled ordering, voice-based search & discovery, and voice payment & authentication.

Which industry adoption segment will contribute significant share in the Voice Commerce Services Market in 2025?

In terms of industry adoption, Retail & e-commerce is expected to command the largest share at 57.5% of the market in 2025.

Explore Similar Insights

Future Market Insights

Voice Commerce Services Market