Walk Through Air Shower Market Forecast and Outlook (2025-2035)

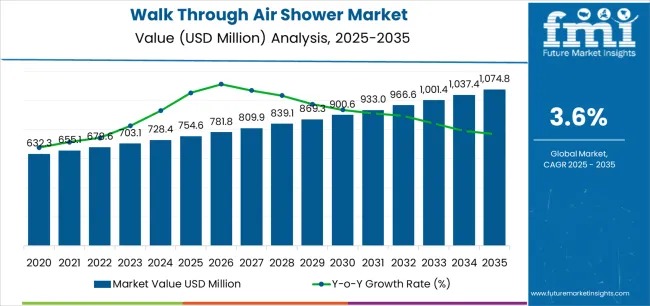
The global walk through air shower market is expected to grow from USD 754.6 million in 2025 to approximately USD 1,074.7 million by 2035, recording an absolute increase of USD 320.1 million over the forecast period. This translates into a total growth of 42.4%, with the market forecast to expand at a CAGR of 3.6% between 2025 and 2035. The market size is expected to grow by nearly 1.4X during the same period, supported by increasing global demand for contamination control equipment, growing adoption of cleanroom entry systems in pharmaceutical manufacturing applications, and rising quality standards driving professional air shower procurement across various electronics production and laboratory research facilities.

The market trajectory reflects accelerating cleanroom construction activity, particularly in pharmaceutical and electronics manufacturing sectors where product quality and contamination prevention drive stringent entry protocols. Medium-capacity air showers serving two to four personnel continue to dominate installations, offering practical balance between throughput efficiency and space requirements. Higher capacity systems remain concentrated in large-scale manufacturing facilities where personnel traffic volumes justify investment in multi-person entry systems.
Quick Stats for Walk Through Air Shower Market

  • Walk Through Air Shower Market Value (2025): USD 754.6 million
  • Walk Through Air Shower Market Forecast Value (2035): USD 1,074.7 million
  • Walk Through Air Shower Market CAGR: 3.6%
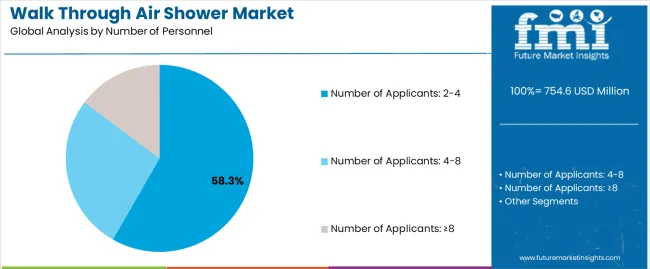
  • Leading Segment by Number of Personnel (2025): Number of Applicants: 2–4 (58.3%)
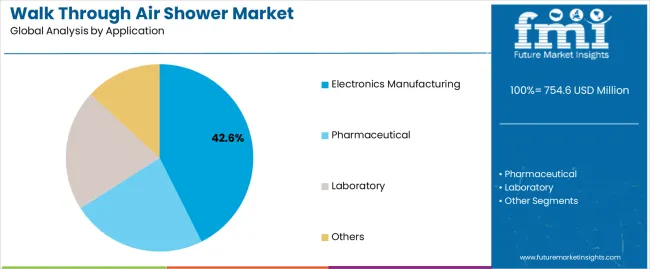
  • Leading Segment by Application (2025): Electronics Manufacturing (42.6%)
  • Key Growth Regions: Asia Pacific, Europe, and North America
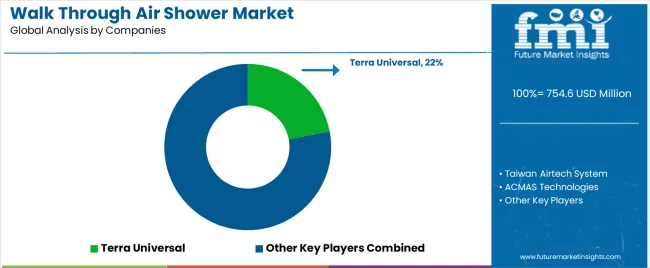
  • Top Companies by Market Share: Terra Universal, Taiwan Airtech System, ACMAS Technologies

Walk Through Air Shower Market Market Value Analysis

Regional growth patterns demonstrate particular strength in Asian markets, where expanding pharmaceutical production and semiconductor fabrication drive consistent air shower installation. European markets maintain steady growth through regulatory compliance requirements and pharmaceutical GMP standards, while North American markets show increasing activity in biotechnology research facilities leveraging stringent contamination control frameworks. Manufacturing facility modernization and ISO cleanroom certification requirements continue to support demand for established equipment suppliers with proven contamination reduction performance.

Technology advancement in nozzle design, airflow optimization, and control system intelligence continues to improve decontamination efficacy while reducing energy consumption. The integration of automated door interlocks and personnel detection sensors enhances operational efficiency for high-traffic installations. Manufacturers are developing modular designs and simplified installation procedures to reduce project deployment timelines and facility integration complexity.

Walk Through Air Shower Market Key Takeaways

Metric Value
Market Value (2025) USD 754.6 million
Market Forecast Value (2035) USD 1,074.7 million
Forecast CAGR (2025-2035) 3.6%

Why is the Walk Through Air Shower Market Growing?

MANUFACTURING EXPANSION CONTAMINATION CONTROL REQUIREMENTS REGULATORY & QUALITY STANDARDS
Pharmaceutical Production Growth Cleanroom Entry Standards GMP Compliance Requirements
Continuous expansion of pharmaceutical manufacturing capacity across emerging markets driving demand for contamination control entry systems. Modern cleanroom operations requiring certified entry equipment delivering proven particle removal and contamination prevention performance. Regulatory requirements establishing cleanroom entry protocols favoring validated air shower systems with documented performance.
Electronics Fabrication Development Particle Contamination Prevention ISO Cleanroom Certification
Growing emphasis on semiconductor manufacturing and electronics assembly quality creating demand for personnel decontamination systems. Facility managers investing in air shower equipment offering consistent contamination reduction while maintaining production efficiency. Quality standards requiring validated entry systems and comprehensive documentation for cleanroom classification maintenance.
Biotechnology Research Expansion Cross-Contamination Control Facility Validation Standards
Superior particle removal characteristics and airflow performance making air showers essential for controlled environment entry applications. Certified manufacturers with proven contamination reduction records required for pharmaceutical and biotechnology facility applications. Laboratory accreditation and facility certification standards driving need for documented air shower performance verification.

Walk Through Air Shower Market Segmentation

Category Segments Covered
By Number of Personnel Number of Applicants: 2-4, Number of Applicants: 4-8, Number of Applicants: ≥8
By Application Electronics Manufacturing, Pharmaceutical, Laboratory, Others
By Region North America, Europe, Asia Pacific, Latin America, Middle East & Africa

Walk Through Air Shower Market Analysis by Number of Personnel

Walk Through Air Shower Market Analysis By Number Of Personnel

Segment 2025 to 2035 Outlook
Number of Applicants: 2-4
  • Leader in 2025 with 58.3% market share, likely to maintain leadership through 2035. Broadest application range across pharmaceutical and electronics facilities, practical footprint requirements, cost-effective installation.
  • Momentum: steady growth driven by pharmaceutical manufacturing expansion and cleanroom facility construction.
  • Watchouts: space constraints in retrofit installations and single-person entry efficiency limitations.
Number of Applicants: 4-8
  • Mid-range segment with 28.7% market share in 2025, concentrated in high-traffic manufacturing environments. Enhanced throughput capacity and reduced personnel queue times requiring larger facility footprints.
  • Momentum: moderate growth in large-scale electronics fabrication and pharmaceutical production facilities requiring efficient personnel flow.
  • Watchouts: higher capital costs limiting adoption in smaller facilities and increased energy consumption considerations.
Number of Applicants: ≥8
  • Large-capacity segment with 13.0% market share in 2025, focused on major manufacturing complexes. Maximum throughput optimization for shift-change periods and high-density workforce facilities.
  • Momentum: modest growth in mega-fabrication facilities and large pharmaceutical production sites with concentrated personnel traffic.
  • Watchouts: significant space requirements and installation complexity limiting market applicability.

Walk Through Air Shower Market Analysis by Application

Walk Through Air Shower Market Analysis By Application

Segment 2025 to 2035 Outlook
Electronics Manufacturing
  • At 42.6%, largest application segment in 2025 with established contamination control practices. Semiconductor fabrication, display panel production, precision electronics assembly.
  • Momentum: strong growth driven by semiconductor capacity expansion and advanced electronics manufacturing investment.
  • Watchouts: production facility relocation patterns and automation reducing personnel entry requirements.
Pharmaceutical
  • Significant segment with 31.8% market share in 2025, driven by GMP compliance and sterile manufacturing requirements. API production, sterile filling operations, biotechnology manufacturing.
  • Momentum: steady growth through biosimilar production expansion and pharmaceutical manufacturing capacity additions.
  • Watchouts: regulatory standard changes and isolator technology adoption in aseptic processing.
Laboratory
  • Growing segment with 18.4% market share in 2025, addressing research facility and testing laboratory requirements. Microbiological laboratories, analytical testing facilities, research institutions.
  • Momentum: moderate growth via biotechnology research expansion and contract testing laboratory development.
  • Watchouts: budget constraints in academic institutions and variable contamination control requirements across laboratory types.
Others
  • Residual segment with 7.2% market share in 2025, covering aerospace, food processing, and specialty manufacturing.
  • Momentum: limited growth due to diverse requirements and alternative contamination control approaches.

What are the Key Trends, Drivers, and Restraints in the Walk Through Air Shower Market? 

DRIVERS RESTRAINTS KEY TRENDS
Pharmaceutical Manufacturing Expansion High Capital Investment Requirements Intelligent Control Systems
Global pharmaceutical production capacity growth and biosimilar manufacturing development driving cleanroom entry equipment across established and emerging markets. Significant upfront costs for large-capacity systems affecting adoption in budget-constrained facilities and smaller manufacturing operations. Integration of personnel detection sensors and automated door interlocks improving operational efficiency and reducing energy consumption during idle periods.
Semiconductor Fabrication Growth Space Requirements Energy Efficiency Optimization
Advanced semiconductor manufacturing and electronics assembly expansion requiring stringent contamination control for product yield protection. Substantial footprint requirements for medium and large capacity units creating retrofit challenges in existing facilities. Development of variable frequency drives and optimized nozzle designs reducing electrical consumption while maintaining decontamination performance.
Cleanroom Certification Standards Maintenance Complexity Modular Design Innovation
ISO cleanroom classification requirements and facility validation standards mandating validated entry systems for contamination control. HEPA filter replacement costs and regular maintenance requirements creating ongoing operational expenses and downtime concerns. Prefabricated modular construction and simplified installation procedures reducing project timelines and facility integration complexity.

Analysis of Walk Through Air Shower Market by Key Countries

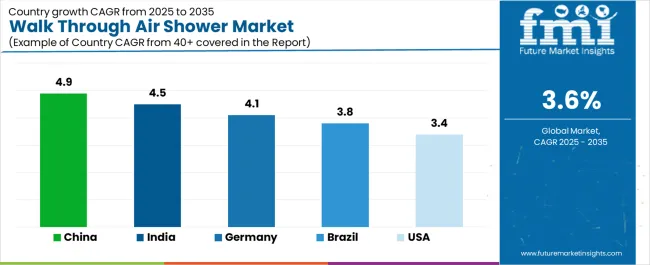
Walk Through Air Shower Market Cagr Analysis By Country

Country CAGR (2025-2035)
China 4.9%
India 4.5%
Germany 4.1%
Brazil 3.8%
United States 3.4%

How is China Leading the Walk-Through Air Showers Market Growth?

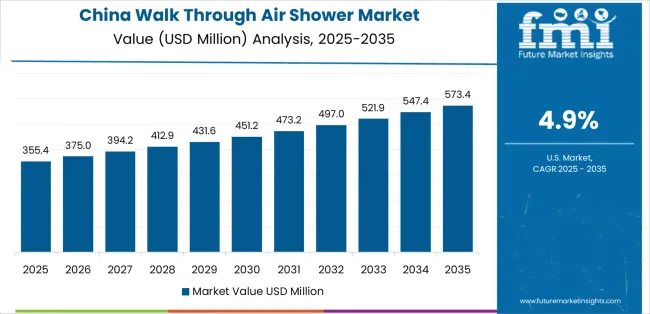
Walk Through Air Shower Market Country Value Analysis

Revenue from walk-through air showers in China is projected to exhibit strong growth, with a market CAGR of 4.9% by 2035. This growth is driven by expanding pharmaceutical production capacity and comprehensive semiconductor fabrication infrastructure, creating substantial opportunities for contamination control equipment suppliers across pharmaceutical manufacturing operations, electronics production facilities, and research laboratory sectors.

The country’s established cleanroom construction tradition and expanding GMP compliance capabilities are generating significant demand for both standard and large-capacity air shower systems. Major pharmaceutical manufacturers and semiconductor fabricators are establishing comprehensive contamination control equipment procurement programs to support large-scale facility operations and meet growing quality standards.

Pharmaceutical manufacturing expansion programs are supporting widespread adoption of air shower systems across production facilities, driving demand for cost-effective contamination control equipment. Semiconductor fabrication capacity development initiatives and electronics assembly growth are creating substantial opportunities for equipment suppliers requiring reliable particle removal performance and competitive manufacturing costs. Regional pharmaceutical production expansion and provincial cleanroom construction development are facilitating adoption of air shower systems throughout major manufacturing regions.

What Factors are Driving India's Walk-Through Air Showers Market?

Revenue from walk-through air showers in India is expanding at a CAGR of 4.5% to reach USD 171.8 million by 2035, supported by extensive pharmaceutical manufacturing development and comprehensive biotechnology facility construction, which creates sustained demand for contamination control equipment across diverse production categories and research application segments. The country’s rapidly growing pharmaceutical industry and expanding cleanroom facility capabilities are driving demand for air shower systems that provide consistent particle removal performance while supporting cost-effective installation requirements. Pharmaceutical manufacturers and contract research organizations are investing in contamination control equipment to support growing production volumes and regulatory compliance requirements.

Pharmaceutical production facility expansion and biotechnology manufacturing capability development are creating opportunities for air shower systems across diverse application segments requiring reliable contamination control performance and competitive equipment costs. Generic pharmaceutical production growth and contract manufacturing advancement are driving investments in contamination control equipment supply chains supporting GMP compliance requirements throughout major pharmaceutical manufacturing regions. Quality standardization programs and facility validation development are enhancing demand for certified air shower systems throughout Indian pharmaceutical markets.

How is Germany Maintaining Leadership in the Walk-Through Air Showers Market?

Demand for walk-through air showers in Germany is projected to expand at a CAGR of 4.1%, supported by the country's leadership in pharmaceutical manufacturing and advanced biotechnology production. These sectors require sophisticated contamination control equipment for sterile manufacturing and research applications. German pharmaceutical companies are implementing air shower systems that support comprehensive validation protocols, operational reliability, and stringent GMP compliance requirements. The market is characterized by a focus on particle removal efficiency, energy performance, and adherence to European pharmaceutical manufacturing standards.

Pharmaceutical industry investments are prioritizing contamination control equipment that demonstrates superior decontamination performance and documentation capabilities while meeting German environmental protection and workplace safety standards. Biotechnology manufacturing leadership programs and quality excellence initiatives are driving adoption of premium-grade air shower systems that support advanced cleanroom operations and validation requirements. Research and development programs for energy-efficient designs are facilitating adoption of environmentally optimized equipment technologies throughout major pharmaceutical production centers.

What is Driving the Walk-Through Air Showers Market in the United States?

Revenue from walk-through air showers in the United States is growing at a CAGR of 3.4%, driven by biotechnology manufacturing development programs and pharmaceutical production expansion, which create sustained opportunities for contamination control equipment suppliers serving both biopharmaceutical manufacturers and contract development organizations. The country’s extensive pharmaceutical manufacturing infrastructure and expanding biosimilar production sector are creating demand for air shower systems that support diverse contamination control requirements while maintaining regulatory compliance standards. Equipment manufacturers and cleanroom contractors are developing supply strategies to support facility construction and equipment validation requirements.

Biotechnology manufacturing programs and pharmaceutical production capacity additions are facilitating adoption of air shower systems capable of supporting diverse cleanroom classification requirements and competitive performance standards. Sterile manufacturing expansion and cell therapy production development are enhancing demand for validated contamination control equipment that supports operational efficiency and regulatory compliance. Academic research facility construction and government laboratory modernization are creating opportunities for air shower capabilities across American pharmaceutical and research facilities.

How is Brazil Expanding Its Walk-Through Air Showers Market?

Demand for walk-through air showers in Brazil is projected to reach a CAGR of 3.8%, driven by pharmaceutical manufacturing development and generic production capabilities supporting healthcare infrastructure growth and comprehensive pharmaceutical manufacturing applications. The country’s expanding pharmaceutical industry and growing cleanroom facility market segments are creating demand for contamination control equipment that supports operational performance and GMP compliance standards. Pharmaceutical manufacturers and facility construction contractors are maintaining comprehensive equipment sourcing capabilities to support diverse project requirements.

Pharmaceutical production programs and generic manufacturing expansion are supporting demand for air shower systems that meet contemporary particle removal and validation documentation standards. Healthcare infrastructure development and biotechnology facility construction programs are creating opportunities for contamination control equipment that provides comprehensive cleanroom entry support. Manufacturing quality enhancement and regulatory compliance programs are facilitating adoption of certified air shower capabilities throughout major pharmaceutical production regions.
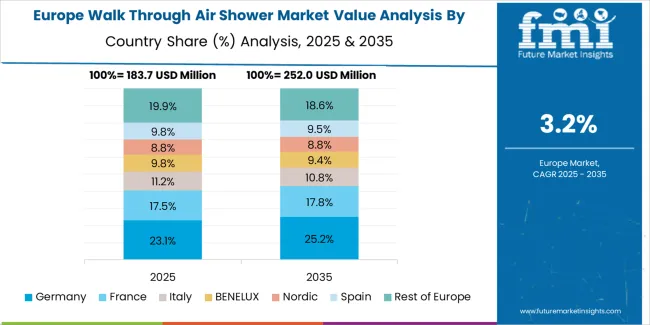
Europe Market Split by Country

Walk Through Air Shower Market Europe Country Market Share Analysis, 2025 & 2035

The walk through air shower market in Europe is projected to grow from USD 226.4 million in 2025 to USD 322.4 million by 2035, registering a CAGR of 3.6% over the forecast period. Germany is expected to maintain its leadership position with a 32.8% market share in 2025, projected to reach 33.4% by 2035, supported by its extensive pharmaceutical manufacturing infrastructure and electronics production capabilities.

Switzerland follows with a 21.6% share in 2025, expected to reach 22.1% by 2035, driven by comprehensive pharmaceutical industry concentration and biotechnology research facility development. France holds a 16.9% share in 2025, projected to reach 17.3% by 2035 due to pharmaceutical production expansion. Italy commands a 13.2% share, while the United Kingdom accounts for 10.4% in 2025. The Rest of Europe region is anticipated to maintain its collective share at approximately 5.1% through 2035, reflecting established market patterns in Eastern European pharmaceutical manufacturing centers.
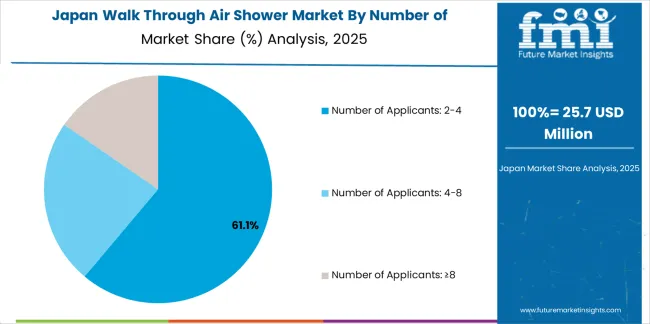
Premium Quality Standards Define Japanese Market Dynamics

Walk Through Air Shower Market Japan Market Share Analysis By Number Of Personnel

Japanese walk through air shower operations reflect the country's emphasis on manufacturing precision and contamination control excellence. Major pharmaceutical companies including Takeda and Daiichi Sankyo maintain rigorous equipment qualification processes requiring extensive particle removal efficiency testing, airflow uniformity verification, and comprehensive validation documentation. This creates barriers for equipment suppliers but ensures contamination control performance for critical manufacturing environments.

The Japanese market demonstrates preference for compact air shower designs suitable for space-constrained manufacturing facilities and integration with existing cleanroom infrastructure. Companies require specific control system approaches that address integration with facility management systems and automated door sequencing. Performance specifications emphasize energy efficiency and noise reduction, driving demand for optimized blower designs and acoustic treatment.

Regulatory oversight through the Pharmaceuticals and Medical Devices Agency emphasizes comprehensive validation requirements and manufacturing facility standards. The GMP inspection system supports air shower specification through contamination control verification, creating advantages for suppliers with detailed performance documentation and local technical support capabilities.
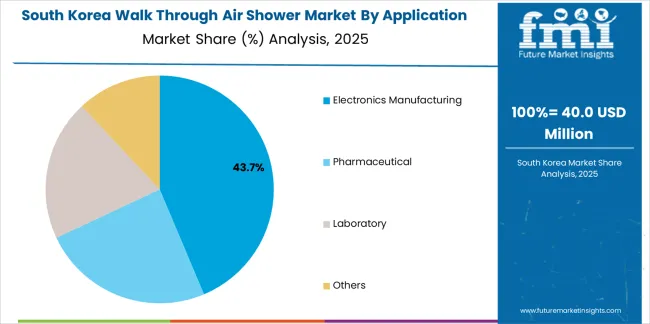
Market Dynamics Drive Innovation in South Korea

Walk Through Air Shower Market South Korea Market Share Analysis By Application

South Korean walk through air shower operations reflect the country's advanced semiconductor manufacturing sector and pharmaceutical production capabilities. Major electronics companies including Samsung Electronics and SK Hynix drive equipment procurement strategies, establishing relationships with certified suppliers to support large-scale fabrication facilities and cleanroom expansion programs.

The Korean market demonstrates strength in high-capacity air shower installations serving mega-fabrication facilities with thousands of personnel requiring efficient shift-change processing. Companies integrate air shower systems with comprehensive facility automation platforms, requiring suppliers to provide building management system compatibility and remote monitoring capabilities. This sophistication creates demand for intelligent control systems and predictive maintenance features.

Regulatory frameworks emphasize environmental protection and energy efficiency standards. Korea Institute of Industrial Technology oversight establishes equipment performance requirements that favor energy-efficient designs with optimized airflow patterns. This benefits suppliers with advanced nozzle technology and variable frequency drive integration for energy consumption reduction.
Competitive Landscape of Walk Through Air Shower Market

Walk Through Air Shower Market Analysis By Company

Profit pools are consolidating around established contamination control equipment manufacturers with proven validation documentation and comprehensive technical support capabilities. Value is migrating from basic air shower equipment to integrated entry systems offering intelligent controls, energy optimization features, and remote monitoring platforms that reduce operational costs and improve facility management. Several archetypes set the pace: global cleanroom equipment specialists defending share through pharmaceutical industry relationships and regulatory expertise; regional manufacturers capturing electronics fabrication segments through customization capabilities and local service networks; modular equipment suppliers offering prefabricated solutions for rapid deployment; and control system innovators providing automation integration and predictive maintenance platforms.

Switching costs remain significant due to facility integration requirements, validation documentation needs, and operational procedure dependencies that stabilize incumbent relationships. Technology differentiation around energy efficiency, throughput optimization, and intelligent control systems creates openings for innovative suppliers to capture new facility construction projects. Equipment standardization in pharmaceutical applications and customization demands in electronics manufacturing create divergent competitive dynamics across market segments.

Consolidation continues as larger facility equipment companies acquire regional air shower manufacturers to expand product portfolios and geographic coverage. Vertical integration accelerates with cleanroom construction firms developing preferred supplier relationships and turnkey project capabilities that bundle air shower equipment with facility construction services. Digital platforms for remote monitoring and predictive maintenance are becoming important differentiators, requiring software investment that pressures smaller manufacturers.

Market dynamics favor suppliers who can demonstrate particle removal efficiency through validation test portfolios, offer comprehensive technical support throughout facility qualification processes, and maintain manufacturing reliability that ensures project delivery schedules. Price competition intensifies in standard pharmaceutical applications where equipment specifications are well-defined, while custom electronics fabrication installations offer opportunities for premium positioning through engineering capabilities. Establish pharmaceutical industry validation documentation with comprehensive test reports and regulatory compliance records; develop energy-efficient designs with intelligent control systems for operational cost reduction; invest in modular construction capabilities and rapid deployment solutions for competitive project timelines.

Key Players in the Walk Through Air Shower Market

  • Terra Universal
  • Taiwan Airtech System
  • ACMAS Technologies
  • Sunnyda Clean Room
  • Clean Air Products
  • INTECH Air & Clean Tech
  • Air Clean Deviser Taiwan (ACDT)
  • Hytech
  • Suzhou Indair Indoor Air Tech
  • SNYLY
  • Keling
  • LENGE

Scope of the Report

Items Values
Quantitative Units USD 754.6 million
Number of Personnel Number of Applicants: 2-4, Number of Applicants: 4-8, Number of Applicants: ≥8
Application Electronics Manufacturing, Pharmaceutical, Laboratory, Others
Regions Covered North America, Latin America, Europe, Asia Pacific, Middle East & Africa
Country Covered China, India, Germany, Switzerland, France, United States, and other 40+ countries
Key Companies Profiled Terra Universal, Taiwan Airtech System, ACMAS Technologies, Sunnyda Clean Room, Clean Air Products, INTECH Air & Clean Tech, Air Clean Deviser Taiwan (ACDT), Hytech, Suzhou Indair Indoor Air Tech, SNYLY, Keling, LENGE
Additional Attributes Dollar sales by personnel capacity/application, regional demand (NA, EU, APAC, LATAM, MEA), competitive landscape, pharmaceutical vs electronics adoption, facility integration capabilities, and technology innovations driving contamination control performance, energy efficiency, and operational reliability

Walk Through Air Shower Market Segmentation

By Number of Personnel

  • Number of Applicants: 2-4
  • Number of Applicants: 4-8
  • Number of Applicants: ≥8

By Application

  • Electronics Manufacturing
  • Pharmaceutical
  • Laboratory
  • Others

By Region

  • North America
  • Europe
  • Asia Pacific
  • Latin America
  • Middle East & Africa

Frequently Asked Questions

How big is the walk through air shower market in 2025?

The global walk through air shower market is estimated to be valued at USD 754.6 million in 2025.

What will be the size of walk through air shower market in 2035?

The market size for the walk through air shower market is projected to reach USD 1,074.8 million by 2035.

How much will be the walk through air shower market growth between 2025 and 2035?

The walk through air shower market is expected to grow at a 3.6% CAGR between 2025 and 2035.

What are the key product types in the walk through air shower market?

The key product types in walk through air shower market are number of applicants: 2-4, number of applicants: 4-8 and number of applicants: ≥8.

Which application segment to contribute significant share in the walk through air shower market in 2025?

In terms of application, electronics manufacturing segment to command 42.6% share in the walk through air shower market in 2025.

Table of Content

  1. Executive Summary
    • Global Market Outlook
    • Demand to side Trends
    • Supply to side Trends
    • Technology Roadmap Analysis
    • Analysis and Recommendations
  2. Market Overview
    • Market Coverage / Taxonomy
    • Market Definition / Scope / Limitations
  3. Market Background
    • Market Dynamics
      • Drivers
      • Restraints
      • Opportunity
      • Trends
    • Scenario Forecast
      • Demand in Optimistic Scenario
      • Demand in Likely Scenario
      • Demand in Conservative Scenario
    • Opportunity Map Analysis
    • Product Life Cycle Analysis
    • Supply Chain Analysis
    • Investment Feasibility Matrix
    • Value Chain Analysis
    • PESTLE and Porter’s Analysis
    • Regulatory Landscape
    • Regional Parent Market Outlook
    • Production and Consumption Statistics
    • Import and Export Statistics
  4. Global Market Analysis 2020 to 2024 and Forecast, 2025 to 2035
    • Historical Market Size Value (USD Million) Analysis, 2020 to 2024
    • Current and Future Market Size Value (USD Million) Projections, 2025 to 2035
      • Y to o to Y Growth Trend Analysis
      • Absolute $ Opportunity Analysis
  5. Global Market Pricing Analysis 2020 to 2024 and Forecast 2025 to 2035
  6. Global Market Analysis 2020 to 2024 and Forecast 2025 to 2035, By Number of Personnel
    • Introduction / Key Findings
    • Historical Market Size Value (USD Million) Analysis By Number of Personnel , 2020 to 2024
    • Current and Future Market Size Value (USD Million) Analysis and Forecast By Number of Personnel , 2025 to 2035
      • Number of Applicants: 2-4
      • Number of Applicants: 4-8
      • Number of Applicants: ≥8
    • Y to o to Y Growth Trend Analysis By Number of Personnel , 2020 to 2024
    • Absolute $ Opportunity Analysis By Number of Personnel , 2025 to 2035
  7. Global Market Analysis 2020 to 2024 and Forecast 2025 to 2035, By Application
    • Introduction / Key Findings
    • Historical Market Size Value (USD Million) Analysis By Application, 2020 to 2024
    • Current and Future Market Size Value (USD Million) Analysis and Forecast By Application, 2025 to 2035
      • Electronics Manufacturing
      • Pharmaceutical
      • Laboratory
      • Others
    • Y to o to Y Growth Trend Analysis By Application, 2020 to 2024
    • Absolute $ Opportunity Analysis By Application, 2025 to 2035
  8. Global Market Analysis 2020 to 2024 and Forecast 2025 to 2035, By Region
    • Introduction
    • Historical Market Size Value (USD Million) Analysis By Region, 2020 to 2024
    • Current Market Size Value (USD Million) Analysis and Forecast By Region, 2025 to 2035
      • North America
      • Latin America
      • Western Europe
      • Eastern Europe
      • East Asia
      • South Asia and Pacific
      • Middle East & Africa
    • Market Attractiveness Analysis By Region
  9. North America Market Analysis 2020 to 2024 and Forecast 2025 to 2035, By Country
    • Historical Market Size Value (USD Million) Trend Analysis By Market Taxonomy, 2020 to 2024
    • Market Size Value (USD Million) Forecast By Market Taxonomy, 2025 to 2035
      • By Country
        • USA
        • Canada
        • Mexico
      • By Number of Personnel
      • By Application
    • Market Attractiveness Analysis
      • By Country
      • By Number of Personnel
      • By Application
    • Key Takeaways
  10. Latin America Market Analysis 2020 to 2024 and Forecast 2025 to 2035, By Country
    • Historical Market Size Value (USD Million) Trend Analysis By Market Taxonomy, 2020 to 2024
    • Market Size Value (USD Million) Forecast By Market Taxonomy, 2025 to 2035
      • By Country
        • Brazil
        • Chile
        • Rest of Latin America
      • By Number of Personnel
      • By Application
    • Market Attractiveness Analysis
      • By Country
      • By Number of Personnel
      • By Application
    • Key Takeaways
  11. Western Europe Market Analysis 2020 to 2024 and Forecast 2025 to 2035, By Country
    • Historical Market Size Value (USD Million) Trend Analysis By Market Taxonomy, 2020 to 2024
    • Market Size Value (USD Million) Forecast By Market Taxonomy, 2025 to 2035
      • By Country
        • Germany
        • UK
        • Italy
        • Spain
        • France
        • Nordic
        • BENELUX
        • Rest of Western Europe
      • By Number of Personnel
      • By Application
    • Market Attractiveness Analysis
      • By Country
      • By Number of Personnel
      • By Application
    • Key Takeaways
  12. Eastern Europe Market Analysis 2020 to 2024 and Forecast 2025 to 2035, By Country
    • Historical Market Size Value (USD Million) Trend Analysis By Market Taxonomy, 2020 to 2024
    • Market Size Value (USD Million) Forecast By Market Taxonomy, 2025 to 2035
      • By Country
        • Russia
        • Poland
        • Hungary
        • Balkan & Baltic
        • Rest of Eastern Europe
      • By Number of Personnel
      • By Application
    • Market Attractiveness Analysis
      • By Country
      • By Number of Personnel
      • By Application
    • Key Takeaways
  13. East Asia Market Analysis 2020 to 2024 and Forecast 2025 to 2035, By Country
    • Historical Market Size Value (USD Million) Trend Analysis By Market Taxonomy, 2020 to 2024
    • Market Size Value (USD Million) Forecast By Market Taxonomy, 2025 to 2035
      • By Country
        • China
        • Japan
        • South Korea
      • By Number of Personnel
      • By Application
    • Market Attractiveness Analysis
      • By Country
      • By Number of Personnel
      • By Application
    • Key Takeaways
  14. South Asia and Pacific Market Analysis 2020 to 2024 and Forecast 2025 to 2035, By Country
    • Historical Market Size Value (USD Million) Trend Analysis By Market Taxonomy, 2020 to 2024
    • Market Size Value (USD Million) Forecast By Market Taxonomy, 2025 to 2035
      • By Country
        • India
        • ASEAN
        • Australia & New Zealand
        • Rest of South Asia and Pacific
      • By Number of Personnel
      • By Application
    • Market Attractiveness Analysis
      • By Country
      • By Number of Personnel
      • By Application
    • Key Takeaways
  15. Middle East & Africa Market Analysis 2020 to 2024 and Forecast 2025 to 2035, By Country
    • Historical Market Size Value (USD Million) Trend Analysis By Market Taxonomy, 2020 to 2024
    • Market Size Value (USD Million) Forecast By Market Taxonomy, 2025 to 2035
      • By Country
        • Kingdom of Saudi Arabia
        • Other GCC Countries
        • Turkiye
        • South Africa
        • Other African Union
        • Rest of Middle East & Africa
      • By Number of Personnel
      • By Application
    • Market Attractiveness Analysis
      • By Country
      • By Number of Personnel
      • By Application
    • Key Takeaways
  16. Key Countries Market Analysis
    • USA
      • Pricing Analysis
      • Market Share Analysis, 2024
        • By Number of Personnel
        • By Application
    • Canada
      • Pricing Analysis
      • Market Share Analysis, 2024
        • By Number of Personnel
        • By Application
    • Mexico
      • Pricing Analysis
      • Market Share Analysis, 2024
        • By Number of Personnel
        • By Application
    • Brazil
      • Pricing Analysis
      • Market Share Analysis, 2024
        • By Number of Personnel
        • By Application
    • Chile
      • Pricing Analysis
      • Market Share Analysis, 2024
        • By Number of Personnel
        • By Application
    • Germany
      • Pricing Analysis
      • Market Share Analysis, 2024
        • By Number of Personnel
        • By Application
    • UK
      • Pricing Analysis
      • Market Share Analysis, 2024
        • By Number of Personnel
        • By Application
    • Italy
      • Pricing Analysis
      • Market Share Analysis, 2024
        • By Number of Personnel
        • By Application
    • Spain
      • Pricing Analysis
      • Market Share Analysis, 2024
        • By Number of Personnel
        • By Application
    • France
      • Pricing Analysis
      • Market Share Analysis, 2024
        • By Number of Personnel
        • By Application
    • India
      • Pricing Analysis
      • Market Share Analysis, 2024
        • By Number of Personnel
        • By Application
    • ASEAN
      • Pricing Analysis
      • Market Share Analysis, 2024
        • By Number of Personnel
        • By Application
    • Australia & New Zealand
      • Pricing Analysis
      • Market Share Analysis, 2024
        • By Number of Personnel
        • By Application
    • China
      • Pricing Analysis
      • Market Share Analysis, 2024
        • By Number of Personnel
        • By Application
    • Japan
      • Pricing Analysis
      • Market Share Analysis, 2024
        • By Number of Personnel
        • By Application
    • South Korea
      • Pricing Analysis
      • Market Share Analysis, 2024
        • By Number of Personnel
        • By Application
    • Russia
      • Pricing Analysis
      • Market Share Analysis, 2024
        • By Number of Personnel
        • By Application
    • Poland
      • Pricing Analysis
      • Market Share Analysis, 2024
        • By Number of Personnel
        • By Application
    • Hungary
      • Pricing Analysis
      • Market Share Analysis, 2024
        • By Number of Personnel
        • By Application
    • Kingdom of Saudi Arabia
      • Pricing Analysis
      • Market Share Analysis, 2024
        • By Number of Personnel
        • By Application
    • Turkiye
      • Pricing Analysis
      • Market Share Analysis, 2024
        • By Number of Personnel
        • By Application
    • South Africa
      • Pricing Analysis
      • Market Share Analysis, 2024
        • By Number of Personnel
        • By Application
  17. Market Structure Analysis
    • Competition Dashboard
    • Competition Benchmarking
    • Market Share Analysis of Top Players
      • By Regional
      • By Number of Personnel
      • By Application
  18. Competition Analysis
    • Competition Deep Dive
      • Terra Universal
        • Overview
        • Product Portfolio
        • Profitability by Market Segments (Product/Age /Sales Channel/Region)
        • Sales Footprint
        • Strategy Overview
          • Marketing Strategy
          • Product Strategy
          • Channel Strategy
      • Taiwan Airtech System
      • ACMAS Technologies
      • Sunnyda Clean Room
      • Clean Air Products
      • INTECH Air & Clean Tech
      • Air Clean Deviser Taiwan (ACDT)
      • Hytech
      • Suzhou Indair Indoor Air Tech
      • SNYLY
      • Keling
      • LENGE
  19. Assumptions & Acronyms Used
  20. Research Methodology

List of Tables

  • Table 1: Global Market Value (USD Million) Forecast by Region, 2020 to 2035
  • Table 2: Global Market Value (USD Million) Forecast by Number of Personnel , 2020 to 2035
  • Table 3: Global Market Value (USD Million) Forecast by Application, 2020 to 2035
  • Table 4: North America Market Value (USD Million) Forecast by Country, 2020 to 2035
  • Table 5: North America Market Value (USD Million) Forecast by Number of Personnel , 2020 to 2035
  • Table 6: North America Market Value (USD Million) Forecast by Application, 2020 to 2035
  • Table 7: Latin America Market Value (USD Million) Forecast by Country, 2020 to 2035
  • Table 8: Latin America Market Value (USD Million) Forecast by Number of Personnel , 2020 to 2035
  • Table 9: Latin America Market Value (USD Million) Forecast by Application, 2020 to 2035
  • Table 10: Western Europe Market Value (USD Million) Forecast by Country, 2020 to 2035
  • Table 11: Western Europe Market Value (USD Million) Forecast by Number of Personnel , 2020 to 2035
  • Table 12: Western Europe Market Value (USD Million) Forecast by Application, 2020 to 2035
  • Table 13: Eastern Europe Market Value (USD Million) Forecast by Country, 2020 to 2035
  • Table 14: Eastern Europe Market Value (USD Million) Forecast by Number of Personnel , 2020 to 2035
  • Table 15: Eastern Europe Market Value (USD Million) Forecast by Application, 2020 to 2035
  • Table 16: East Asia Market Value (USD Million) Forecast by Country, 2020 to 2035
  • Table 17: East Asia Market Value (USD Million) Forecast by Number of Personnel , 2020 to 2035
  • Table 18: East Asia Market Value (USD Million) Forecast by Application, 2020 to 2035
  • Table 19: South Asia and Pacific Market Value (USD Million) Forecast by Country, 2020 to 2035
  • Table 20: South Asia and Pacific Market Value (USD Million) Forecast by Number of Personnel , 2020 to 2035
  • Table 21: South Asia and Pacific Market Value (USD Million) Forecast by Application, 2020 to 2035
  • Table 22: Middle East & Africa Market Value (USD Million) Forecast by Country, 2020 to 2035
  • Table 23: Middle East & Africa Market Value (USD Million) Forecast by Number of Personnel , 2020 to 2035
  • Table 24: Middle East & Africa Market Value (USD Million) Forecast by Application, 2020 to 2035

List of Figures

  • Figure 1: Global Market Pricing Analysis
  • Figure 2: Global Market Value (USD Million) Forecast 2020-2035
  • Figure 3: Global Market Value Share and BPS Analysis by Number of Personnel , 2025 and 2035
  • Figure 4: Global Market Y to o to Y Growth Comparison by Number of Personnel , 2025-2035
  • Figure 5: Global Market Attractiveness Analysis by Number of Personnel
  • Figure 6: Global Market Value Share and BPS Analysis by Application, 2025 and 2035
  • Figure 7: Global Market Y to o to Y Growth Comparison by Application, 2025-2035
  • Figure 8: Global Market Attractiveness Analysis by Application
  • Figure 9: Global Market Value (USD Million) Share and BPS Analysis by Region, 2025 and 2035
  • Figure 10: Global Market Y to o to Y Growth Comparison by Region, 2025-2035
  • Figure 11: Global Market Attractiveness Analysis by Region
  • Figure 12: North America Market Incremental Dollar Opportunity, 2025-2035
  • Figure 13: Latin America Market Incremental Dollar Opportunity, 2025-2035
  • Figure 14: Western Europe Market Incremental Dollar Opportunity, 2025-2035
  • Figure 15: Eastern Europe Market Incremental Dollar Opportunity, 2025-2035
  • Figure 16: East Asia Market Incremental Dollar Opportunity, 2025-2035
  • Figure 17: South Asia and Pacific Market Incremental Dollar Opportunity, 2025-2035
  • Figure 18: Middle East & Africa Market Incremental Dollar Opportunity, 2025-2035
  • Figure 19: North America Market Value Share and BPS Analysis by Country, 2025 and 2035
  • Figure 20: North America Market Value Share and BPS Analysis by Number of Personnel , 2025 and 2035
  • Figure 21: North America Market Y to o to Y Growth Comparison by Number of Personnel , 2025-2035
  • Figure 22: North America Market Attractiveness Analysis by Number of Personnel
  • Figure 23: North America Market Value Share and BPS Analysis by Application, 2025 and 2035
  • Figure 24: North America Market Y to o to Y Growth Comparison by Application, 2025-2035
  • Figure 25: North America Market Attractiveness Analysis by Application
  • Figure 26: Latin America Market Value Share and BPS Analysis by Country, 2025 and 2035
  • Figure 27: Latin America Market Value Share and BPS Analysis by Number of Personnel , 2025 and 2035
  • Figure 28: Latin America Market Y to o to Y Growth Comparison by Number of Personnel , 2025-2035
  • Figure 29: Latin America Market Attractiveness Analysis by Number of Personnel
  • Figure 30: Latin America Market Value Share and BPS Analysis by Application, 2025 and 2035
  • Figure 31: Latin America Market Y to o to Y Growth Comparison by Application, 2025-2035
  • Figure 32: Latin America Market Attractiveness Analysis by Application
  • Figure 33: Western Europe Market Value Share and BPS Analysis by Country, 2025 and 2035
  • Figure 34: Western Europe Market Value Share and BPS Analysis by Number of Personnel , 2025 and 2035
  • Figure 35: Western Europe Market Y to o to Y Growth Comparison by Number of Personnel , 2025-2035
  • Figure 36: Western Europe Market Attractiveness Analysis by Number of Personnel
  • Figure 37: Western Europe Market Value Share and BPS Analysis by Application, 2025 and 2035
  • Figure 38: Western Europe Market Y to o to Y Growth Comparison by Application, 2025-2035
  • Figure 39: Western Europe Market Attractiveness Analysis by Application
  • Figure 40: Eastern Europe Market Value Share and BPS Analysis by Country, 2025 and 2035
  • Figure 41: Eastern Europe Market Value Share and BPS Analysis by Number of Personnel , 2025 and 2035
  • Figure 42: Eastern Europe Market Y to o to Y Growth Comparison by Number of Personnel , 2025-2035
  • Figure 43: Eastern Europe Market Attractiveness Analysis by Number of Personnel
  • Figure 44: Eastern Europe Market Value Share and BPS Analysis by Application, 2025 and 2035
  • Figure 45: Eastern Europe Market Y to o to Y Growth Comparison by Application, 2025-2035
  • Figure 46: Eastern Europe Market Attractiveness Analysis by Application
  • Figure 47: East Asia Market Value Share and BPS Analysis by Country, 2025 and 2035
  • Figure 48: East Asia Market Value Share and BPS Analysis by Number of Personnel , 2025 and 2035
  • Figure 49: East Asia Market Y to o to Y Growth Comparison by Number of Personnel , 2025-2035
  • Figure 50: East Asia Market Attractiveness Analysis by Number of Personnel
  • Figure 51: East Asia Market Value Share and BPS Analysis by Application, 2025 and 2035
  • Figure 52: East Asia Market Y to o to Y Growth Comparison by Application, 2025-2035
  • Figure 53: East Asia Market Attractiveness Analysis by Application
  • Figure 54: South Asia and Pacific Market Value Share and BPS Analysis by Country, 2025 and 2035
  • Figure 55: South Asia and Pacific Market Value Share and BPS Analysis by Number of Personnel , 2025 and 2035
  • Figure 56: South Asia and Pacific Market Y to o to Y Growth Comparison by Number of Personnel , 2025-2035
  • Figure 57: South Asia and Pacific Market Attractiveness Analysis by Number of Personnel
  • Figure 58: South Asia and Pacific Market Value Share and BPS Analysis by Application, 2025 and 2035
  • Figure 59: South Asia and Pacific Market Y to o to Y Growth Comparison by Application, 2025-2035
  • Figure 60: South Asia and Pacific Market Attractiveness Analysis by Application
  • Figure 61: Middle East & Africa Market Value Share and BPS Analysis by Country, 2025 and 2035
  • Figure 62: Middle East & Africa Market Value Share and BPS Analysis by Number of Personnel , 2025 and 2035
  • Figure 63: Middle East & Africa Market Y to o to Y Growth Comparison by Number of Personnel , 2025-2035
  • Figure 64: Middle East & Africa Market Attractiveness Analysis by Number of Personnel
  • Figure 65: Middle East & Africa Market Value Share and BPS Analysis by Application, 2025 and 2035
  • Figure 66: Middle East & Africa Market Y to o to Y Growth Comparison by Application, 2025-2035
  • Figure 67: Middle East & Africa Market Attractiveness Analysis by Application
  • Figure 68: Global Market - Tier Structure Analysis
  • Figure 69: Global Market - Company Share Analysis
Dashboard
Dashboard
Dashboard
Dashboard
Dashboard
Dashboard

Full Research Suite comprises of:

Market outlook & trends analysis

Market outlook & trends analysis

Interviews & case studies

Interviews & case studies

Strategic recommendations

Strategic recommendations

Vendor profiles & capabilities analysis

Vendor profiles & capabilities analysis

5-year forecasts

5-year forecasts

8 regions and 60+ country-level data splits

8 regions and 60+ country-level data splits

Market segment data splits

Market segment data splits

12 months of continuous data updates

12 months of continuous data updates

DELIVERED AS:

PDF EXCEL ONLINE

Full Research Suite


$5000

$7500

$10000

Buy Report Now
Similar Industry Reports

Similar Industry Reports

Walk-in Cooler & Freezer Industry Analysis in Latin America

Walk-in Cooler & Freezer Industry Analysis in Latin America Size and Share Forecast Outlook 2025 to 2035

Walk-in Coolers and Freezers Market

Walk-in Coolers and Freezers Market Size and Share Forecast Outlook 2025 to 2035

Walkie Talkie Market

Walkie Talkie Market Size and Share Forecast Outlook 2025 to 2035

Walkie Stackers Market

Walkie Stackers Market Size and Share Forecast Outlook 2025 to 2035

Walking Aid Market
Walking Aid Market

Walking Aid Market Analysis by Product, Technology, End-user, and Region 2025 to 2035

Walk-in Services Market

Walk-in Services Market Growth – Trends & Forecast 2024-2034

Walk-In Cooler and Freezer Industry Analysis in North America

Walk-In Cooler and Freezer Market Growth – Trends & Forecast 2024-2034

Walk Through Metal Detector Market

Walk Through Metal Detector Market

Knee Walker Market
Knee Walker Market

Knee Walker Market Size and Share Forecast Outlook 2025 to 2035

Assisted Walking Devices Market

Assisted Walking Devices Market Size and Share Forecast Outlook 2025 to 2035

Bariatric Walking Aids Market

Bariatric Walking Aids Market Size and Share Forecast Outlook 2025 to 2035

Bariatric Walkers Market

Bariatric Walkers Market Size and Share Forecast Outlook 2025 to 2035

Commercial Walk in Freezer Market

Commercial Walk in Freezer Market Size and Share Forecast Outlook 2025 to 2035

Water-cooled Walk-in Temperature & Humidity Chamber Market

Water-cooled Walk-in Temperature & Humidity Chamber Market Size and Share Forecast Outlook 2025 to 2035

United States Walk-in Cooler and Freezer Market

United States Walk-in Cooler and Freezer Market Size and Share Forecast Outlook 2025 to 2035

USA Commercial Walk-In Refrigeration Market

USA Commercial Walk-In Refrigeration Market Size and Share Forecast Outlook 2025 to 2035

Airport Moving Walkways Market

Airport Moving Walkways Market Size and Share Forecast Outlook 2025 to 2035

Bariatric Rollator Walkers Market

Bariatric Rollator Walkers Market Size and Share Forecast Outlook 2025 to 2035

Escalators And Moving Walkways Market

Escalators And Moving Walkways Market Size and Share Forecast Outlook 2025 to 2035

Through-Type Shelves Market

Through-Type Shelves Market Size and Share Forecast Outlook 2025 to 2035

Future Market Insights

Walk Through Air Shower Market

Chat With MaRIA

Chat With

MaRIA

Hi There, I am MaRIA, Your Market Research Intelligence Assistant. How may I help you?