


Bakery Ingredients Market : Global Industry Analysis and Opportunity Assessment, 2036
The Bakery Ingredients Market is segmented by Product (Flour, Sweeteners, Fats and Oils, Leavening Agents, Additives and Improvers), Application (Bread, Cakes and Pastries, Biscuits and Cookies, Others), End Use (Commercial Bakeries, Household, Foodservice Industry), Distribution Channel (Direct Sales, Retail Distribution, Online Platforms), Formulation (Conventional Ingredients, Organic Ingredients, Clean Label Ingredients), and Region. Forecast for 2026 to 2036.
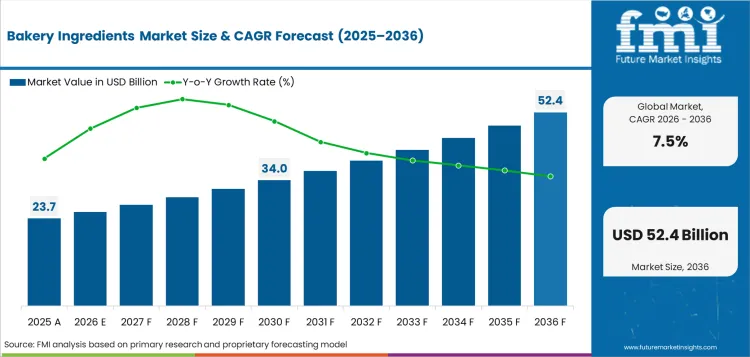
- Market Size (2026): USD 25.4 Bn
- Forecast (2036): USD 52.4 Bn
- CAGR (2026 to 2036): 7.5%
Bakery Ingredients Market Size, Market Forecast and Outlook By FMI
The bakery ingredients market was valued at USD 23.7 billion in 2025. Market value is forecast to reach USD 25.4 billion in 2026 and expand at a CAGR of 7.5% between 2026 and 2036 to reach USD 52.4 billion by 2036. Conventional ingredients are expected to lead with a 65.0% formulation share, and commercial bakeries are estimated to lead the end-use segment with a 60.0% share.
Summary of the Bakery Ingredients Market
- Demand and Growth Drivers
- Packaged bread production is promoting the demand for flour and improvers as bakeries need repeat dough behavior across daily batches.
- Industrial bakery plants increase use of direct sales contracts as bulk input timing affects line planning.
- Foodservice bakery demand adds volume for pastry fats and sweeteners across hotels and quick-service formats.
- Product and Segment View
- Flour is expected to hold 50.0% share in 2026 as bread and pizza bases rely on stable dough strength.
- Packaged loaf production places bread at 45.0% share in 2026, since repeat batches require consistent flour behavior.
- Commercial bakeries are projected to account for 60.0% of end-use share in 2026 as industrial plants plan larger ingredient volumes.
- Geography and Competitive Outlook
- India is expected to record an 8.5% CAGR through 2036, due to broader packaged bakery output across urban retail chains.
- France’s bakery ingredients market is projected to expand at 8.0% CAGR over the forecast period as artisan bakeries and industrial plants continue using flour systems.
- Companies combining bulk ingredient reach with bakery formulation support are building account share during the forecast period.
- Analyst Opinion
- Nandini Roy Choudhury, Principal Analyst at FMI, says, “Bakery ingredients now serve as production control inputs for bakeries seeking stable texture and fewer batch losses. Flour consistency guides formulation planning as wheat quality and direct supply terms shape longer contracts because sugar pricing pressure affects recipe discipline decisions.”
- Bakery Ingredients Market Value Analysis
- The bakery ingredients market has shifted from a basic input supply to a structured formulation base for industrial bakeries.
- Bakeries are using structured ingredient systems to keep bread quality consistent and reduce mixing corrections in high-volume production.
- Commercial plants are using more bakery mixes to simplify dosing and reduce handling errors during production.
- Ingredient producers with flour testing and enzyme skills can help bakeries protect texture across larger production runs.
Bakery manufacturers are trying to protect softness, label accuracy and margin while consumers remain sensitive to taste and price. Enzyme systems are gaining importance because dsm-firmenich positions BakeZyme Master for freshness, resilience and foldability in breads, sandwiches and wraps. That helps producers reduce quality loss during distribution. Broader formulation support also matters because the same company offers enzymes, flavor modulation, preservation and fortification tools for bakery applications. Allergen control creates a separate pressure point.
The United States Food and Drug Administration’s April 2024 sesame guidance confirms sesame as the ninth major allergen with packaged food labeling requirements. Bakery plants therefore need stronger ingredient segregation and packaging checks. Kerry’s 2024 Annual Report shows why technical support is a buying factor because the company reports more than 1,200 food scientists. Ingredient suppliers with application labs, enzyme depth and allergen-aware formulation support are better placed with industrial bakers.
Bakery Ingredients Market Definition
The bakery ingredients market includes commercially traded inputs used to make bread, cakes, pastries, biscuits and frozen bakery products. Scope includes flour, sweeteners, fats, yeast, emulsifiers and bakery enzymes sold into bakery formulation. Finished bakery products, bakery machinery and café service revenue are outside the scope.
Bakery Ingredients Market Inclusions
Market scope covers all commercially traded bakery ingredient products categorized by product type, including flour, sweeteners, fats and oils, leavening agents, and additives and improvers; applications, including bread, cakes and pastries, biscuits and cookies, and other bakery products; end users, including commercial bakeries, household users, and foodservice operators; distribution channels, including direct sales, retail distribution, and online platforms; and formulation types, including conventional ingredients, organic ingredients, and clean label ingredients. Revenue scope covers 2026 to 2036. Stakeholders include bakery ingredient manufacturers, flour millers, sweetener suppliers, fat and oil producers, yeast and enzyme providers, commercial bakery operators, foodservice companies, retail distributors, online ingredient sellers, packaging partners, food safety authorities, and industry certification bodies.
Bakery Ingredients Market Exclusions
Scope does not include finished bakery goods, restaurant bakery sales, bakery machinery, café services or non-bakery food ingredients.
Bakery Ingredients Market Research Methodology
- Primary Research: FMI analysts talked to flour mills, bakery ingredient producers and commercial bakery operators in major markets.
- Desk Research: Analysis combined crop output data, milling records, company product portfolios and bakery application references.
- Market sizing and forecasting: The model added ingredient use across bakery applications and checked the result against country-level demand patterns.
- Data validation: Forecasts were cross-checked against flour production, packaged bakery demand and active company portfolios.
Why is the Bakery Ingredients Market Growing?
- Industrial bakeries are using standardized ingredients earlier to reduce recipe variation before full-scale production begins. Ingredient partners now support supplier choice as bakery recipes combine flour systems with enzymes and texture aids.
- Manufacturers are choosing direct ingredient contracts to protect plant scheduling and avoid repeat line adjustments.
Commercial bakeries need stronger control over flour performance as bread lines run frequent production cycles. USDA NASS reported total flour production of 419 million hundredweight in its May 2026 annual summary. High flour volumes keep mills focused on grade discipline and batch behavior. Bakery plants gain when flour lots reduce hydration changes during mixing. Demand for whole-wheat flour adds another quality requirement across packaged bread lines.
Bread producers are adding improvers and enzyme systems to protect softness across distribution cycles. Cubease is a concentrated improver dosed for 10 kg of flour, as stated by Puratos in May 2025. Pre-dosed formats reduce weighing errors for small bakeries and improve handling in larger plants. Ingredient makers with accurate dosing formats can sell process control along with raw material supply. Food enzymes remain under review as bakeries review label and texture goals together.
Market Segmentation Analysis
- Flour is estimated to represent 50.0% of product value in 2026 as bread and pizza bases need dependable dough strength.
- Packaged loaf production places bread at 45.0% of application use in 2026 as repeat baking cycles require stable flour behavior.
- Commercial bakeries are projected to contribute 60.0% of end-use share in 2026 as industrial plants buy ingredients in larger planned volumes.
- Direct sales are estimated to hold 55.0% of channel revenue in 2026 since large bakeries need tighter delivery control.
- Cost-sensitive plant operations place conventional ingredients at 65.0% of formulation share in 2026 as refined inputs are easier to source at scale.
Bakery ingredients are divided into five primary segment groups based on product, application, end use, distribution channel and formulation. Product includes flour, sweeteners, fats and oils, leavening agents, additives and improvers. Application includes bread, cakes and pastries, biscuits and cookies, and others. End use includes commercial bakeries, household, and the foodservice industry. Distribution channel includes direct sales, retail distribution, and online platforms. Formulation includes conventional ingredients, organic ingredients, and clean label ingredients.
Insights into the Flour Product Segment
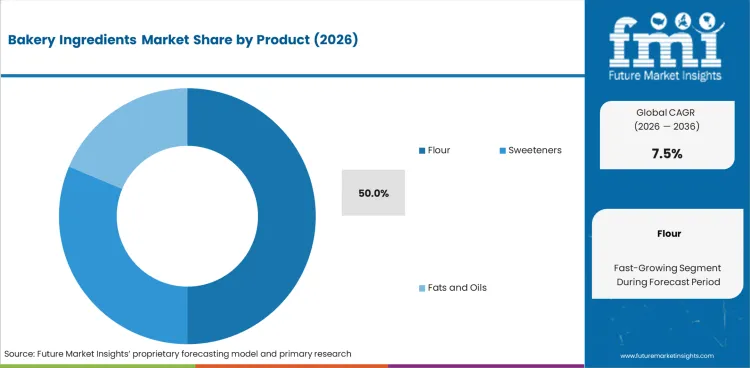
- In 2026, flour is estimated to make up 50.0% of the product segment. Wheat flour products support bread and pizza bases by providing dough strength for consistent baking results. Cakes and biscuits use flour systems to manage texture reliably across repeated daily production runs.
- Bread flour and all-purpose flour address high-volume bakery needs. Their value improves in recipes requiring predictable absorption, stable mixing behavior, and controlled crumb structure.
Insights into the Bread Application Segment
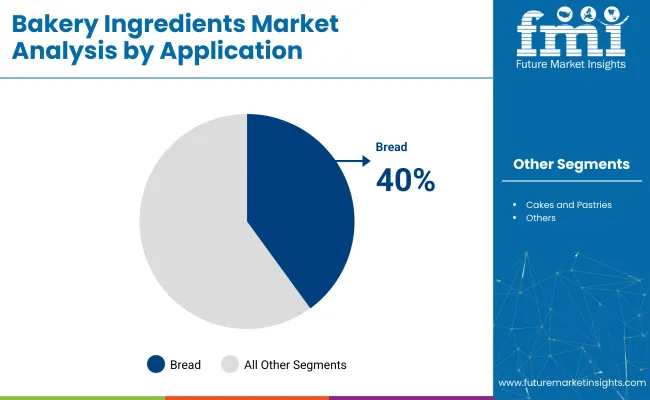
- Bread is expected to hold 45.0% of the application segment in 2026. Packaged loaves and sandwich bread require consistent flour quality and improver control across repeat production cycles.
- Cakes and pastries serve higher-value bakery occasions. Fats and sweeteners see stronger use in premium retail bakery formats as product quality expectations increase.
Insights into the Commercial Bakeries End Use Segment
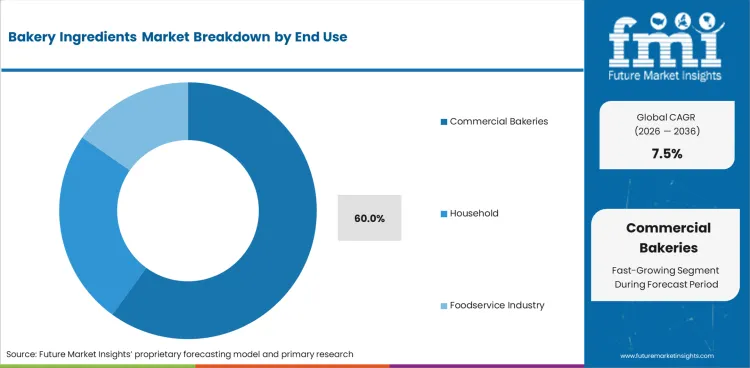
- In 2026, commercial bakeries are projected to contribute 60.0% share of the end-use segment. Industrial and automated facilities require stable ingredient performance to reduce line disruption and batch loss.
- Household baking and foodservice channels address smaller-volume ingredient needs. Retail packs and bakery mixes help increase demand across smaller buying channels and home baking users. Ready-to-use ingredient formats add convenience for foodservice buyers and occasional bakers.
Insights into the Direct Sales Distribution Channel Segment
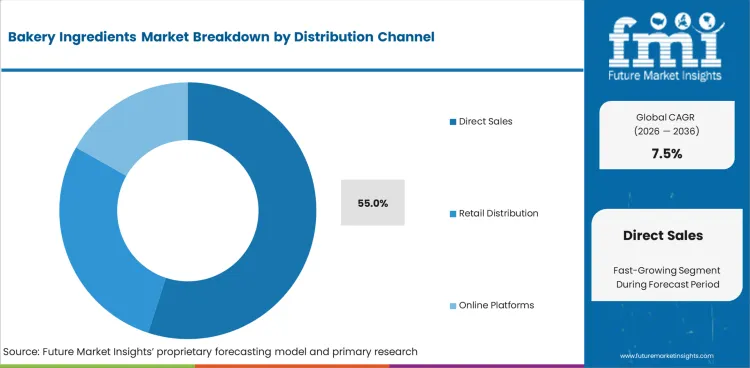
- In 2026, direct sales are forecast to hold 55.0% of the distribution channel segment. Large bakery operators prefer direct sourcing for bulk supply control and technical formulation support.
- Retail distribution favors smaller bakeries and home baking users. Online platforms serve repeat orders when buyers need faster access to specialty ingredients and smaller pack sizes.
Insights into the Conventional Ingredients Formulation Segment
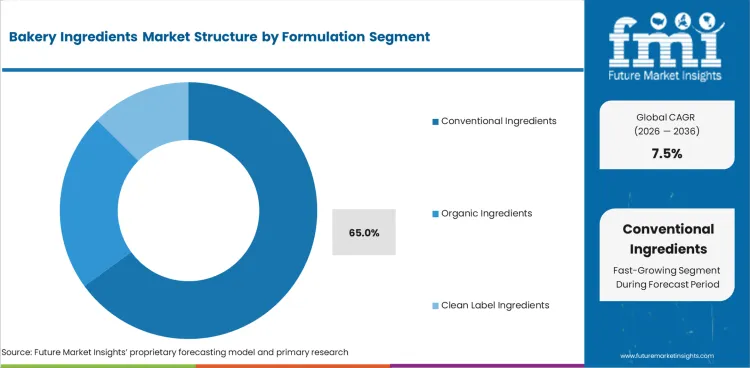
- In 2026, conventional ingredients are projected to account for 65.0% of the formulation segment. Mainstream bakeries use refined flour and processed sugar to control cost. Standard fats help keep recipes consistent across repeated bakery production runs.
- Organic and clean label options address selected premium bakery needs. Value improves in branded bread and specialty pastries using simpler ingredient declarations. Retail products benefit as simpler labels make ingredient choices easier for consumers.
Bakery Ingredients Market Drivers, Restraints, and Opportunities
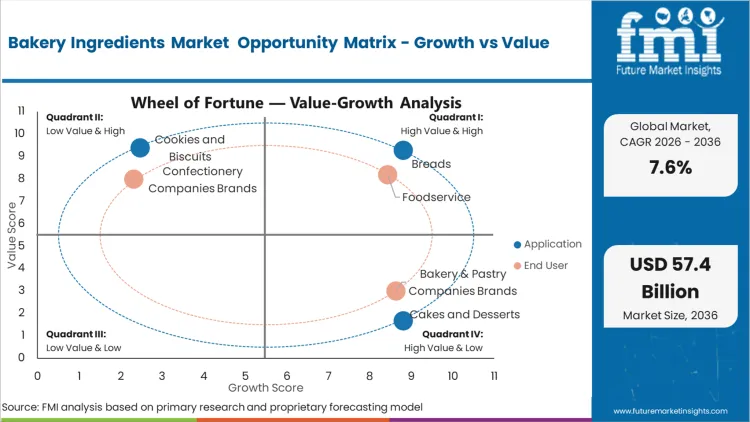
- Bread line standardization raises planned demand for flour, yeast and improvers across commercial bakeries.
- Wheat quality variation increases pricing pressure for bakeries that need stable flour behavior across recipes.
- Clean label reformulation improves opportunity for enzyme systems and sourdough ingredients in premium bread.
Commercial-bakery ingredient demand keeps expanding as packaged bread and foodservice outlets need stable flour performance. Cost pressure from wheat quality and sugar pricing can slow upgrades toward premium formulations across bakery plants. Expansion continues through direct supply contracts and improver systems used in high-volume production across industrial bakeries.
Flour, Egg and Dairy Inputs Are Moving Apart
Bakery ingredient pricing is entering a split cycle instead of a uniform inflation cycle. Farm-level wheat prices fell 10.9% in 2025 after drops of 23.1% in 2023 and 22.3% in 2024, but are predicted to rise 8.4% in 2026, as reported by USDA ERS. Flour buyers may see less benefit from earlier grain-price deflation as replacement contracts reset. Farm-level egg prices are predicted to decrease 73.0% in 2026. Farm-level milk prices are predicted to decrease 17.9%. For bakery ingredient suppliers, these price moves broaden pricing room for egg-based mixes and dairy-containing premixes, and flour-heavy formulations may face renewed cost pass-through pressure.
Sugar Availability Is Capping Some Price Upside
Sugar pricing directly affects sweet bakery mixes and fillings across industrial bakery formulations. Glazes and icings require cost control as bakery producers protect margin across repeat production runs. In April 2026, USDA ERS forecast U.S. 2025/26 sugar supply at 14.269 million short tons raw value, up 71,000 STRV from the previous month.
Human-consumption deliveries were raised 94,000 STRV to 12.259 million, while ending stocks were nearly unchanged at 1.880 million STRV and the stocks-to-use ratio held at 15.2%. The outlook signals firm bakery demand. The report does not indicate a shortage-led pricing shock. Ingredient buyers should watch refined sugar contracts closely because Mexico’s production was raised 101,000 MT to 5.125 million MT, influencing export availability and regional sweetener pricing.
Analysis of Bakery Ingredients Market By Key Countries
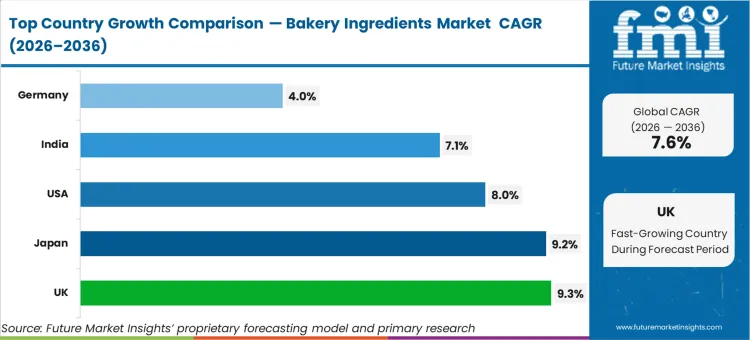
.webp "Top Country Growth Comparison Bakery Ingredients Market Cagr (2026 2036)")
| Country | CAGR |
|---|---|
| India | 8.5% |
| France | 8.0% |
| China | 7.8% |
| Brazil | 7.2% |
| Japan | 6.5% |
| Germany | 5.9% |
| USA | 4.8% |
Source: Future Market Insights, 2026.
Bakery Ingredients Market CAGR Analysis By Country
- India leads the country outlook with an 8.5% CAGR through 2036, supported by packaged bakery output and foodservice expansion.
- France is projected at 8.0% CAGR over the forecast period as bread culture and wheat availability strengthen flour processor demand.
- China is estimated to record an 7.8% CAGR outlook as industrial bakery plants increase recipe control and ingredient standardization.
- Brazil’s estimated 7.2% CAGR points to steady bakery flour use and wheat supply exposure across commercial baking channels.
- Japan is forecast to expand at 6.5% CAGR as premium bakery formats require controlled flour sourcing and consistent ingredient quality.
- Germany is predicted to grow at 5.9% CAGR and the USA is expected to grow at 4.8% CAGR, indicating mature bakery bases with slower percentage expansion.
Demand for bakery ingredients is forecast to rise at 7.5% CAGR from 2026 to 2036. Country-level analysis covers the major markets contributing to this forecast, with major markets listed below.
Demand Outlook for Bakery Ingredients Market in India
India’s bakery ingredients industry is projected to record a CAGR of 8.5% through 2036. India produced 117.94 million tonnes of wheat during agricultural year 2024 to 2025. India’s wheat base strengthens demand for India bakery ingredients across packaged bread and biscuit plants. Local mills can gain from bakery manufacturers that need credible flour grades before larger supply contracts.
- Local wheat output strengthens flour availability for industrial bread and biscuit production.
- Urban bakery chains need stable ingredient quality across packaged bread and café formats.
- Commercial bakeries need direct ingredient contracts to reduce line stoppage and recipe rework.
Sales Analysis of Bakery Ingredients Market in France
The bakery ingredients sector in France is expected to expand at a CAGR of 8.0% during the assessment period. France’s agriculture ministry estimated 2025 soft wheat production at 32.6 million tonnes. France’s wheat recovery improves flour availability for France bakery ingredients across bread and viennoiserie formats. Ingredient producers benefit from artisan and industrial bakeries seeking stable flour behavior.
- Strong bread culture sustains demand for flour, yeast and improvers across regional bakeries.
- Industrial bakeries need flour systems to protect baguette texture in scaled production.
- Premium bakery formats raise interest in baking ingredients with better texture control.
Demand Outlook for Bakery Ingredients Market in China
The China bakery ingredients industry is forecast to grow at a CAGR of 7.8% by 2036. China’s cereal production base strengthens flour and starch availability for bakery ingredient use. Cereal output helps commercial bakeries secure inputs for bread, snacks and other starch-based bakery formats. Commercial plants value ingredient systems that can reduce variation across regional production sites.
- Industrial bakeries need repeat flour and improver behavior across multi-city production sites.
- Packaged bread and bakery snacks create stronger use of emulsifiers and enzyme systems.
- Processed food expansion lifts demand for food coating ingredients around bakery applications.
Opportunity Analysis of Bakery Ingredients Market in Brazil
The bakery ingredients segment in Brazil is forecast to advance at 7.2% CAGR over the forecast years. Conab projected Brazil’s 2025 wheat production at 7.7 million tonnes in October 2025. Domestic supply conditions keep Brazil bakery ingredients exposed to flour quality and import cost movement. Ingredient producers with blending skill can help bakeries manage wheat variation across bread lines.
- Paraná and Rio Grande do Sul are important wheat areas for bakery flour supply.
- São Paulo bakery networks use direct ingredient supply for bread and pastry production.
- Import-sensitive wheat pricing raises the value of formulation support for commercial bakeries.
Future Outlook for Bakery Ingredients Market in Japan
The Japan bakery ingredients industry is expected to post 6.5% CAGR through 2036. FAS Tokyo estimated Japan’s MY2024 to 2025 wheat production at 1.08 million tons. Limited domestic wheat output reinforces the need for careful flour sourcing across Japan bakery ingredients. Ingredient producers need dependable grades for soft bread and convenience-store bakery formats.
- Hokkaido wheat quality influences selected premium bread and pastry formats.
- Convenience stores need stable bread texture across frequent replenishment cycles.
- Import wheat controls keep flour cost and quality central to bakery ingredient selection.
Demand Outlook for Bakery Ingredients Market in Germany
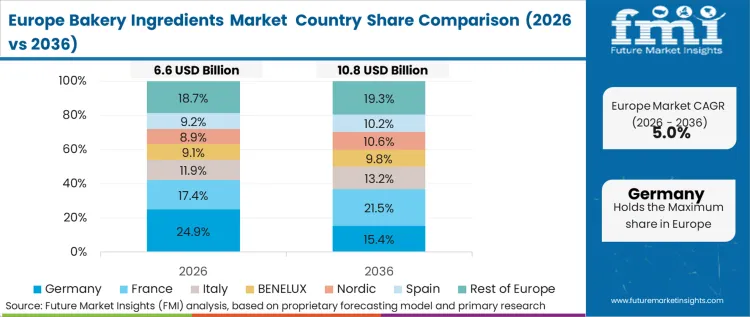
Germany’s bakery ingredients market is projected to expand at 5.9% CAGR during the assessment period. German food retail sales reached USD 293.1 billion in 2024. Germany’s retail base sustains demand for Germany bakery ingredients across packaged bread and private-label bakery lines. Ingredient producers need cost control and texture support to serve discounters and premium bakeries together.
- Private-label bread ranges keep ingredient pricing discipline high across large retail contracts.
- Bakery chains need dependable flour grades for packaged bread and rolls.
- Premium formats create demand for bread emulsifier systems in selected product lines.
In-depth Analysis of Bakery Ingredients Market in the USA
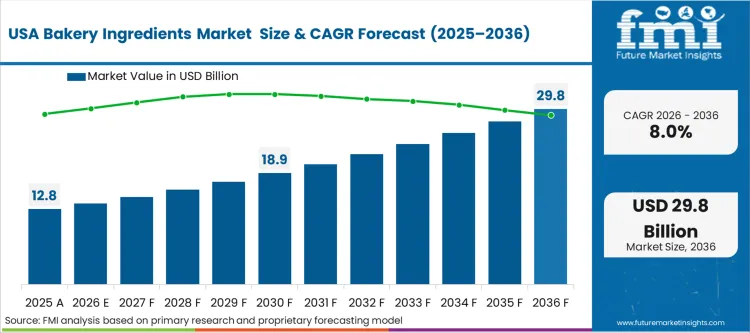
The USA bakery ingredients industry is expected to expand at 4.8% CAGR by 2036. USDA NASS reported all wheat ground for flour at 907 million bushels in 2025. Milling scale keeps USA bakery ingredients demand large, although percentage expansion is more controlled. Ingredient producers gain through mix systems and improvers used in packaged bread and snack bakery.
- Midwest flour mills serve major packaged bread and snack bakery plants.
- California and Texas foodservice channels raise steady demand for frozen bakery inputs.
- Mature flour milling keeps packaged bread ingredient demand stable.
Competitive Landscape and Strategic Positioning
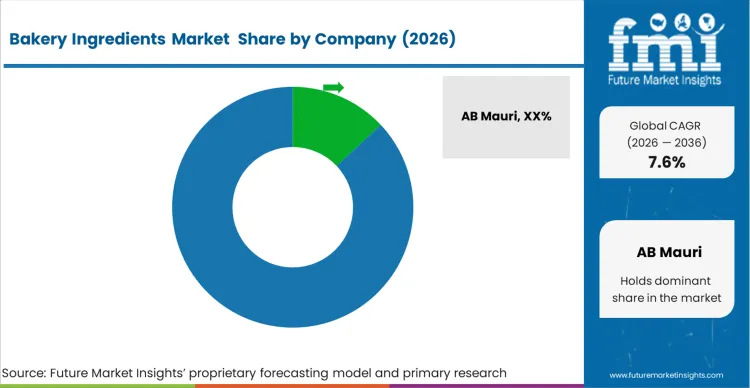
Bakery Ingredients Market Analysis By Company
Bakery ingredient competition is shaped by companies combining broad input portfolios with dependable supply for commercial bakeries. Large suppliers compete on ingredient breadth and plant-level formulation help. Specialist providers focus on improvers and sourdough systems used in bakery-specific recipes.
- Cargill Inc. leads through broad bakery ingredient coverage and strong bulk supply reach for industrial bakery customers.
- DuPont de Nemours and Company operates in enzyme systems and texture solutions used in bread and pastry applications.
- Specialist providers focus on improvers and sourdough systems for bakeries needing recipe-specific performance and shelf-life control.
Cargill Inc. holds a strong role through oils and starches used across bakery ingredient systems. Archer Daniels Midland and Ingredion Inc. serve commercial bakeries through broad ingredient portfolios and dependable supply networks. Tate & Lyle PLC and dsm-firmenich offer sweeteners and nutrition inputs used in bakery formulation work.
Raw material price swings create pressure across flour and sweetener planning for high-volume bakery plants. Strict quality needs also raise the value of flour testing and faster technical response under long bakery contracts. Ingredient partners with performance records and scale-up help are better placed to win repeat business from manufacturers.
Key Companies in the Bakery Ingredients Market
Global companies active in the bakery ingredients market include:
Cargill Inc., Archer Daniels Midland and Ingredion Inc. have strong ingredient infrastructure for bulk supply and bakery formulation. DuPont de Nemours and Company, dsm-firmenich and Novonesis A/S serve manufacturers through enzyme depth and texture systems.
Puratos Group N.V., Corbion N.V. and Associated British Foods hold specialist positions across improvers, preservation inputs and bakery systems.
Competitive Benchmarking: Bakery Ingredients Market
| Company | Bakery Formulation Depth | Bulk Supply Reach | Technical Bakery Support | Geographic Footprint |
|---|---|---|---|---|
| Cargill Inc. | High | Strong | Strong | Global |
| DuPont de Nemours and Company | High | Medium | Strong | Global |
| Archer Daniels Midland | High | Strong | Medium | Global |
| Ingredion Inc. | Medium | Strong | Medium | Global |
| Tate & Lyle PLC | Medium | Strong | Medium | North America and Europe |
| dsm-firmenich | High | Medium | Strong | Global |
| Associated British Foods | High | Strong | Medium | Europe and Global Select Markets |
| Corbion N.V. | High | Medium | Strong | Europe and North America |
| Novonesis A/S | High | Medium | Strong | Global |
| Puratos Group N.V. | High | Medium | Strong | Global |
Source: Future Market Insights, 2026.
Key Developments in Bakery Ingredients Market
- In March 2025, Cargill showcased bake-stable fillings and pectin alternatives at AAHAR 2025 in India. The display covered bakery and dessert applications through texture and filling solutions.
- In May 2025, Puratos introduced Cubease as a concentrated bakery improver designed for compact dosing. The product supports smaller handling needs across bakeries using pre-measured flour treatment.
Key Players in the Bakery Ingredients Market
Major Global Players:
- Cargill Inc.
- DuPont de Nemours and Company
- Archer Daniels Midland
- Ingredion Inc.
- Tate & Lyle PLC
- dsm-firmenich
- Associated British Foods
Specialist Players:
- Corbion N.V.
- Novonesis A/S
- Puratos Group N.V.
Report Scope and Coverage
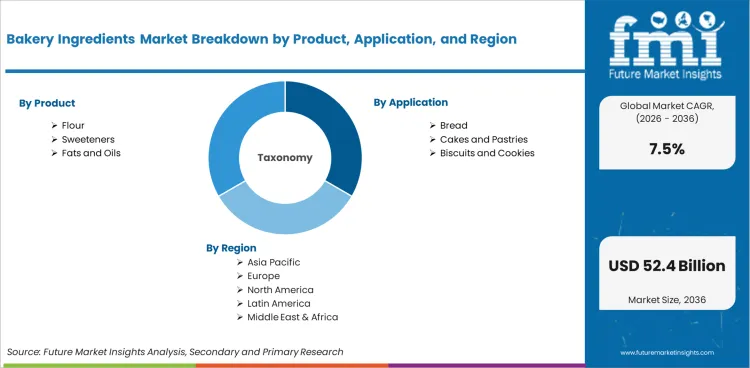
Bakery Ingredients Market Breakdown By Product, Application, End Use, Distribution Channel, Formulation And Region
| Parameter | Details |
|---|---|
| Quantitative Units | USD 25.4 billion to USD 52.4 billion, at a CAGR of 7.5% |
| Market Definition | The bakery ingredients market includes inputs used to make bread, cakes, pastries, biscuits and frozen bakery products. |
| Regions Covered | North America, Latin America, Europe, East Asia, South Asia and Pacific, Middle East and Africa |
| Countries Covered | USA, Germany, France, China, India, Japan, Brazil and 30 plus countries |
| Key Companies Profiled | Cargill Inc., DuPont de Nemours and Company, Archer Daniels Midland, Ingredion Inc., Tate & Lyle PLC, dsm-firmenich, Associated British Foods, Corbion N.V., Novonesis A/S, Puratos Group N.V. |
| Forecast Period | 2026 to 2036 |
| Approach | Hybrid bottom-up and top-down methodology starting with ingredient demand and verified bakery use patterns. |
Source: Future Market Insights, 2026.
Bakery Ingredients Market Analysis by Segments
Bakery Ingredients Market Segmented by Product:
- Flour
- Sweeteners
- Fats and Oils
- Leavening Agents
- Additives and Improvers
Bakery Ingredients Market Segmented by Application:
- Bread
- Cakes and Pastries
- Biscuits and Cookies
- Others
Bakery Ingredients Market Segmented by End Use:
- Commercial Bakeries
- Household
- Foodservice Industry
Bakery Ingredients Market Segmented by Distribution Channel:
- Direct Sales
- Retail Distribution
- Online Platforms
Bakery Ingredients Market Segmented by Formulation:
- Conventional Ingredients
- Organic Ingredients
- Clean Label Ingredients
Bakery Ingredients Market by Region:
- North America
- USA
- Canada
- Mexico
- Latin America
- Brazil
- Chile
- Rest of Latin America
- Europe
- Germany
- UK
- Italy
- Spain
- France
- Rest of Europe
- East Asia
- China
- Japan
- South Korea
- South Asia and Pacific
- India
- ASEAN
- Australia & New Zealand
- Rest of South Asia and Pacific
- Middle East and Africa
- Saudi Arabia
- Other GCC Countries
- South Africa
- Rest of Middle East and Africa
Research Sources and Bibliography
- Puratos. (2025, May). Puratos brings a trio of transformative innovations to iba 2025.
- USDA National Agricultural Statistics Service. (2026, May). Flour milling products 2025 summary. USA Department of Agriculture.
- Press Information Bureau. (2026, April). India’s resilient production systems in agriculture. Government of India.
- Agreste. (2025, July 15). Grandes cultures. Avec des rendements en hausse, la production céréalière française se redresse en 2025. Ministère de l’Agriculture et de la Souveraineté alimentaire.
USDA Foreign Agricultural Service. (2024, September). Grain and feed update: Japan. USA Department of Agriculture. - USDA Foreign Agricultural Service. (2025, September). Germany: Retail foods annual. USA Department of Agriculture.
- Eurostat. (2025). Industrial production statistics. European Commission.
Companhia Nacional de Abastecimento. (2025, October 14). Primeiro levantamento da Conab aponta para uma colheita de 354,7 milhões de toneladas de grãos na safra 2025/26. Governo Federal do Brasil.
This Report Addresses
- What is the current and future size of the bakery ingredients market?
- How fast is the bakery ingredients market expected to expand between 2026 and 2036?
- Which product segment is expected to lead the market by 2026?
- Which application segment is expected to account for the most demand by 2026?
- What factors are driving demand for bakery ingredients globally?
- How are industrial bakeries influencing direct ingredient contracts?
- Why are conventional ingredients the main formulation base for bakery producers?
- How are flour quality needs creating demand for technical ingredient support?
- Which countries are projected to record faster expansion through 2036?
- What is driving market expansion in India and France?
- Who are the key companies active in the bakery ingredients market?
- How does FMI estimate and validate the market forecast?
Frequently Asked Questions
What is the global market demand for Bakery Ingredients in 2026?
In 2026, the global market for bakery ingredients is expected to be worth USD 25.4 billion.
How big will the market for Bakery Ingredients be in 2036?
By 2036, the market for bakery ingredients is expected to be worth USD 52.4 billion.
How much is demand for Bakery Ingredients expected to expand between 2026 and 2036?
Between 2026 and 2036, demand for bakery ingredients is expected to expand at a CAGR of 7.5%.
Which product segment is likely to be the leading category globally by 2026?
Flour will make up 50.0% of the product segment in 2026.
What supports demand growth in India?
The India bakery ingredients market is projected to record 8.5% CAGR through 2036, supported by packaged bakery output and wheat availability.
What supports demand growth in France?
The France bakery ingredients market is projected to expand at 8.0% CAGR through 2036, supported by bread culture and flour supply recovery.
What does this report mean by bakery ingredients market definition?
The bakery ingredients market includes flour, sweeteners, fats, yeast, emulsifiers and enzymes used in baked product formulation.
How does FMI make the bakery ingredients forecast and check it?
Forecasting models use a hybrid bottom-up and top-down approach, starting with ingredient demand and checking it against bakery use patterns.
Table of Content
- Executive Summary
- Global Market Outlook
- Demand-side Trends
- Supply-side Trends
- Technology Roadmap Analysis
- Analysis and Recommendations
- Market Overview
- Market Coverage / Taxonomy
- Market Definition / Scope / Limitations
- Research Methodology
- Chapter Orientation
- Analytical Lens and Working Hypotheses
- Market Structure, Signals, and Trend Drivers
- Benchmarking and Cross-market Comparability
- Market Sizing, Forecasting, and Opportunity Mapping
- Research Design and Evidence Framework
- Desk Research Programme (Secondary Evidence)
- Company Annual and Sustainability Reports
- Peer-reviewed Journals and Academic Literature
- Corporate Websites, Product Literature, and Technical Notes
- Earnings Decks and Investor Briefings
- Statutory Filings and Regulatory Disclosures
- Technical White Papers and Standards Notes
- Trade Journals, Industry Magazines, and Analyst Briefs
- Conference Proceedings, Webinars, and Seminar Materials
- Government Statistics Portals and Public Data Releases
- Press Releases and Reputable Media Coverage
- Specialist Newsletters and Curated Briefings
- Sector Databases and Reference Repositories
- FMI Internal Proprietary Databases and Historical Market Datasets
- Subscription Datasets and Paid Sources
- Social Channels, Communities, and Digital Listening Inputs
- Additional Desk Sources
- Expert Input and Fieldwork (Primary Evidence)
- Primary Modes
- Qualitative Interviews and Expert Elicitation
- Quantitative Surveys and Structured Data Capture
- Blended Approach
- Why Primary Evidence is Used
- Field Techniques
- Interviews
- Surveys
- Focus Groups
- Observational and In-context Research
- Social and Community Interactions
- Stakeholder Universe Engaged
- C-suite Leaders
- Board Members
- Presidents and Vice Presidents
- R&D and Innovation Heads
- Technical Specialists
- Domain Subject-matter Experts
- Scientists
- Physicians and Other Healthcare Professionals
- Governance, Ethics, and Data Stewardship
- Research Ethics
- Data Integrity and Handling
- Primary Modes
- Tooling, Models, and Reference Databases
- Desk Research Programme (Secondary Evidence)
- Data Engineering and Model Build
- Data Acquisition and Ingestion
- Cleaning, Normalisation, and Verification
- Synthesis, Triangulation, and Analysis
- Quality Assurance and Audit Trail
- Market Background
- Market Dynamics
- Drivers
- Restraints
- Opportunity
- Trends
- Scenario Forecast
- Demand in Optimistic Scenario
- Demand in Likely Scenario
- Demand in Conservative Scenario
- Opportunity Map Analysis
- Product Life Cycle Analysis
- Supply Chain Analysis
- Investment Feasibility Matrix
- Value Chain Analysis
- PESTLE and Porter’s Analysis
- Regulatory Landscape
- Regional Parent Market Outlook
- Production and Consumption Statistics
- Import and Export Statistics
- Market Dynamics
- Global Market Analysis 2021 to 2025 and Forecast, 2026 to 2036
- Historical Market Size Value (USD Million) Analysis, 2021 to 2025
- Current and Future Market Size Value (USD Million) Projections, 2026 to 2036
- Y-o-Y Growth Trend Analysis
- Absolute $ Opportunity Analysis
- Global Market Pricing Analysis 2021 to 2025 and Forecast 2026 to 2036
- Global Market Analysis 2021 to 2025 and Forecast 2026 to 2036, By Service Type
- Introduction / Key Findings
- Historical Market Size Value (USD Million) Analysis By Service Type , 2021 to 2025
- Current and Future Market Size Value (USD Million) Analysis and Forecast By Service Type , 2026 to 2036
- Availability Planning
- Life Limit Planning
- Lease Return Planning
- Availability Planning
- Y-o-Y Growth Trend Analysis By Service Type , 2021 to 2025
- Absolute $ Opportunity Analysis By Service Type , 2026 to 2036
- Global Market Analysis 2021 to 2025 and Forecast 2026 to 2036, By Engine Family
- Introduction / Key Findings
- Historical Market Size Value (USD Million) Analysis By Engine Family, 2021 to 2025
- Current and Future Market Size Value (USD Million) Analysis and Forecast By Engine Family, 2026 to 2036
- CFM56
- V2500
- LEAP
- CFM56
- Y-o-Y Growth Trend Analysis By Engine Family, 2021 to 2025
- Absolute $ Opportunity Analysis By Engine Family, 2026 to 2036
- Global Market Analysis 2021 to 2025 and Forecast 2026 to 2036, By Customer Type
- Introduction / Key Findings
- Historical Market Size Value (USD Million) Analysis By Customer Type, 2021 to 2025
- Current and Future Market Size Value (USD Million) Analysis and Forecast By Customer Type, 2026 to 2036
- Airlines
- Lessors
- MRO Shops
- Airlines
- Y-o-Y Growth Trend Analysis By Customer Type, 2021 to 2025
- Absolute $ Opportunity Analysis By Customer Type, 2026 to 2036
- Global Market Analysis 2021 to 2025 and Forecast 2026 to 2036, By Aircraft Platform
- Introduction / Key Findings
- Historical Market Size Value (USD Million) Analysis By Aircraft Platform, 2021 to 2025
- Current and Future Market Size Value (USD Million) Analysis and Forecast By Aircraft Platform, 2026 to 2036
- Narrowbody Aircraft
- Widebody
- Regional Jet
- Narrowbody Aircraft
- Y-o-Y Growth Trend Analysis By Aircraft Platform, 2021 to 2025
- Absolute $ Opportunity Analysis By Aircraft Platform, 2026 to 2036
- Global Market Analysis 2021 to 2025 and Forecast 2026 to 2036, By Delivery Model
- Introduction / Key Findings
- Historical Market Size Value (USD Million) Analysis By Delivery Model, 2021 to 2025
- Current and Future Market Size Value (USD Million) Analysis and Forecast By Delivery Model, 2026 to 2036
- Managed Service
- Advisory Service
- Digital Monitoring
- Managed Service
- Y-o-Y Growth Trend Analysis By Delivery Model, 2021 to 2025
- Absolute $ Opportunity Analysis By Delivery Model, 2026 to 2036
- Global Market Analysis 2021 to 2025 and Forecast 2026 to 2036, By Region
- Introduction
- Historical Market Size Value (USD Million) Analysis By Region, 2021 to 2025
- Current Market Size Value (USD Million) Analysis and Forecast By Region, 2026 to 2036
- North America
- Latin America
- Western Europe
- Eastern Europe
- East Asia
- South Asia and Pacific
- Middle East & Africa
- Market Attractiveness Analysis By Region
- North America Market Analysis 2021 to 2025 and Forecast 2026 to 2036, By Country
- Historical Market Size Value (USD Million) Trend Analysis By Market Taxonomy, 2021 to 2025
- Market Size Value (USD Million) Forecast By Market Taxonomy, 2026 to 2036
- By Country
- USA
- Canada
- Mexico
- By Service Type
- By Engine Family
- By Customer Type
- By Aircraft Platform
- By Delivery Model
- By Country
- Market Attractiveness Analysis
- By Country
- By Service Type
- By Engine Family
- By Customer Type
- By Aircraft Platform
- By Delivery Model
- Key Takeaways
- Latin America Market Analysis 2021 to 2025 and Forecast 2026 to 2036, By Country
- Historical Market Size Value (USD Million) Trend Analysis By Market Taxonomy, 2021 to 2025
- Market Size Value (USD Million) Forecast By Market Taxonomy, 2026 to 2036
- By Country
- Brazil
- Chile
- Rest of Latin America
- By Service Type
- By Engine Family
- By Customer Type
- By Aircraft Platform
- By Delivery Model
- By Country
- Market Attractiveness Analysis
- By Country
- By Service Type
- By Engine Family
- By Customer Type
- By Aircraft Platform
- By Delivery Model
- Key Takeaways
- Western Europe Market Analysis 2021 to 2025 and Forecast 2026 to 2036, By Country
- Historical Market Size Value (USD Million) Trend Analysis By Market Taxonomy, 2021 to 2025
- Market Size Value (USD Million) Forecast By Market Taxonomy, 2026 to 2036
- By Country
- Germany
- UK
- Italy
- Spain
- France
- Nordic
- BENELUX
- Rest of Western Europe
- By Service Type
- By Engine Family
- By Customer Type
- By Aircraft Platform
- By Delivery Model
- By Country
- Market Attractiveness Analysis
- By Country
- By Service Type
- By Engine Family
- By Customer Type
- By Aircraft Platform
- By Delivery Model
- Key Takeaways
- Eastern Europe Market Analysis 2021 to 2025 and Forecast 2026 to 2036, By Country
- Historical Market Size Value (USD Million) Trend Analysis By Market Taxonomy, 2021 to 2025
- Market Size Value (USD Million) Forecast By Market Taxonomy, 2026 to 2036
- By Country
- Russia
- Poland
- Hungary
- Balkan & Baltic
- Rest of Eastern Europe
- By Service Type
- By Engine Family
- By Customer Type
- By Aircraft Platform
- By Delivery Model
- By Country
- Market Attractiveness Analysis
- By Country
- By Service Type
- By Engine Family
- By Customer Type
- By Aircraft Platform
- By Delivery Model
- Key Takeaways
- East Asia Market Analysis 2021 to 2025 and Forecast 2026 to 2036, By Country
- Historical Market Size Value (USD Million) Trend Analysis By Market Taxonomy, 2021 to 2025
- Market Size Value (USD Million) Forecast By Market Taxonomy, 2026 to 2036
- By Country
- China
- Japan
- South Korea
- By Service Type
- By Engine Family
- By Customer Type
- By Aircraft Platform
- By Delivery Model
- By Country
- Market Attractiveness Analysis
- By Country
- By Service Type
- By Engine Family
- By Customer Type
- By Aircraft Platform
- By Delivery Model
- Key Takeaways
- South Asia and Pacific Market Analysis 2021 to 2025 and Forecast 2026 to 2036, By Country
- Historical Market Size Value (USD Million) Trend Analysis By Market Taxonomy, 2021 to 2025
- Market Size Value (USD Million) Forecast By Market Taxonomy, 2026 to 2036
- By Country
- India
- ASEAN
- Australia & New Zealand
- Rest of South Asia and Pacific
- By Service Type
- By Engine Family
- By Customer Type
- By Aircraft Platform
- By Delivery Model
- By Country
- Market Attractiveness Analysis
- By Country
- By Service Type
- By Engine Family
- By Customer Type
- By Aircraft Platform
- By Delivery Model
- Key Takeaways
- Middle East & Africa Market Analysis 2021 to 2025 and Forecast 2026 to 2036, By Country
- Historical Market Size Value (USD Million) Trend Analysis By Market Taxonomy, 2021 to 2025
- Market Size Value (USD Million) Forecast By Market Taxonomy, 2026 to 2036
- By Country
- Kingdom of Saudi Arabia
- Other GCC Countries
- Turkiye
- South Africa
- Other African Union
- Rest of Middle East & Africa
- By Service Type
- By Engine Family
- By Customer Type
- By Aircraft Platform
- By Delivery Model
- By Country
- Market Attractiveness Analysis
- By Country
- By Service Type
- By Engine Family
- By Customer Type
- By Aircraft Platform
- By Delivery Model
- Key Takeaways
- Key Countries Market Analysis
- USA
- Pricing Analysis
- Market Share Analysis, 2025
- By Service Type
- By Engine Family
- By Customer Type
- By Aircraft Platform
- By Delivery Model
- Canada
- Pricing Analysis
- Market Share Analysis, 2025
- By Service Type
- By Engine Family
- By Customer Type
- By Aircraft Platform
- By Delivery Model
- Mexico
- Pricing Analysis
- Market Share Analysis, 2025
- By Service Type
- By Engine Family
- By Customer Type
- By Aircraft Platform
- By Delivery Model
- Brazil
- Pricing Analysis
- Market Share Analysis, 2025
- By Service Type
- By Engine Family
- By Customer Type
- By Aircraft Platform
- By Delivery Model
- Chile
- Pricing Analysis
- Market Share Analysis, 2025
- By Service Type
- By Engine Family
- By Customer Type
- By Aircraft Platform
- By Delivery Model
- Germany
- Pricing Analysis
- Market Share Analysis, 2025
- By Service Type
- By Engine Family
- By Customer Type
- By Aircraft Platform
- By Delivery Model
- UK
- Pricing Analysis
- Market Share Analysis, 2025
- By Service Type
- By Engine Family
- By Customer Type
- By Aircraft Platform
- By Delivery Model
- Italy
- Pricing Analysis
- Market Share Analysis, 2025
- By Service Type
- By Engine Family
- By Customer Type
- By Aircraft Platform
- By Delivery Model
- Spain
- Pricing Analysis
- Market Share Analysis, 2025
- By Service Type
- By Engine Family
- By Customer Type
- By Aircraft Platform
- By Delivery Model
- France
- Pricing Analysis
- Market Share Analysis, 2025
- By Service Type
- By Engine Family
- By Customer Type
- By Aircraft Platform
- By Delivery Model
- India
- Pricing Analysis
- Market Share Analysis, 2025
- By Service Type
- By Engine Family
- By Customer Type
- By Aircraft Platform
- By Delivery Model
- ASEAN
- Pricing Analysis
- Market Share Analysis, 2025
- By Service Type
- By Engine Family
- By Customer Type
- By Aircraft Platform
- By Delivery Model
- Australia & New Zealand
- Pricing Analysis
- Market Share Analysis, 2025
- By Service Type
- By Engine Family
- By Customer Type
- By Aircraft Platform
- By Delivery Model
- China
- Pricing Analysis
- Market Share Analysis, 2025
- By Service Type
- By Engine Family
- By Customer Type
- By Aircraft Platform
- By Delivery Model
- Japan
- Pricing Analysis
- Market Share Analysis, 2025
- By Service Type
- By Engine Family
- By Customer Type
- By Aircraft Platform
- By Delivery Model
- South Korea
- Pricing Analysis
- Market Share Analysis, 2025
- By Service Type
- By Engine Family
- By Customer Type
- By Aircraft Platform
- By Delivery Model
- Russia
- Pricing Analysis
- Market Share Analysis, 2025
- By Service Type
- By Engine Family
- By Customer Type
- By Aircraft Platform
- By Delivery Model
- Poland
- Pricing Analysis
- Market Share Analysis, 2025
- By Service Type
- By Engine Family
- By Customer Type
- By Aircraft Platform
- By Delivery Model
- Hungary
- Pricing Analysis
- Market Share Analysis, 2025
- By Service Type
- By Engine Family
- By Customer Type
- By Aircraft Platform
- By Delivery Model
- Kingdom of Saudi Arabia
- Pricing Analysis
- Market Share Analysis, 2025
- By Service Type
- By Engine Family
- By Customer Type
- By Aircraft Platform
- By Delivery Model
- Turkiye
- Pricing Analysis
- Market Share Analysis, 2025
- By Service Type
- By Engine Family
- By Customer Type
- By Aircraft Platform
- By Delivery Model
- South Africa
- Pricing Analysis
- Market Share Analysis, 2025
- By Service Type
- By Engine Family
- By Customer Type
- By Aircraft Platform
- By Delivery Model
- USA
- Market Structure Analysis
- Competition Dashboard
- Competition Benchmarking
- Market Share Analysis of Top Players
- By Regional
- By Service Type
- By Engine Family
- By Customer Type
- By Aircraft Platform
- By Delivery Model
- Competition Analysis
- Competition Deep Dive
- GE Aerospace
- Overview
- Product Portfolio
- Profitability by Market Segments (Product/Age /Sales Channel/Region)
- Sales Footprint
- Strategy Overview
- Marketing Strategy
- Product Strategy
- Channel Strategy
- Pratt & Whitney
- Rolls-Royce
- Lufthansa Technik
- StandardAero
- GE Aerospace
- Competition Deep Dive
- Assumptions & Acronyms Used
List of Tables
- Table 1: Global Market Value (USD Million) Forecast by Region, 2021 to 2036
- Table 2: Global Market Value (USD Million) Forecast by Service Type , 2021 to 2036
- Table 3: Global Market Value (USD Million) Forecast by Engine Family, 2021 to 2036
- Table 4: Global Market Value (USD Million) Forecast by Customer Type, 2021 to 2036
- Table 5: Global Market Value (USD Million) Forecast by Aircraft Platform, 2021 to 2036
- Table 6: Global Market Value (USD Million) Forecast by Delivery Model, 2021 to 2036
- Table 7: North America Market Value (USD Million) Forecast by Country, 2021 to 2036
- Table 8: North America Market Value (USD Million) Forecast by Service Type , 2021 to 2036
- Table 9: North America Market Value (USD Million) Forecast by Engine Family, 2021 to 2036
- Table 10: North America Market Value (USD Million) Forecast by Customer Type, 2021 to 2036
- Table 11: North America Market Value (USD Million) Forecast by Aircraft Platform, 2021 to 2036
- Table 12: North America Market Value (USD Million) Forecast by Delivery Model, 2021 to 2036
- Table 13: Latin America Market Value (USD Million) Forecast by Country, 2021 to 2036
- Table 14: Latin America Market Value (USD Million) Forecast by Service Type , 2021 to 2036
- Table 15: Latin America Market Value (USD Million) Forecast by Engine Family, 2021 to 2036
- Table 16: Latin America Market Value (USD Million) Forecast by Customer Type, 2021 to 2036
- Table 17: Latin America Market Value (USD Million) Forecast by Aircraft Platform, 2021 to 2036
- Table 18: Latin America Market Value (USD Million) Forecast by Delivery Model, 2021 to 2036
- Table 19: Western Europe Market Value (USD Million) Forecast by Country, 2021 to 2036
- Table 20: Western Europe Market Value (USD Million) Forecast by Service Type , 2021 to 2036
- Table 21: Western Europe Market Value (USD Million) Forecast by Engine Family, 2021 to 2036
- Table 22: Western Europe Market Value (USD Million) Forecast by Customer Type, 2021 to 2036
- Table 23: Western Europe Market Value (USD Million) Forecast by Aircraft Platform, 2021 to 2036
- Table 24: Western Europe Market Value (USD Million) Forecast by Delivery Model, 2021 to 2036
- Table 25: Eastern Europe Market Value (USD Million) Forecast by Country, 2021 to 2036
- Table 26: Eastern Europe Market Value (USD Million) Forecast by Service Type , 2021 to 2036
- Table 27: Eastern Europe Market Value (USD Million) Forecast by Engine Family, 2021 to 2036
- Table 28: Eastern Europe Market Value (USD Million) Forecast by Customer Type, 2021 to 2036
- Table 29: Eastern Europe Market Value (USD Million) Forecast by Aircraft Platform, 2021 to 2036
- Table 30: Eastern Europe Market Value (USD Million) Forecast by Delivery Model, 2021 to 2036
- Table 31: East Asia Market Value (USD Million) Forecast by Country, 2021 to 2036
- Table 32: East Asia Market Value (USD Million) Forecast by Service Type , 2021 to 2036
- Table 33: East Asia Market Value (USD Million) Forecast by Engine Family, 2021 to 2036
- Table 34: East Asia Market Value (USD Million) Forecast by Customer Type, 2021 to 2036
- Table 35: East Asia Market Value (USD Million) Forecast by Aircraft Platform, 2021 to 2036
- Table 36: East Asia Market Value (USD Million) Forecast by Delivery Model, 2021 to 2036
- Table 37: South Asia and Pacific Market Value (USD Million) Forecast by Country, 2021 to 2036
- Table 38: South Asia and Pacific Market Value (USD Million) Forecast by Service Type , 2021 to 2036
- Table 39: South Asia and Pacific Market Value (USD Million) Forecast by Engine Family, 2021 to 2036
- Table 40: South Asia and Pacific Market Value (USD Million) Forecast by Customer Type, 2021 to 2036
- Table 41: South Asia and Pacific Market Value (USD Million) Forecast by Aircraft Platform, 2021 to 2036
- Table 42: South Asia and Pacific Market Value (USD Million) Forecast by Delivery Model, 2021 to 2036
- Table 43: Middle East & Africa Market Value (USD Million) Forecast by Country, 2021 to 2036
- Table 44: Middle East & Africa Market Value (USD Million) Forecast by Service Type , 2021 to 2036
- Table 45: Middle East & Africa Market Value (USD Million) Forecast by Engine Family, 2021 to 2036
- Table 46: Middle East & Africa Market Value (USD Million) Forecast by Customer Type, 2021 to 2036
- Table 47: Middle East & Africa Market Value (USD Million) Forecast by Aircraft Platform, 2021 to 2036
- Table 48: Middle East & Africa Market Value (USD Million) Forecast by Delivery Model, 2021 to 2036
List of Figures
- Figure 1: Global Market Pricing Analysis
- Figure 2: Global Market Value (USD Million) Forecast 2021-2036
- Figure 3: Global Market Value Share and BPS Analysis by Service Type , 2026 and 2036
- Figure 4: Global Market Y-o-Y Growth Comparison by Service Type , 2026-2036
- Figure 5: Global Market Attractiveness Analysis by Service Type
- Figure 6: Global Market Value Share and BPS Analysis by Engine Family, 2026 and 2036
- Figure 7: Global Market Y-o-Y Growth Comparison by Engine Family, 2026-2036
- Figure 8: Global Market Attractiveness Analysis by Engine Family
- Figure 9: Global Market Value Share and BPS Analysis by Customer Type, 2026 and 2036
- Figure 10: Global Market Y-o-Y Growth Comparison by Customer Type, 2026-2036
- Figure 11: Global Market Attractiveness Analysis by Customer Type
- Figure 12: Global Market Value Share and BPS Analysis by Aircraft Platform, 2026 and 2036
- Figure 13: Global Market Y-o-Y Growth Comparison by Aircraft Platform, 2026-2036
- Figure 14: Global Market Attractiveness Analysis by Aircraft Platform
- Figure 15: Global Market Value Share and BPS Analysis by Delivery Model, 2026 and 2036
- Figure 16: Global Market Y-o-Y Growth Comparison by Delivery Model, 2026-2036
- Figure 17: Global Market Attractiveness Analysis by Delivery Model
- Figure 18: Global Market Value (USD Million) Share and BPS Analysis by Region, 2026 and 2036
- Figure 19: Global Market Y-o-Y Growth Comparison by Region, 2026-2036
- Figure 20: Global Market Attractiveness Analysis by Region
- Figure 21: North America Market Incremental Dollar Opportunity, 2026-2036
- Figure 22: Latin America Market Incremental Dollar Opportunity, 2026-2036
- Figure 23: Western Europe Market Incremental Dollar Opportunity, 2026-2036
- Figure 24: Eastern Europe Market Incremental Dollar Opportunity, 2026-2036
- Figure 25: East Asia Market Incremental Dollar Opportunity, 2026-2036
- Figure 26: South Asia and Pacific Market Incremental Dollar Opportunity, 2026-2036
- Figure 27: Middle East & Africa Market Incremental Dollar Opportunity, 2026-2036
- Figure 28: North America Market Value Share and BPS Analysis by Country, 2026 and 2036
- Figure 29: North America Market Value Share and BPS Analysis by Service Type , 2026 and 2036
- Figure 30: North America Market Y-o-Y Growth Comparison by Service Type , 2026-2036
- Figure 31: North America Market Attractiveness Analysis by Service Type
- Figure 32: North America Market Value Share and BPS Analysis by Engine Family, 2026 and 2036
- Figure 33: North America Market Y-o-Y Growth Comparison by Engine Family, 2026-2036
- Figure 34: North America Market Attractiveness Analysis by Engine Family
- Figure 35: North America Market Value Share and BPS Analysis by Customer Type, 2026 and 2036
- Figure 36: North America Market Y-o-Y Growth Comparison by Customer Type, 2026-2036
- Figure 37: North America Market Attractiveness Analysis by Customer Type
- Figure 38: North America Market Value Share and BPS Analysis by Aircraft Platform, 2026 and 2036
- Figure 39: North America Market Y-o-Y Growth Comparison by Aircraft Platform, 2026-2036
- Figure 40: North America Market Attractiveness Analysis by Aircraft Platform
- Figure 41: North America Market Value Share and BPS Analysis by Delivery Model, 2026 and 2036
- Figure 42: North America Market Y-o-Y Growth Comparison by Delivery Model, 2026-2036
- Figure 43: North America Market Attractiveness Analysis by Delivery Model
- Figure 44: Latin America Market Value Share and BPS Analysis by Country, 2026 and 2036
- Figure 45: Latin America Market Value Share and BPS Analysis by Service Type , 2026 and 2036
- Figure 46: Latin America Market Y-o-Y Growth Comparison by Service Type , 2026-2036
- Figure 47: Latin America Market Attractiveness Analysis by Service Type
- Figure 48: Latin America Market Value Share and BPS Analysis by Engine Family, 2026 and 2036
- Figure 49: Latin America Market Y-o-Y Growth Comparison by Engine Family, 2026-2036
- Figure 50: Latin America Market Attractiveness Analysis by Engine Family
- Figure 51: Latin America Market Value Share and BPS Analysis by Customer Type, 2026 and 2036
- Figure 52: Latin America Market Y-o-Y Growth Comparison by Customer Type, 2026-2036
- Figure 53: Latin America Market Attractiveness Analysis by Customer Type
- Figure 54: Latin America Market Value Share and BPS Analysis by Aircraft Platform, 2026 and 2036
- Figure 55: Latin America Market Y-o-Y Growth Comparison by Aircraft Platform, 2026-2036
- Figure 56: Latin America Market Attractiveness Analysis by Aircraft Platform
- Figure 57: Latin America Market Value Share and BPS Analysis by Delivery Model, 2026 and 2036
- Figure 58: Latin America Market Y-o-Y Growth Comparison by Delivery Model, 2026-2036
- Figure 59: Latin America Market Attractiveness Analysis by Delivery Model
- Figure 60: Western Europe Market Value Share and BPS Analysis by Country, 2026 and 2036
- Figure 61: Western Europe Market Value Share and BPS Analysis by Service Type , 2026 and 2036
- Figure 62: Western Europe Market Y-o-Y Growth Comparison by Service Type , 2026-2036
- Figure 63: Western Europe Market Attractiveness Analysis by Service Type
- Figure 64: Western Europe Market Value Share and BPS Analysis by Engine Family, 2026 and 2036
- Figure 65: Western Europe Market Y-o-Y Growth Comparison by Engine Family, 2026-2036
- Figure 66: Western Europe Market Attractiveness Analysis by Engine Family
- Figure 67: Western Europe Market Value Share and BPS Analysis by Customer Type, 2026 and 2036
- Figure 68: Western Europe Market Y-o-Y Growth Comparison by Customer Type, 2026-2036
- Figure 69: Western Europe Market Attractiveness Analysis by Customer Type
- Figure 70: Western Europe Market Value Share and BPS Analysis by Aircraft Platform, 2026 and 2036
- Figure 71: Western Europe Market Y-o-Y Growth Comparison by Aircraft Platform, 2026-2036
- Figure 72: Western Europe Market Attractiveness Analysis by Aircraft Platform
- Figure 73: Western Europe Market Value Share and BPS Analysis by Delivery Model, 2026 and 2036
- Figure 74: Western Europe Market Y-o-Y Growth Comparison by Delivery Model, 2026-2036
- Figure 75: Western Europe Market Attractiveness Analysis by Delivery Model
- Figure 76: Eastern Europe Market Value Share and BPS Analysis by Country, 2026 and 2036
- Figure 77: Eastern Europe Market Value Share and BPS Analysis by Service Type , 2026 and 2036
- Figure 78: Eastern Europe Market Y-o-Y Growth Comparison by Service Type , 2026-2036
- Figure 79: Eastern Europe Market Attractiveness Analysis by Service Type
- Figure 80: Eastern Europe Market Value Share and BPS Analysis by Engine Family, 2026 and 2036
- Figure 81: Eastern Europe Market Y-o-Y Growth Comparison by Engine Family, 2026-2036
- Figure 82: Eastern Europe Market Attractiveness Analysis by Engine Family
- Figure 83: Eastern Europe Market Value Share and BPS Analysis by Customer Type, 2026 and 2036
- Figure 84: Eastern Europe Market Y-o-Y Growth Comparison by Customer Type, 2026-2036
- Figure 85: Eastern Europe Market Attractiveness Analysis by Customer Type
- Figure 86: Eastern Europe Market Value Share and BPS Analysis by Aircraft Platform, 2026 and 2036
- Figure 87: Eastern Europe Market Y-o-Y Growth Comparison by Aircraft Platform, 2026-2036
- Figure 88: Eastern Europe Market Attractiveness Analysis by Aircraft Platform
- Figure 89: Eastern Europe Market Value Share and BPS Analysis by Delivery Model, 2026 and 2036
- Figure 90: Eastern Europe Market Y-o-Y Growth Comparison by Delivery Model, 2026-2036
- Figure 91: Eastern Europe Market Attractiveness Analysis by Delivery Model
- Figure 92: East Asia Market Value Share and BPS Analysis by Country, 2026 and 2036
- Figure 93: East Asia Market Value Share and BPS Analysis by Service Type , 2026 and 2036
- Figure 94: East Asia Market Y-o-Y Growth Comparison by Service Type , 2026-2036
- Figure 95: East Asia Market Attractiveness Analysis by Service Type
- Figure 96: East Asia Market Value Share and BPS Analysis by Engine Family, 2026 and 2036
- Figure 97: East Asia Market Y-o-Y Growth Comparison by Engine Family, 2026-2036
- Figure 98: East Asia Market Attractiveness Analysis by Engine Family
- Figure 99: East Asia Market Value Share and BPS Analysis by Customer Type, 2026 and 2036
- Figure 100: East Asia Market Y-o-Y Growth Comparison by Customer Type, 2026-2036
- Figure 101: East Asia Market Attractiveness Analysis by Customer Type
- Figure 102: East Asia Market Value Share and BPS Analysis by Aircraft Platform, 2026 and 2036
- Figure 103: East Asia Market Y-o-Y Growth Comparison by Aircraft Platform, 2026-2036
- Figure 104: East Asia Market Attractiveness Analysis by Aircraft Platform
- Figure 105: East Asia Market Value Share and BPS Analysis by Delivery Model, 2026 and 2036
- Figure 106: East Asia Market Y-o-Y Growth Comparison by Delivery Model, 2026-2036
- Figure 107: East Asia Market Attractiveness Analysis by Delivery Model
- Figure 108: South Asia and Pacific Market Value Share and BPS Analysis by Country, 2026 and 2036
- Figure 109: South Asia and Pacific Market Value Share and BPS Analysis by Service Type , 2026 and 2036
- Figure 110: South Asia and Pacific Market Y-o-Y Growth Comparison by Service Type , 2026-2036
- Figure 111: South Asia and Pacific Market Attractiveness Analysis by Service Type
- Figure 112: South Asia and Pacific Market Value Share and BPS Analysis by Engine Family, 2026 and 2036
- Figure 113: South Asia and Pacific Market Y-o-Y Growth Comparison by Engine Family, 2026-2036
- Figure 114: South Asia and Pacific Market Attractiveness Analysis by Engine Family
- Figure 115: South Asia and Pacific Market Value Share and BPS Analysis by Customer Type, 2026 and 2036
- Figure 116: South Asia and Pacific Market Y-o-Y Growth Comparison by Customer Type, 2026-2036
- Figure 117: South Asia and Pacific Market Attractiveness Analysis by Customer Type
- Figure 118: South Asia and Pacific Market Value Share and BPS Analysis by Aircraft Platform, 2026 and 2036
- Figure 119: South Asia and Pacific Market Y-o-Y Growth Comparison by Aircraft Platform, 2026-2036
- Figure 120: South Asia and Pacific Market Attractiveness Analysis by Aircraft Platform
- Figure 121: South Asia and Pacific Market Value Share and BPS Analysis by Delivery Model, 2026 and 2036
- Figure 122: South Asia and Pacific Market Y-o-Y Growth Comparison by Delivery Model, 2026-2036
- Figure 123: South Asia and Pacific Market Attractiveness Analysis by Delivery Model
- Figure 124: Middle East & Africa Market Value Share and BPS Analysis by Country, 2026 and 2036
- Figure 125: Middle East & Africa Market Value Share and BPS Analysis by Service Type , 2026 and 2036
- Figure 126: Middle East & Africa Market Y-o-Y Growth Comparison by Service Type , 2026-2036
- Figure 127: Middle East & Africa Market Attractiveness Analysis by Service Type
- Figure 128: Middle East & Africa Market Value Share and BPS Analysis by Engine Family, 2026 and 2036
- Figure 129: Middle East & Africa Market Y-o-Y Growth Comparison by Engine Family, 2026-2036
- Figure 130: Middle East & Africa Market Attractiveness Analysis by Engine Family
- Figure 131: Middle East & Africa Market Value Share and BPS Analysis by Customer Type, 2026 and 2036
- Figure 132: Middle East & Africa Market Y-o-Y Growth Comparison by Customer Type, 2026-2036
- Figure 133: Middle East & Africa Market Attractiveness Analysis by Customer Type
- Figure 134: Middle East & Africa Market Value Share and BPS Analysis by Aircraft Platform, 2026 and 2036
- Figure 135: Middle East & Africa Market Y-o-Y Growth Comparison by Aircraft Platform, 2026-2036
- Figure 136: Middle East & Africa Market Attractiveness Analysis by Aircraft Platform
- Figure 137: Middle East & Africa Market Value Share and BPS Analysis by Delivery Model, 2026 and 2036
- Figure 138: Middle East & Africa Market Y-o-Y Growth Comparison by Delivery Model, 2026-2036
- Figure 139: Middle East & Africa Market Attractiveness Analysis by Delivery Model
- Figure 140: Global Market - Tier Structure Analysis
- Figure 141: Global Market - Company Share Analysis


