

- Market Size (2026)
- USD 12.0 Bn
- Forecast (2036)
- USD 26.3 Bn
- CAGR (2026 to 2036)
- 8.2%
How big is Antimicrobial Additives Market in 2026?
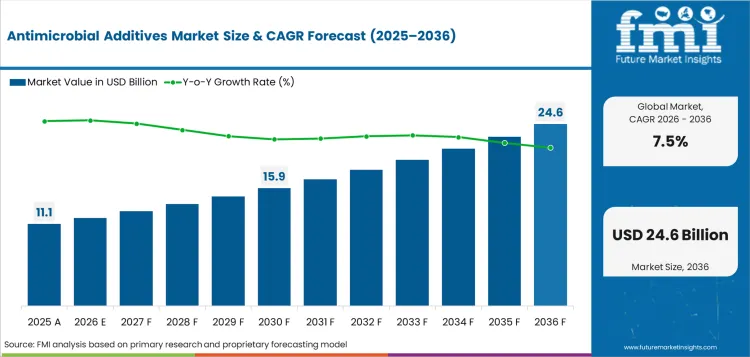
USD 12.0 billion in 2026 and USD 26.3 billion by 2036 at an 8.2% CAGR from 2026 to 2036.
Demand for antimicrobial additives is projected to expand at 8.2% CAGR between 2026 and 2036 as polymer producers embed protection during material formulation. Microban showcased current plastic applications at K 2025 in October 2025 and linked adoption to durable performance during manufacture. Microban’s specification route expands repeat additive demand once the formulation passes processing and product tests. Plastic additives categories face the same need for stable processing behavior.
Country conversion differs under treated-article rules that govern which active substances and claims reach commercialization. Health Canada stated in December 2025 that Canada had more than 50 registered antimicrobial active ingredients and about 400 end-use products. Its guidance also notes differences among Canadian, USA and European claim frameworks. Differences among these claim frameworks raise the value of jurisdiction-specific documentation for biocide formulations used in treated materials.
Key Takeaways
- Manufacturers increasingly specify antimicrobial protection during material formulation since qualified additives can protect appearance and service life without a separate treatment step.
- The inorganic - others (gold, platinum) segment is likely to capture 27.1% share in 2026 attributable to specialized formulations used in tightly specified material programs.
- Inorganic is set to lead the base type category with 79.9% share in 2026 due to broad use of nonvolatile metal and mineral chemistries in durable materials.
- Masterbatch pellet is projected to hold 51.1% share in 2026 owing to pre-dispersed delivery that gives plastics processors repeatable dosing during commercial production.
- Qualification costs rise when antimicrobial efficacy, resin compatibility and allowable claims require separate validation during the move to routine production.
- Some of the key players in this market include Microban International, SANITIZED AG, BioCote Limited, Avient Corporation, HeiQ Materials AG, LANXESS AG, Polygiene Group AB, and LG Electronics.
Analyst Perspective
"Antimicrobial additive programs become durable revenue once chemistry and carrier choice survive the customer production line. Companies that reduce reformulation work by pairing material testing with destination-market claim guidance earn more value from each qualified program."
- Nikhil Kaitwade, Principal Consultant, Future Market Insights
How is the antimicrobial additives market segmented?
The antimicrobial additives market is segmented by product category, base type, form, application, and region.
Product category covers inorganic gold or platinum systems, copper, silver ion, quaternary ammonium compounds and zinc. Base type separates inorganic and organic chemistries. Form includes masterbatch pellets, powder and liquid. Application covers consumer electronics and durable appliances, high-touch surfaces, hygiene chemicals, medical devices and other uses.
Why do Consumer Electronics, Durables & Appliances lead the Application category?
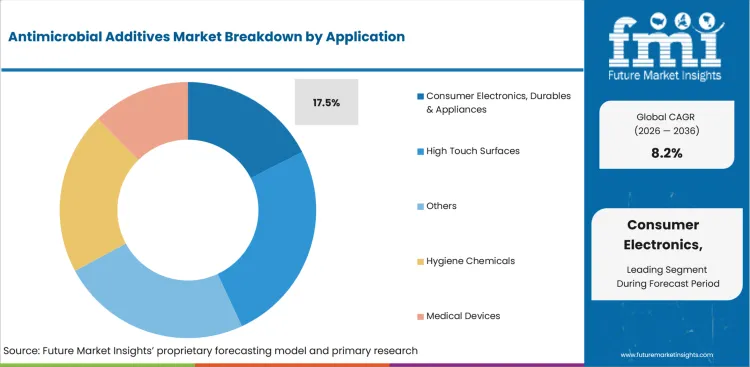
Electronics and appliance programs need functional surfaces that retain appearance through molding, repeated handling and routine cleaning. Large production runs make small dosing or color errors commercially expensive for manufacturers managing shared resin platforms.
- By application, consumer electronics, durables & appliances is forecast to represent 17.5% in 2026 driven by repeated qualification of housings, bezels and high-touch components.
- China’s Ministry of Industry and Information Technology reported in January 2026 that electronic information manufacturing value added rose 10.6% during 2025. China’s electronics production scale widens the qualification base for high-touch coatings and functional polymer additives used in durable electronics.
Why does Inorganic - Others (Gold, Platinum) lead the Product Category?
Gold and platinum systems occupy specialized programs in which material designers pay for controlled interaction with the finished surface. Qualification depends on the treated article rather than the chemistry label alone, particularly where appearance and surface behavior must remain stable.
- Based on product category, inorganic - others (gold, platinum) is projected to account for 27.1% in 2026 due to value concentration in tightly specified applications.
- ISO reconfirmed ISO 22196:2011 on June 15 2026 for measuring antibacterial activity on treated plastics and non-porous surfaces. Finished-material testing is therefore central to qualification in antimicrobial polymer films and comparable treated products.
Why does Inorganic lead the Base Type category?
Inorganic chemistries fit applications exposed to processing heat or long service periods, including antimicrobial coil coatings. Material selection still depends on color and processing compatibility, especially for parts exposed to molding temperatures and visible service surfaces.
- By base type, inorganic is estimated to hold 79.9% in 2026 owing to metal-based technologies fitting durable polymer and coating programs that need long service life under repeated use.
- HeiQ granted an October 2025 patent license for silver-based antimicrobial overprint varnishes to Oberthur Fiduciaire and VHP Security Paper. The agreement shows how registered inorganic chemistry can enter specialized surface systems beside self-sanitizing plastics.
Why does Masterbatch Pellet lead the Form category?
Masterbatch pellets place the active ingredient in a carrier format that plastics processors can meter with existing equipment. Pre-dispersion reduces handling variation during scale-up and repeated production, especially where dosing tolerance is tight and line changes are costly.
- In 2026, masterbatch pellet is expected to lead form with 51.1% share because processors can meter pre-dispersed additives with existing polymer equipment during routine production.
- Microban announced its PLASTINDIA 2026 polymer program in November 2025 with customized solutions for manufacturing requirements and partner applications. Microban’s application work reinforces the commercial role of masterbatch concentrates in high-volume plastics processing.
What are the drivers, restraints and opportunities in the Antimicrobial Additives Market?
Built-in product protection raises recurring specification demand, regulatory claim boundaries slow qualification, and local application support can shorten the route from material trial to repeat production.
- Driver: Durable product-preservation requirements move antimicrobial chemistry into material specifications that repeat with each qualified manufacturing run.
- Restraint: Treated-article rules can delay commercialization since technical efficacy does not automatically permit every marketing claim or end use.
- Opportunity: Local testing and formulation support can convert expanding polymer and coatings programs into qualified additive volumes with fewer unresolved production steps.
Built-In Protection Supports Repeat Material Specifications
Manufacturers purchase additive volume repeatedly as protection becomes part of an approved resin or coating recipe. EPA guidance updated in May 2026 states that treated-article exemptions protect the article itself and do not authorize unregistered public-health claims. EPA’s product-protection boundary favors evidence-led programs in antimicrobial powder coatings that must survive routine production.
Claim Boundaries Extend Qualification Timelines
Legal eligibility can become the binding restraint once an additive passes laboratory efficacy testing. HSE guidance updated in April 2026 requires relevant active substances to meet GB approval conditions before treated articles reach the market. Additional labeling can also apply to stated biocidal properties. Manufacturers therefore need regulatory review beside material testing for antimicrobial interior coatings.
Local Application Support Shortens Commercial Conversion
Regional formulation support reduces travel and iteration time during customer trials. SANITIZED appointed Prakash Chemicals in May 2025 as its preservation distributor for West, North and Central India with expertise in coatings and related formulations. Similar local support can help additive makers convert trials in antimicrobial HVAC coatings into repeat orders once compatibility is confirmed.
Which country CAGRs are profiled in the Antimicrobial Additives Market?
| Country | CAGR |
|---|---|
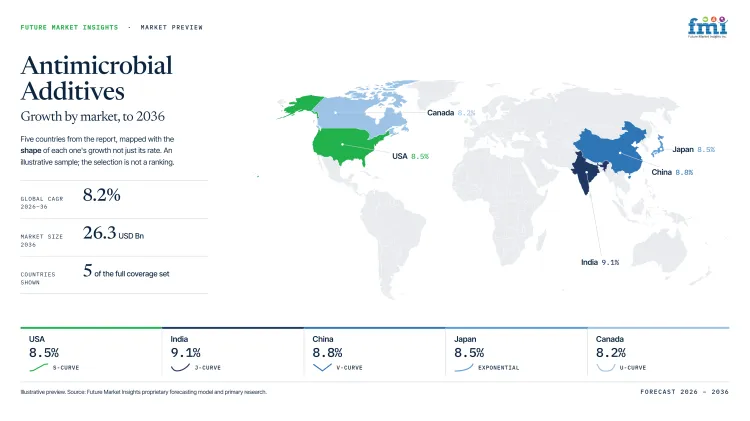
| USA | 8.5% CAGR from 2026 to 2036 |
| Japan | 8.5% CAGR from 2026 to 2036 |
| South Korea | 8.3% CAGR from 2026 to 2036 |
| Canada | 8.2% CAGR from 2026 to 2036 |
| UK | 7.4% CAGR from 2026 to 2036 |
How do country-level CAGRs compare in the Antimicrobial Additives Market?
The five profiled markets span 1.1 percentage points between the 8.5% USA and Japan forecasts and the UK at 7.4%. South Korea and Canada form a middle band at 8.3% and 8.2%. Similar rates conceal different commercial paths as manufacturing depth and service access alter conversion timing.
- USA plants favor formulation teams that can transfer validated resin programs between factories.
- Japanese customers place unusual weight on material traceability during regulated formulation changes.
- South Korean electronics cycles reward rapid color and heat checks during product refreshes.
- Canada's dispersed manufacturing base increases the value of nearby technical support during scale-up.
- UK coatings programs require local technical files for formulation transfers between plants.
Comparable forecast rates hide different costs for testing, service coverage and production transfer.
The full report provides country-level CAGR analysis across North America, Latin America, Europe, East Asia, South Asia, Oceania and the Middle East and Africa.
Country-wise Analysis
- United States plastics manufacturers qualify antimicrobial additives inside resin and component programs that transfer between plants once local line conditions are verified. Antimicrobial additives demand in the United States is forecast to rise at 8.5% CAGR through 2036 owing to the country's large conversion base and established polymer-processing capacity. BLS counted 77,480 machine operators in plastics and rubber manufacturing during 2025 and the figure confirms substantial domestic capacity for customer trials and repeat production. Plant-specific validation and claim restrictions raise conversion costs, so companies with domestic regulatory support and processing data can shorten qualification without changing validated production conditions.
- Japanese processors manage antimicrobial formulations within mature plastics supply chains and traceability shapes qualification schedules for regulated devices and durable consumer goods sold into domestic and export programs. METI's February 2026 release recorded industrial production up 2.2% month on month and identified plastic products as the second-largest contributor, confirming active conversion lines for material qualification without proving additive purchases. Japan is projected to record 8.5% CAGR during the forecast period, reflecting stable industrial throughput and deep local materials expertise. Documentation for regulated material changes can lengthen trials, so companies with disciplined formulation records and test data gain an advantage during production transfers.
- South Korean electronics groups refresh devices quickly and expect functional materials to hold narrow appearance and processing tolerances during each product cycle. Antimicrobial additives sales are forecast to expand at 8.3% CAGR through 2036 aided by dense electronics manufacturing and frequent platform updates. Short launch schedules punish color or thermal instability, so local testing speed and rapid formulation adjustment become practical qualification advantages during scale-up. In July 2026 the Ministry of Trade, Industry and Energy reported first-half semiconductor exports increased 162.6% year over year, reinforcing the production intensity that additive companies must support while customers move from material trials into stable commercial production runs.
- Canadian compounders often serve cross-border programs while mapping every treated use to Canadian authorization before commercial release and label approval. Statistics Canada reported in July 2026 that plastics and rubber product manufacturing sales increased 11.9% year over year, confirming an active domestic conversion base for material companies. Antimicrobial additives demand in Canada is estimated to advance at 8.2% CAGR by 2036 given that manufacturing base and established North American customer programs. Canadian use rates and claims remain a separate gate, so companies that resolve regulatory differences before trials can reduce reformulation work and avoid repeating customer qualification during customer scale-up programs.
- United Kingdom manufacturers serve appliance and coatings customers that expect documented performance from every material change and production transfer. ONS reported in February 2026 that output from computer, electronic and optical products increased 3.3% during the fourth quarter of 2025 and confirmed active downstream manufacturing for functional materials. Local testing and chemical-service networks support formulation work while active-substance eligibility and labeling requirements limit some claims and raise documentation needs. Antimicrobial additives demand in the United Kingdom is forecast to grow at 7.4% CAGR through 2036 tied to steady manufacturing demand and stronger value for GB-ready technical files for each local commercial launch.
Who are the notable companies in the Antimicrobial Additives Market?
Microban International, SANITIZED AG, BioCote Limited, Avient Corporation, HeiQ Materials AG, LANXESS AG, Polygiene Group AB, and LG Electronics are the notable companies profiled in this market.
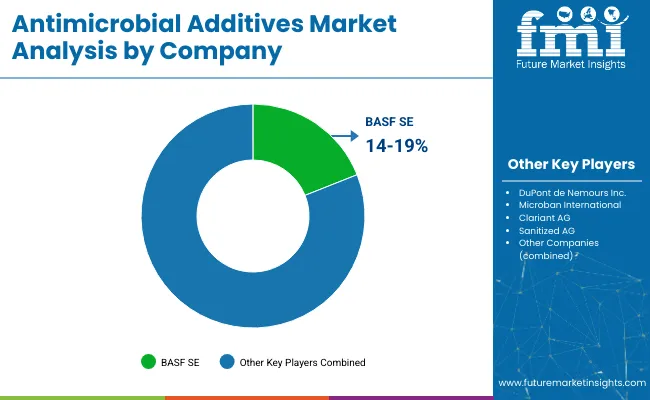
Competition divides between antimicrobial specialists and broader materials groups with polymer or formulation expertise. Entry depends on chemistry evidence, processing support and repeatable application testing rather than corporate scale alone.
- Antimicrobial technology specialists Microban International, SANITIZED AG and BioCote Limited pair active-chemistry knowledge with claim or testing support for treated materials.
- Polymer and formulation groups Avient Corporation, HeiQ Materials AG and LANXESS AG bring documented materials engineering or application-development routes to antimicrobial programs.
- Functional-material specialists Polygiene Group AB and LG Electronics concentrate on treated textiles and glass-based additive systems whose qualification depends on material-specific performance evidence.
Competitive Benchmarking: Antimicrobial Additives Market
| Company | Antimicrobial Chemistry & Regulatory Support | Polymer/Formulation Integration | Testing & Application Support | Geographic Reach |
|---|---|---|---|---|
| Microban International | High | High | High | Global |
| SANITIZED AG | High | High | High | Europe, Asia and international distributor coverage |
| BioCote Limited | High | Medium | High | UK, Europe and international partner network |
| Avient Corporation | Medium | High | Medium | North America and global materials network |
| HeiQ Materials AG | High | Medium | Medium | Europe with partners in 60+ countries |
| LANXESS AG | High | Medium | High | Global specialty-chemistry network |
| Polygiene Group AB | Medium | High | Medium | Europe and international brand partnerships |
| LG Electronics | High | High | Medium | Global materials business with Asia, Europe and North America exhibition coverage |
Scoring basis: High chemistry support requires at least three documented chemistry or claim-support routes, Medium requires two and Low identifies one. High integration or validation requires at least three documented material or support categories. Medium requires two and Low identifies one verified category.
Source basis: Ratings use official company announcements, investor materials and current certification or testing disclosures reviewed through August 2026.
Key Developments in the Antimicrobial Additives Market
- In September 2025, Microban International partnered with Curie Co to develop preservation systems for household and industrial cleaners plus institutional cleaners with paints and coatings.
- In December 2025, SANITIZED AG received renewed International Antimicrobial Council accreditation for its microbiological laboratory and reaffirmed its documented testing route.
- In March 2025, Polygiene Group AB expanded its CUBE partnership to protector products using Polygiene freshness treatment that inhibits odor-causing bacterial growth.
Key Players in the Antimicrobial Additives Market
Antimicrobial Technology Specialists
- Microban International
- SANITIZED AG
- BioCote Limited
Polymer and Formulation Integration Platforms
- Avient Corporation
- HeiQ Materials AG
- LANXESS AG
Functional Materials Specialists
- Polygiene Group AB
- LG Electronics
Antimicrobial Additives Market - Report Scope
| Coverage field | Report scope |
|---|---|
| Market breakdown | By product category, base type, form, application and region. |
| Quantitative Units | USD billion. |
| Market Definition | Commercial antimicrobial additives incorporated into materials or formulations within the defined product category, base type, form and application universe. Downstream finished-product revenue is excluded. |
| Regions Covered | North America, Latin America, Western Europe, Eastern Europe, East Asia, South Asia and Pacific, Middle East and Africa. |
| Countries Covered | USA, Japan, South Korea, Canada, UK, and 25+ countries included in the full report. |
| Key Companies Profiled | Microban International, SANITIZED AG, BioCote Limited, Avient Corporation, HeiQ Materials AG, LANXESS AG, Polygiene Group AB, and LG Electronics. |
| Forecast Period | 2026 to 2036. |
| Approach | Hybrid bottom-up and top-down sizing reconciles additive consumption, supplier evidence, application demand and country-level qualification conditions. |
Antimicrobial Additives Market - Research Methodology
| Method | Approach |
|---|---|
| Primary Research | FMI analysts gathered input from manufacturers, service providers, technology developers, distributors, end users, procurement teams, and subject-matter experts. Interviews examined purchasing decisions, product or service evaluation, adoption barriers, approval requirements, pricing considerations, and expectations for technical or commercial support. Respondents were also asked what evidence is required before a trial, pilot, or initial order develops into regular purchasing. |
| Desk Research | Desk research covered government statistics, regulatory publications, trade data, industry associations, technical literature, standards, company filings, product information, and official corporate announcements. Sources were reviewed for relevance, publication date, geographic coverage, and consistency with the defined market scope. Claims relating to performance, applications, approvals, capacity, investment, and commercial activity were retained only when supported by credible public evidence. |
| Market Sizing and Forecasting | The market model combined the baseline value with historical performance, segment structure, pricing and volume indicators, adoption levels, company participation, and country-level demand conditions. Forecast assumptions considered economic activity, investment trends, regulatory developments, technology adoption, purchasing cycles, supply availability, and barriers to wider market use. Segment and regional estimates were reconciled before the final market total was calculated. |
| Data Validation | Estimates were checked against multiple independent indicators, including public data, company activity, trade patterns, industry developments, and findings from primary interviews. Validation also tested whether products, services, applications, and company revenues fell within the defined market boundaries. Adjacent categories, unsupported claims, overlapping revenues, and activities without direct market relevance were excluded to reduce double counting and maintain consistency across segments and countries. |
Antimicrobial Additives Market by Segments
Antimicrobial Additives Market segmented by Product Category:
- Inorganic - Others (Gold, Platinum)
- Inorganic - Copper
- Inorganic - Silver Ion
- Organic - Quaternary Ammonium Compounds
- Inorganic - Zinc
Antimicrobial Additives Market segmented by Base Type:
- Inorganic
- Organic
Antimicrobial Additives Market segmented by Form:
- Masterbatch Pellet
- Powder
- Liquid
Antimicrobial Additives Market segmented by Application:
- Consumer Electronics, Durables & Appliances
- High Touch Surfaces
- Others
- Hygiene Chemicals
- Medical Devices
Antimicrobial Additives Market by Region:
- North America
- United States
- Canada
- Latin America
- Brazil
- Mexico
- Argentina
- Chile
- Western Europe
- Germany
- France
- United Kingdom
- Italy
- Spain
- Benelux
- Nordics
- Eastern Europe
- Poland
- Czech Republic
- Romania
- Hungary
- East Asia
- China
- Japan
- South Korea
- South Asia and Pacific
- India
- ASEAN
- Australia and New Zealand
- Middle East and Africa
- GCC Countries
- South Africa
- Türkiye
- Israel
Research Sources and Bibliography
- Microban International. (2025, October 15). Microban International Showcases Innovation and Collaboration at K 2025
- Health Canada, Pest Management Regulatory Agency. (2025, December 17). Questions and Answers - Treated Articles
- International Organization for Standardization. (2026, June 15). ISO 22196:2011 - Measurement of antibacterial activity on plastics and other non-porous surfaces
- HeiQ Materials AG. (2025, October 29). HeiQ grants patent license to Oberthur and VHP Security Paper for antimicrobial overprint varnishes
- Microban International. (2025, November 3). Microban to Showcase Antimicrobial Innovations for Polymers at PLASTINDIA 2026
- Ministry of Industry and Information Technology of the People’s Republic of China. (2026, January 30). 2025年电子信息制造业运行情况
- USA Environmental Protection Agency. (2026, May 5). Consumer Products Treated with Pesticides
- Health and Safety Executive. (2026, April 14). Treated articles
- SANITIZED AG. (2025, May 6). Welcome to our new distributor: Prakash Chemicals Private Limited
- USA Bureau of Labor Statistics. (2026, July). Plastics and Rubber Products Manufacturing: NAICS 326
- Ministry of Economy, Trade and Industry, Japan. (2026, February 27). Indices of Industrial Production
- Ministry of Trade, Industry and Energy, Republic of Korea. (2026, July 1). June exports exceed USD 100 billion for first time
- Statistics Canada. (2026, July 15). Manufacturing sales by industry - Seasonally adjusted
- Office for National Statistics. (2026, February 12). Index of Production, UK: December 2025
- Microban International. (2025, September 15). Microban and Curie Co Partner to enhance cleaning, paints, and coatings solutions
- SANITIZED AG. (2025, December 1). International quality standard reaffirmed
- LG Electronics. (2025, October 13). LG Showcases PuroTec™ Antimicrobial Material at K Show in Germany
- Microban International. (2026, February 24). Microban Showcases Antimicrobial Technologies at PLASTINDIA
- BioCote Limited. (2025, February 17). Antimicrobial Testing with BioCote: ISO 22196, ISO 20743, and ASTM G21
- Avient Corporation. (2026, February 12). Avient Announces Fourth-Quarter and Full-Year 2025 Results; Initiates Full-Year 2026 Financial Guidance
- HeiQ Materials AG. (2026, July 30). Investors: Shareholder Offer by Cortegrande AG
- LANXESS AG. (2026, May). LANXESS AG Annual Stockholders’ Meeting 2026: Annual Report 2025
- Polygiene Group AB. (2025, March 10). MTB Protectors that Stay Fresh - Protecting riders & nature
- BioCote Limited. (2025, July 20). BOMImed | Antimicrobial Breathing Circuits with BioCote®
- LANXESS AG. (2025, February 19). LANXESS inaugurates India Application Development Center
- SANITIZED AG. (2025, July 1). New exclusive global distribution partnership for Sanitized textile technologies
- Microban International. (2026, April 16). Kwikset Marks 10-Year Partnership With Microban During Its 80th Anniversary
- HeiQ Materials AG. (2026, January 14). Archroma and HeiQ partner to bring antimicrobial and odor-control solutions to textile industry
- Avient Corporation. (2025, February 3). Cesa WithStand SX Low Haze Antimicrobial Additives Now Available for Clear Plastic Applications
- SANITIZED AG. (2026, July 14). SANITIZED Preservation India Pvt Ltd joins the scope of our ISO 9001 and ISO 14001 certifications
- Polygiene Group AB. (2025, June 23).KARPOS - PROGRESSIVE OUTDOOR APPAREL STRAIGHT FROM THE DOLOMITES
This bibliography is provided for reader reference and is not exhaustive. The full report contains the complete reference list and detailed citations.
This Report Answers
- How large is the antimicrobial additives market in 2026 and what value is forecast for 2036?
- Which material-specification conditions support recurring antimicrobial additive demand?
- Why does inorganic - others (gold, platinum) hold the leading product category share in 2026?
- Why do inorganic chemistries hold the leading base type share in 2026?
- Why do masterbatch pellets hold the leading form share in 2026?
- How do growth rates differ among the five profiled countries?
- Which operating conditions slow treated-article qualification and commercialization?
- Which companies provide antimicrobial chemistry, formulation integration and application support?
- How should manufacturers compare processing fit, testing support and jurisdiction-specific claim requirements?
Frequently Asked Questions
How big is the antimicrobial additives market in 2026?
The antimicrobial additives market is valued at USD 12.0 billion in 2026 and is projected to reach USD 26.3 billion by 2036. Built-in product protection supports growth as qualified formulations move into repeat material specifications.
What is the CAGR of the antimicrobial additives market from 2026 to 2036?
The antimicrobial additives market is projected to grow at a CAGR of 8.2% between 2026 and 2036. Expansion follows durable material protection needs plus repeat qualification of polymer and coating formulations.
Which product category leads the antimicrobial additives market?
The inorganic - others (gold, platinum) segment is expected to hold 27.1% of the antimicrobial additives market in 2026, driven by value concentration in tightly specified formulations. Finished-material testing is required for commercialization.
Which form leads the antimicrobial additives market?
The masterbatch pellet segment is expected to hold 51.1% of the antimicrobial additives market in 2026, supported by pre-dispersed dosing during commercial polymer processing. Processors can use existing metering equipment without installing a separate liquid-feed route.
Which companies are active in the antimicrobial additives market?
Key companies operating in the antimicrobial additives market include Microban International, SANITIZED AG, BioCote Limited, Avient Corporation, HeiQ Materials AG, LANXESS AG, Polygiene Group AB, and LG Electronics. They compete on chemistry breadth, processing support and application validation.
Preview the report firsthand - request a free sample
Get SampleGet the brochure for pricing and purchase details.
Get PDFTable of Content
- Key Takeaways
- Market Size and CAGR
- Top Growth Driver
- Fastest Growing Segment
- Leading Region
- Key Companies
- Emerging Opportunities
- Executive Summary
- Global Market Outlook
- Demand-side Trends
- Supply-side Trends
- Technology Roadmap Analysis
- Analysis and Recommendations
- Analyst Perspective (What is happening? Why now? What should investors know?)
- Key Questions Answered
- How large is the market?
- What is the CAGR?
- What are key trends?
- Which region dominates?
- Who are the leaders?
- Market Overview
- Market Coverage / Taxonomy
- Market Definition / Scope / Limitations
- Research Methodology
- Chapter Orientation
- Analytical Lens and Working Hypotheses
- Market Structure, Signals, and Trend Drivers
- Benchmarking and Cross-market Comparability
- Market Sizing, Forecasting, and Opportunity Mapping
- Research Design and Evidence Framework
- Desk Research Programme (Secondary Evidence)
- Expert Input and Fieldwork (Primary Evidence)
- Tooling, Models, and Reference Databases
- Data Engineering and Model Build
- Quality Assurance and Audit Trail
- Market Background
- Market Dynamics (Drivers, Restraints, Opportunity, Trends)
- Scenario Forecast (Optimistic, Likely, Conservative)
- Impact Analysis
- AI Impact
- Sustainability Impact
- Regulatory Impact
- Technology Impact
- Consumer / Buyer Analysis
- Purchase Drivers
- Adoption Barriers
- Buyer Journey
- Opportunity Map Analysis
- Product Life Cycle Analysis
- Supply Chain Analysis
- Investment Feasibility Matrix
- Value Chain Analysis
- PESTLE and Porter's Analysis
- Regulatory Landscape
- Regional Parent Market Outlook
- Production and Consumption Statistics
- Import and Export Statistics
- Global Market Analysis and Forecast, 2021 to 2036
- Historical Market Size Value (USD Billion) Analysis, 2021 to 2025
- Current and Future Market Size Value (USD Billion) Projections, 2026 to 2036
- Y-o-Y Growth Trend Analysis
- Absolute $ Opportunity Analysis
- Global Market Pricing Analysis, 2021 to 2036
- Global Market Analysis and Forecast, By Product Category, 2021 to 2036
- Introduction / Key Findings
- Historical Market Size Value (USD Billion) Analysis By Product Category, 2021 to 2025
- Current and Future Market Size Value (USD Billion) Analysis and Forecast By Product Category, 2026 to 2036
- Inorganic - Others (Gold, Platinum)
- Inorganic - Copper
- Inorganic - Silver Ion
- Organic - Quaternary Ammonium Compounds
- Inorganic - Zinc
- Inorganic - Others (Gold, Platinum)
- Y-o-Y Growth Trend Analysis By Product Category, 2021 to 2025
- Absolute $ Opportunity Analysis By Product Category, 2026 to 2036
- Global Market Analysis and Forecast, By Base Type, 2021 to 2036
- Introduction / Key Findings
- Historical Market Size Value (USD Billion) Analysis By Base Type, 2021 to 2025
- Current and Future Market Size Value (USD Billion) Analysis and Forecast By Base Type, 2026 to 2036
- Inorganic
- Organic
- Inorganic
- Y-o-Y Growth Trend Analysis By Base Type, 2021 to 2025
- Absolute $ Opportunity Analysis By Base Type, 2026 to 2036
- Global Market Analysis and Forecast, By Form, 2021 to 2036
- Introduction / Key Findings
- Historical Market Size Value (USD Billion) Analysis By Form, 2021 to 2025
- Current and Future Market Size Value (USD Billion) Analysis and Forecast By Form, 2026 to 2036
- Masterbatch Pellet
- Powder
- Liquid
- Masterbatch Pellet
- Y-o-Y Growth Trend Analysis By Form, 2021 to 2025
- Absolute $ Opportunity Analysis By Form, 2026 to 2036
- Global Market Analysis and Forecast, By Application, 2021 to 2036
- Introduction / Key Findings
- Historical Market Size Value (USD Billion) Analysis By Application, 2021 to 2025
- Current and Future Market Size Value (USD Billion) Analysis and Forecast By Application, 2026 to 2036
- Consumer Electronics, Durables & Appliances
- High Touch Surfaces
- Others
- Hygiene Chemicals
- Medical Devices
- Consumer Electronics, Durables & Appliances
- Y-o-Y Growth Trend Analysis By Application, 2021 to 2025
- Absolute $ Opportunity Analysis By Application, 2026 to 2036
- Global Market Analysis and Forecast, By Region, 2021 to 2036
- Introduction
- Historical Market Size Value (USD Billion) Analysis By Region, 2021 to 2025
- Current Market Size Value (USD Billion) Analysis and Forecast By Region, 2026 to 2036
- North America
- Latin America
- Western Europe
- Eastern Europe
- East Asia
- South Asia and Pacific
- Middle East & Africa
- Market Attractiveness Analysis By Region
- North America Market Analysis and Forecast, By Country, 2021 to 2036
- Historical Market Size Value (USD Billion) Trend Analysis By Market Taxonomy, 2021 to 2025
- Market Size Value (USD Billion) Forecast By Market Taxonomy, 2026 to 2036
- By Country
- USA
- Canada
- By Product Category
- By Base Type
- By Form
- By Application
- By Country
- Market Attractiveness Analysis
- By Country
- By Product Category
- By Base Type
- By Form
- By Application
- Key Takeaways
- Latin America Market Analysis and Forecast, By Country
- Historical Market Size Value (USD Billion) Trend Analysis By Market Taxonomy, 2021 to 2025
- Market Size Value (USD Billion) Forecast By Market Taxonomy, 2026 to 2036
- By Country
- Brazil
- Mexico
- Chile
- Rest of Latin America
- By Product Category
- By Base Type
- By Form
- By Application
- By Country
- Market Attractiveness Analysis
- By Country
- By Product Category
- By Base Type
- By Form
- By Application
- Key Takeaways
- Western Europe Market Analysis and Forecast, By Country
- Historical Market Size Value (USD Billion) Trend Analysis By Market Taxonomy, 2021 to 2025
- Market Size Value (USD Billion) Forecast By Market Taxonomy, 2026 to 2036
- By Country
- Germany
- UK
- Italy
- Spain
- France
- Nordic
- BENELUX
- Rest of Western Europe
- By Product Category
- By Base Type
- By Form
- By Application
- By Country
- Market Attractiveness Analysis
- By Country
- By Product Category
- By Base Type
- By Form
- By Application
- Key Takeaways
- Eastern Europe Market Analysis and Forecast, By Country
- Historical Market Size Value (USD Billion) Trend Analysis By Market Taxonomy, 2021 to 2025
- Market Size Value (USD Billion) Forecast By Market Taxonomy, 2026 to 2036
- By Country
- Russia
- Poland
- Hungary
- Balkan & Baltic
- Rest of Eastern Europe
- By Product Category
- By Base Type
- By Form
- By Application
- By Country
- Market Attractiveness Analysis
- By Country
- By Product Category
- By Base Type
- By Form
- By Application
- Key Takeaways
- East Asia Market Analysis and Forecast, By Country
- Historical Market Size Value (USD Billion) Trend Analysis By Market Taxonomy, 2021 to 2025
- Market Size Value (USD Billion) Forecast By Market Taxonomy, 2026 to 2036
- By Country
- China
- Japan
- South Korea
- By Product Category
- By Base Type
- By Form
- By Application
- By Country
- Market Attractiveness Analysis
- By Country
- By Product Category
- By Base Type
- By Form
- By Application
- Key Takeaways
- South Asia and Pacific Market Analysis and Forecast, By Country
- Historical Market Size Value (USD Billion) Trend Analysis By Market Taxonomy, 2021 to 2025
- Market Size Value (USD Billion) Forecast By Market Taxonomy, 2026 to 2036
- By Country
- India
- ASEAN
- Australia & New Zealand
- Rest of South Asia and Pacific
- By Product Category
- By Base Type
- By Form
- By Application
- By Country
- Market Attractiveness Analysis
- By Country
- By Product Category
- By Base Type
- By Form
- By Application
- Key Takeaways
- Middle East & Africa Market Analysis and Forecast, By Country
- Historical Market Size Value (USD Billion) Trend Analysis By Market Taxonomy, 2021 to 2025
- Market Size Value (USD Billion) Forecast By Market Taxonomy, 2026 to 2036
- By Country
- Kingdom of Saudi Arabia
- Other GCC Countries
- Türkiye
- South Africa
- Other African Union
- Rest of Middle East & Africa
- By Product Category
- By Base Type
- By Form
- By Application
- By Country
- Market Attractiveness Analysis
- By Country
- By Product Category
- By Base Type
- By Form
- By Application
- Key Takeaways
- Key Countries Market Analysis
- USA
- Pricing Analysis
- Market Share Analysis, 2025
- By Product Category
- By Base Type
- By Form
- By Application
- Canada
- Pricing Analysis
- Market Share Analysis, 2025
- By Product Category
- By Base Type
- By Form
- By Application
- Mexico
- Pricing Analysis
- Market Share Analysis, 2025
- By Product Category
- By Base Type
- By Form
- By Application
- Brazil
- Pricing Analysis
- Market Share Analysis, 2025
- By Product Category
- By Base Type
- By Form
- By Application
- Chile
- Pricing Analysis
- Market Share Analysis, 2025
- By Product Category
- By Base Type
- By Form
- By Application
- Germany
- Pricing Analysis
- Market Share Analysis, 2025
- By Product Category
- By Base Type
- By Form
- By Application
- UK
- Pricing Analysis
- Market Share Analysis, 2025
- By Product Category
- By Base Type
- By Form
- By Application
- Italy
- Pricing Analysis
- Market Share Analysis, 2025
- By Product Category
- By Base Type
- By Form
- By Application
- Spain
- Pricing Analysis
- Market Share Analysis, 2025
- By Product Category
- By Base Type
- By Form
- By Application
- France
- Pricing Analysis
- Market Share Analysis, 2025
- By Product Category
- By Base Type
- By Form
- By Application
- India
- Pricing Analysis
- Market Share Analysis, 2025
- By Product Category
- By Base Type
- By Form
- By Application
- ASEAN
- Pricing Analysis
- Market Share Analysis, 2025
- By Product Category
- By Base Type
- By Form
- By Application
- Australia & New Zealand
- Pricing Analysis
- Market Share Analysis, 2025
- By Product Category
- By Base Type
- By Form
- By Application
- China
- Pricing Analysis
- Market Share Analysis, 2025
- By Product Category
- By Base Type
- By Form
- By Application
- Japan
- Pricing Analysis
- Market Share Analysis, 2025
- By Product Category
- By Base Type
- By Form
- By Application
- South Korea
- Pricing Analysis
- Market Share Analysis, 2025
- By Product Category
- By Base Type
- By Form
- By Application
- Russia
- Pricing Analysis
- Market Share Analysis, 2025
- By Product Category
- By Base Type
- By Form
- By Application
- Poland
- Pricing Analysis
- Market Share Analysis, 2025
- By Product Category
- By Base Type
- By Form
- By Application
- Hungary
- Pricing Analysis
- Market Share Analysis, 2025
- By Product Category
- By Base Type
- By Form
- By Application
- Kingdom of Saudi Arabia
- Pricing Analysis
- Market Share Analysis, 2025
- By Product Category
- By Base Type
- By Form
- By Application
- Türkiye
- Pricing Analysis
- Market Share Analysis, 2025
- By Product Category
- By Base Type
- By Form
- By Application
- South Africa
- Pricing Analysis
- Market Share Analysis, 2025
- By Product Category
- By Base Type
- By Form
- By Application
- USA
- Market Structure Analysis
- Competition Dashboard
- Competition Benchmarking
- Market Share Analysis of Top Players
- By Regional
- By Product Category
- By Base Type
- By Form
- By Application
- Emerging Startups
- Innovation Benchmarking
- Competition Analysis
- Competition Deep Dive
- Microban International
- Overview
- Product Portfolio
- Profitability by Market Segments
- Sales Footprint
- Strategy Overview
- Marketing Strategy
- Product Strategy
- Channel Strategy
- Clariant AG
- BASF SE
- SANITIZED AG
- Avient Corporation
- Milliken & Company
- Lonza Group AG
- BioCote Limited
- Dow Inc.
- Thomson Research Associates (Ultra-Fresh)
- Microban International
- Case Studies
- Success Stories
- Recent Developments
- Competition Deep Dive
- Assumptions & Acronyms Used


