

- Market Size (2026)
- USD 2.8 Bn
- Forecast (2036)
- USD 8.3 Bn
- CAGR (2026 to 2036)
- 11.5%
How big is Renewable Methanol Market in 2026?
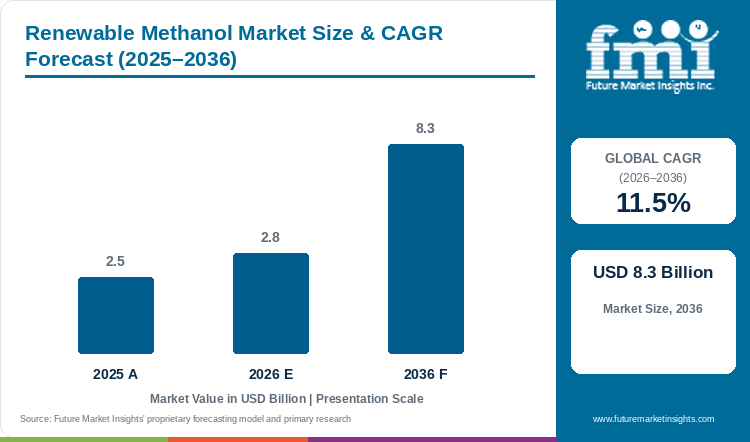
Sales of renewable methanol will grow at a CAGR of 11.5% from 2026 to 2036. Market size was USD 2.5 billion in 2025 and is projected to reach USD 2.8 billion in 2026 and USD 8.3 billion by 2036.
Sales of renewable methanol will grow at a CAGR of 11.5% from 2026 to 2036. Market size stood at USD 2.5 billion in 2025, is estimated at USD 2.8 billion in 2026 and is projected to reach USD 8.3 billion by 2036.
Shipping policy is the swing factor for demand. A motion to adjourn the October 2025 IMO session on the net-zero framework was backed by 57 countries, and adoption is now targeted for the December 2026 committee meeting.[1] Shipowners therefore have no settled fuel standard, and orders for methanol-fuelled ships and bunkering will wait on the December decision.
Supply is moving ahead of that decision. European Energy and Mitsui secured OMV as a new offtaker for the Kassø e-methanol facility on 20 August 2026, and the first delivery has been completed.[2] Kassø has an annual production capacity of 42,000 tonnes.[2] Biomass holds 48% of primary source sales and formaldehyde holds 36% of end use sales in 2026, according to FMI, so chemical buyers will keep sales moving until shipping demand arrives.
Key Market Trends & Insights
- By primary source, biomass led with 48% of sales in 2026, ahead of municipal waste at 24% and industrial waste at 19%, and biomass gasification holds 40% of the announced pipeline.[3]
- By end use, formaldehyde accounted for 36% of sales in 2026, ahead of MTBE at 18% and gasoline at 14%. Hapag-Lloyd ordered eight methanol dual-fuel boxships in December 2025, a fuel pull from shipping that lies outside the formaldehyde base.[4]
Regional Highlights
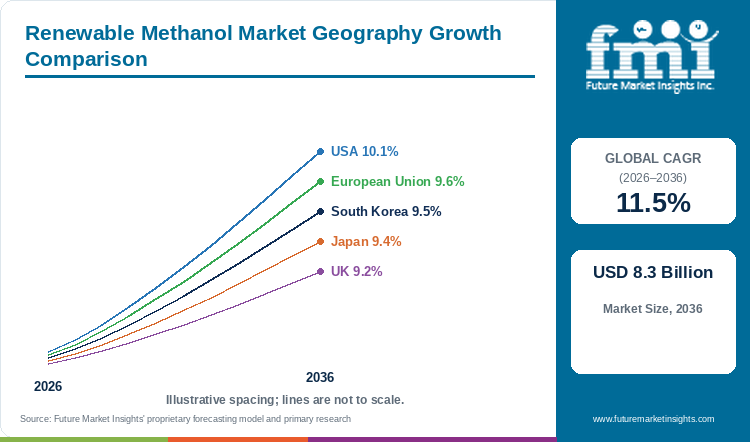
- Fastest-growing profiled country is the USA, projected to grow at a CAGR of 10.1% from 2026 to 2036.
- The European Union (9.6%), South Korea (9.5%) and Japan (9.4%) follow on the same basis, and the UK records the lowest profiled CAGR at 9.2%.
- Splash247 reported in August 2026 that Japan opened a JPY 15.1 billion zero-emission ship subsidy programme running until January 2031, with methanol-fuelled ships eligible for up to one-third of equipment costs.[5]
Market Size & Forecast
Table 1: Market Size and Forecast for the Renewable Methanol Market (USD billion and percentage), 2025 to 2036
| Metric | Value |
|---|---|
| 2025 Market Size | USD 2.5 billion |
| Estimated Market Size in 2026 | USD 2.8 billion |
| Projected Market Size by 2036 | USD 8.3 billion |
| CAGR, 2026 to 2036 | 11.5% |
| Added Revenue, 2026 to 2036 | USD 5.5 billion |
| Market Expansion Multiple | 3.0x |
FMI ties the threefold expansion in market size to government subsidies, carbon pricing and demand for low-emission fuels. The marine diesel engine market lists the June 2025 delivery announcement of the most powerful two-stroke methanol engine from MAN Energy Solutions among the key developments on that page. Hapag-Lloyd ordered eight 4,500 teu dual-fuel methanol boxships in December 2025 for delivery in 2028 and 2029, after an earlier supply deal with Goldwind for 250,000 tonnes of green methanol a year.[4] A shipping line that orders hulls for 2028 needs a methanol contract well before delivery.
Project Pipeline and Shipping Offtake
Six plants were announced in September 2025, four in China, one in Türkiye and one in South Korea, and South Korea is the only profiled country among them.[3] Methanex named Alpha Maritime and Hyodong Shipping as South Korean partners for last-mile bunkering on 23 September 2025, and TankMatch as barge-to-ship partner in the ARA region.[6] In the United Kingdom, the first commercial biomethanol bunkering service launched at the Port of Immingham on 10 February 2026.[7] Bunkering partners now span Europe and Asia, and the UK has a commercial service.
Offtake decides which projects survive. Ørsted scrapped the FlagshipONE e-methanol plant in 2024, citing failure to secure financially viable long-term offtake, and Liquid Wind, the developer that sold the project, began bankruptcy proceedings on 11 May 2026.[8] Kassø took the opposite route, with Maersk, the LEGO Group and Novo Nordisk named as offtakers at the inauguration on 13 May 2025.[9] Rules add timing risk. A motion to adjourn the October 2025 IMO session on the net-zero framework was backed by 57 countries, and adoption is now targeted for the December 2026 committee meeting.[1] Marine shipping takes 72% of demand in the very low sulphur fuel oil market, so methanol competes on regulatory certainty as much as on price.
Table 2: Project Pipeline and Shipping Offtake Indicators for the Renewable Methanol Market (million tonnes, tonnes and percentage), mixed reporting years from 2025 to 2026
| Indicator | Data Point | Relevance | Source |
|---|---|---|---|
| Announced pipeline, October 2025 | 53.9 million tonnes, up 2 million tonnes from August | The pipeline grew between August and October 2025. | [3] |
| Pipeline by technology, October 2025 | Power-to-methanol 53%; biomass gasification 40% | Two routes make up 93% of announced tonnes. | [3] |
| Capacity operating or past final investment decision | 4.5 million tonnes | Most announced tonnes still need a buyer and a financing decision. | [3] |
| Kassø e-methanol facility | 42,000 tonnes a year; Maersk, LEGO Group and Novo Nordisk named in May 2025; OMV added in August 2026 | Named buyers anchor the plant. | [9][2] |
| Hapag-Lloyd newbuild order, December 2025 | Eight 4,500 teu methanol dual-fuel ships; deliveries in 2028 and 2029 | Vessel orders create fuel demand from 2028. | [4] |
| Goldwind supply deal with Hapag-Lloyd | 250,000 tonnes of green methanol a year | The shipping line secured supply ahead of ship delivery. | [4] |
| Liquid Wind, May 2026 | Bankruptcy proceedings began 11 May; FlagshipONE scrapped by Ørsted in 2024 | Developers without long-term offtake carry the highest risk. | [8] |
| IMO net-zero framework, October 2025 | Adjournment backed by 57 countries; adoption targeted for December 2026 | Fuel standards remain unsettled for shipowners. | [1] |
| Methanex Immingham bunkering, February 2026 | First UK commercial biomethanol service; up to 80% lower greenhouse gas emissions | Ørsted is the first user. | [7] |
| Methanex bunkering partners, September 2025 | TankMatch in the ARA region; Alpha Maritime and Hyodong Shipping in South Korea | Bunkering coverage is extending to two regions. | [6] |
Analyst Perspective
“Projects with named buyers and certified product will turn announcements into plants, and shipping orders for 2028 and 2029 will give the first real test of volume. Developers without long-term offtake face the risk that ended FlagshipONE and Liquid Wind.”
- Nikhil Kaitwade, Principal Consultant, Future Market Insights.
How is the renewable methanol market segmented?
The renewable methanol market is segmented into primary source and end use, and region. In 2026, biomass holds 48% of primary source sales and formaldehyde holds 36% of end use sales.
By primary source: biomass, municipal waste, industrial waste, and others.
By end use: formaldehyde, MTBE, gasoline, dimethyl ethers, solvents, and others.
By region: North America, Latin America, Western Europe, Eastern Europe, East Asia, South Asia Pacific, and Middle East and Africa.
Why does biomass lead renewable methanol primary source sales?
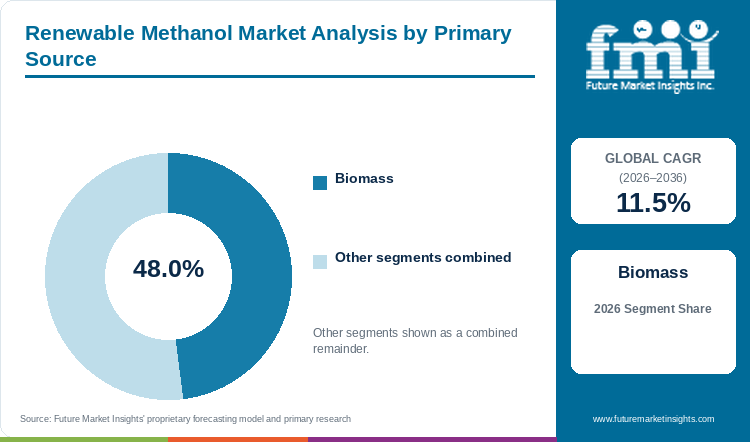
Biomass accounts for 48% of primary source sales in 2026, growing at a CAGR of 11.7% from 2026 to 2036.
Table 3: Primary Source Share for the Renewable Methanol Market (percentage share), 2026
| Primary Source | Estimated Share (2026) |
|---|---|
| Biomass | 48% |
| Municipal Waste | 24% |
| Industrial Waste | 19% |
| Others | 9% |
| Total | 100.0% |
Table 4: Primary Source Leadership and Market Growth for the Renewable Methanol Market (segment and CAGR percentage), 2026 to 2036
| Metric | Value |
|---|---|
| Global CAGR (2026 to 2036) | 11.5% |
| Leading Segment | Biomass |
| Leading Segment CAGR (2026 to 2036) | 11.7% |
Methanex produces ISCC-certified biomethanol at U.S. Gulf Coast facilities from waste and residue feedstocks, such as organic municipal solid waste, and the first commercial biomethanol bunkering service in the UK launched with that supply on 10 February 2026.[7] FMI places biomass at 48% of primary source sales, growing at a CAGR of 11.7% from 2026 to 2036. Municipal waste holds 24% and industrial waste 19%. Biomass leadership therefore turns on waste and residue supply chains that carry certification, and buyers will ask for the certificate before the price.
- Certified supply chains decide which suppliers reach bunkering buyers.
- Ørsted fuels North Sea offshore wind maintenance vessels with biomethanol at Immingham, and Methanex cites up to an 80% cut in greenhouse gas emissions against conventional marine fuels.[7]
Why does formaldehyde lead end use sales?
Formaldehyde accounts for 36% of end use sales in 2026, growing at a CAGR of 11.3% from 2026 to 2036.
Table 5: End Use Share for the Renewable Methanol Market (percentage share), 2026
| End Use | Estimated Share (2026) |
|---|---|
| Formaldehyde | 36% |
| MTBE | 18% |
| Gasoline | 14% |
| Dimethyl Ethers | 12% |
| Solvents | 11% |
| Others | 9% |
| Total | 100.0% |
Formaldehyde carries 36% of end use sales in the FMI split, ahead of MTBE at 18%, gasoline at 14%, dimethyl ethers at 12% and solvents at 11%. The wood adhesives market lists urea-formaldehyde and phenol-formaldehyde as adhesive types, which gives renewable methanol a resin route beside fuel. The dimethyl ether market describes dimethyl ether as producible from methanol, biomass or captured CO2, so that end use draws on the same tonnes. The LEGO Group and Novo Nordisk are named offtakers at Kassø since the plant opened on 13 May 2025.[9] Whether chemical buyers will pay for certified tonnes without a fuel mandate is the open commercial question.
- Resin makers and fuel blenders buy against different certification needs.
- Kassø lists the LEGO Group and Novo Nordisk as offtakers alongside Maersk.[9]
What are the drivers, restraints, and opportunities in the renewable methanol market?
In the renewable methanol market, subsidies, carbon pricing and low-emission fuel demand drive sales, high production cost and thin storage and transport infrastructure constrain supply, and shipping offtake opens the principal commercial opportunity.
- Driver: Government subsidies and carbon pricing move projects forward, and shipping orders add buyers.
- Restraint: High capital cost and limited transport and storage infrastructure hold back supply, and developers without offtake fail.
- Opportunity: Bunkering networks and certified biomethanol and e-methanol supply open shipping and chemical buyers.
Subsidies and Carbon Pricing Move Projects Forward
Government subsidies and carbon pricing are the drivers FMI names for the project pipeline. Japan opened a JPY 15.1 billion programme for zero-emission ships in August 2026, running until January 2031, and methanol-fuelled ships can receive up to one-third of eligible equipment costs.[5] The initial-year budget is JPY 1.2 billion, so early awards will be limited to owners with ready projects.[5]
High Production Cost and Thin Infrastructure Limit Supply
Carbon capture, electrolysis and biomass conversion need large capital, and cost parity with conventional methanol is very hard to reach. Ørsted scrapped FlagshipONE in 2024 over development cost and the lack of viable long-term offtake, and Liquid Wind began bankruptcy proceedings on 11 May 2026.[8] Developers with signed buyers carry the lower financing risk.
Bunkering Networks Open a Path for Certified Supply
Methanex closed the purchase of OCI Methanol on 27 June 2025, adding the Beaumont, Texas facility with 910,000 tonnes of annual methanol capacity.[10] The company then named bunkering partners in the ARA region and South Korea on 23 September 2025.[6] The Immingham service followed in February 2026.[7] Strict new government emissions standards have heightened demand for low-carbon methanol in marine fuel, fuel blending and chemical manufacturing, FMI records, so suppliers with ports and certificates in place hold the opening.
Which country CAGRs are profiled in the renewable methanol market?
Table 6: Country CAGR Comparison for the Renewable Methanol Market (CAGR percentage), 2026 to 2036
| Country | CAGR |
|---|---|
| USA | 10.1% |
| European Union | 9.6% |
| South Korea | 9.5% |
| Japan | 9.4% |
| UK | 9.2% |
How do country-level CAGRs compare in the renewable methanol market?
Profiled countries are bunched between 9.2% and 10.1%, all projected from 2026 to 2036 and all below the global CAGR of 11.5%, as per the analysis from FMI. The USA leads at 10.1%, followed by the European Union at 9.6%, South Korea at 9.5%, Japan at 9.4% and the UK at 9.2%. China is also a key growth region for renewable methanol. Policy design, shipping exposure and hydrogen investment separate the five.
- The USA pairs clean-fuel incentives and a hydrogen economy with Gulf Coast producers.
- The European Union combines RED II, the Green Deal and shipping demand with Kassø offtake and developer failures.
- South Korea links hydrogen investment to shipping and new bunkering partners.
- Japan couples clean energy policy with a ship subsidy open to methanol-fuelled vessels.
- The UK builds on decarbonisation support, green hydrogen and the Immingham bunkering service.
Full report country CAGRs cover: North America; Latin America; Western Europe; Eastern Europe; East Asia; South Asia Pacific; Middle East and Africa.
Country-wise Analysis
USA Renewable Methanol Market Outlook (2026 to 2036)
Government incentives for clean fuels and a growing hydrogen economy are the levers named for the USA, which is projected to grow at a CAGR of 10.1% from 2026 to 2036. Methanex closed the purchase of OCI Methanol on 27 June 2025, adding the Beaumont, Texas facility with 910,000 tonnes of annual methanol capacity.[10] The company produces ISCC-certified biomethanol at U.S. Gulf Coast facilities from waste and residue feedstocks and that supply serves the UK bunkering service launched in February 2026.[7] A UK port is the outlet in view, so export buyers are visible before domestic shipping buyers.
Key takeaway: US growth runs through Gulf Coast producers that already export certified biomethanol, and domestic offtake is the open question.
European Union Renewable Methanol Market Outlook (2026 to 2036)
Kassø in Denmark has 42,000 tonnes of annual e-methanol capacity and added OMV as an offtaker on 20 August 2026, with the first delivery completed.[2] The release positions the fuel as compliant with RED III for road transport in several European countries.[2] Maersk, the LEGO Group and Novo Nordisk have been named offtakers since May 2025.[9] Liquid Wind, the Swedish developer, began bankruptcy proceedings on 11 May 2026, days after applying for an environmental permit for a plant at Örnsköldsvik.[8] Stringent environmental policies, RED II, the Green Deal and IMO-driven shipping demand are the stated levers, and the European Union is projected to grow at a CAGR of 9.6% from 2026 to 2036. Germany, France and the Netherlands lead adoption of bio-based and hydrogen-derived methanol.
Key takeaway: Europe produced both outcomes in one year, a Danish plant adding buyers and a Swedish developer entering bankruptcy.
South Korea Renewable Methanol Market Outlook (2026 to 2036)
Shipping is called a big growth pivot for South Korea. Methanex named Alpha Maritime and Hyodong Shipping as partners for last-mile bunkering there on 23 September 2025.[6] One of the six plants announced in September 2025 is in South Korea.[3] Rising investments in hydrogen energy and green fuels for industrial use complete the stated levers, and South Korea is projected to grow at a CAGR of 9.5% from 2026 to 2036.
Key takeaway: Korean demand will track ship orders and bunkering partners, with one newly announced plant as the local supply signal.
Japan Renewable Methanol Market Outlook (2026 to 2036)
Support for international trading vessels under the new Japanese ship programme is limited to hydrogen- and ammonia-fuelled ships, and methanol-fuelled ships qualify for up to one-third of eligible equipment costs.[5] The programme totals JPY 15.1 billion and runs until January 2031.[5] Government clean energy efforts and a growing focus on hydrogen-based methanol production are the stated levers, with automotive and chemical sectors as key consumers, and Japan is projected to grow at a CAGR of 9.4% from 2026 to 2036.
Key takeaway: The subsidy covers domestic methanol ships and not international traders, so Japanese chemical and automotive buyers carry more of the demand case.
UK Renewable Methanol Market Outlook (2026 to 2036)
The first commercial biomethanol bunkering service in the UK launched at the Port of Immingham on 10 February 2026, with Ørsted as first user for North Sea offshore wind maintenance vessels.[7] Exolum provides storage and fuelling, and Methanex supplies the biomethanol.[7] Strong government support for decarbonisation and green hydrogen investment are the stated levers, and the UK is projected to grow at a CAGR of 9.2% from 2026 to 2036, the lowest of the five profiled countries. Aviation is a second buyer group, and alcohol-to-jet is one of the pathways listed in the sustainable aviation fuel market.
Key takeaway: UK sales begin with one port, one supplier and one wind-farm customer, and aviation and carbon capture mark the next buyers.
Who are the notable companies in the renewable methanol market?
Methanex, Carbon Recycling International, BASF, Enerkem, European Energy, Liquid Wind, BioMCN, Proman, ENI, Apex Energy Teterow, and Uniper are notable companies profiled in this market.
FMI names Methanex, CRI, BASF, Enerkem and European Energy as the key players, and documented activity since May 2025 separates three of them. European Energy runs the 42,000 tonne Kassø plant with named offtakers, Methanex supplies certified biomethanol to bunkering customers in the UK, and Liquid Wind entered bankruptcy in May 2026 after Ørsted scrapped FlagshipONE in 2024. Producers with signed buyers and ports in place hold the stronger position, and developers without either remain exposed.
- Methanex, Carbon Recycling International, BASF, Enerkem and European Energy are the key players.
- Other listed companies: Liquid Wind, BioMCN, Proman, ENI, Apex Energy Teterow, and Uniper.
Competitive Benchmarking: Renewable Methanol Market
Table 7: Competitive Benchmarking for the Renewable Methanol Market (qualitative documentation ratings), 2026
| Company | Plant or Supply | Offtake | Activity | Disclosure |
|---|---|---|---|---|
| European Energy | High | High | High | High |
| Methanex | Medium | Medium | High | High |
| Liquid Wind | Low | Low | Medium | Medium |
High indicates wider documentation in company filings and releases, Medium indicates limited documentation, and Low indicates less direct documentation. Ratings do not indicate product quality, market share or company rank.
Key Developments in the Renewable Methanol Market
- In August 2026, European Energy and Mitsui secured OMV as a new offtaker for the Kassø e-methanol facility, with the first delivery completed.[2]
- In August 2026, Splash247 reported that Japan opened a JPY 15.1 billion zero-emission ship subsidy programme running until January 2031.[5]
- In May 2026, Liquid Wind declared bankruptcy days after applying for an environmental permit for a plant at Örnsköldsvik, Sweden.[8]
- In February 2026, Methanex launched the first commercial biomethanol bunkering service in the UK at the Port of Immingham.[7]
- In December 2025, Hapag-Lloyd ordered eight 4,500 teu methanol dual-fuel boxships from CIMC Raffles for delivery in 2028 and 2029.[4]
- In September 2025, Methanex named bunkering partners in the ARA region and South Korea.[6]
Key Players in the Renewable Methanol Market
Key Players
- Methanex Corporation
- Carbon Recycling International
- BASF SE
- Enerkem
- European Energy
Other Companies
- Liquid Wind
- BioMCN
- Proman
- ENI
- Apex Energy Teterow GmbH
- Uniper SE
Renewable Methanol Market - Report Scope
Table 8: Report Scope for the Renewable Methanol Market (coverage fields and definitions), 2026 to 2036
| Coverage field | Report scope |
|---|---|
| Market breakdown | Primary source; end use; region |
| Quantitative units | USD billion |
| Market coverage | Renewable methanol sales by primary source (biomass, municipal waste, industrial waste, others) and end use (formaldehyde, MTBE, gasoline, dimethyl ethers, solvents, others). |
| Regions covered | North America; Latin America; Western Europe; Eastern Europe; East Asia; South Asia Pacific; Middle East and Africa |
| Countries covered | USA; European Union; South Korea; Japan; UK |
| Key companies profiled | Methanex, Carbon Recycling International, BASF, Enerkem, European Energy, Liquid Wind, BioMCN, Proman, ENI, Apex Energy Teterow, Uniper |
| Forecast period | 2026 to 2036 |
Renewable Methanol Market - Research Methodology
Table 9: Research Methodology for the Renewable Methanol Market (research methods and approach), 2026 edition
| Method | Approach |
|---|---|
| Data Sources | Project, shipping and bunkering facts come from company releases, trade press and news reports dated May 2025 or later. |
| Desk Research | Desk research covers company releases, shipping and trade press, and policy reporting on renewable methanol plants, bunkering and offtake. |
| Market Sizing and Forecasting | Sizing starts from the 2025 market size of USD 2.5 billion and the 11.5% CAGR. |
| Data Validation | Plant, offtake and bunkering facts are matched to company releases and dated trade reports. |
Renewable Methanol Market by Segments
Renewable Methanol Market segmented by Primary Source:
- Biomass
- Municipal Waste
- Industrial Waste
- Others
Renewable Methanol Market segmented by End Use:
- Formaldehyde
- MTBE
- Gasoline
- Dimethyl Ethers
- Solvents
- Others
Renewable Methanol Market by Region
- North America
- United States
- Canada
- Latin America
- Brazil
- Mexico
- Western Europe
- Germany
- France
- United Kingdom
- Italy
- Spain
- Netherlands
- Eastern Europe
- Poland
- Czech Republic
- East Asia
- China
- Japan
- South Korea
- South Asia Pacific
- India
- Australia
- Middle East and Africa
- GCC Countries
- South Africa
Research Sources and Bibliography
- [1] Carbon Brief. (2026, May 5). Q&A: How countries got the global 'net-zero' shipping deal 'back on track'. https://www.carbonbrief.org/qa-how-countries-got-the-global-net-zero-shipping-deal-back-on-track
- [2] European Energy. (2026, August 20). European Energy and Mitsui & Co., Ltd. secure OMV as new offtaker for Kassø e-methanol facility. https://europeanenergy.com/2026/08/20/european-energy-and-mitsui-co-ltd-secure-omv-as-new-offtaker-for-kasso-e-methanol-facility/
- [3] Hazarika, G., engine.online. (2025, October 10). New methanol plants add momentum to bunker fuel transition. https://engine.online/news/new-methanol-plants-add-momentum-to-bunker-fuel-transition-724b
- [4] Splash247. (2025, December 15). Hapag-Lloyd orders eight methanol dual-fuel boxships in $500m newbuild push. https://splash247.com/hapag-lloyd-orders-eight-methanol-dual-fuel-boxships-in-500m-newbuild-push/
- [5] Splash247. (2026, August 24). Japan opens $95m zero-emission ship subsidy pot. https://splash247.com/japan-opens-95m-zero-emission-ship-subsidy-pot/
- [6] Methanex Corporation. (2025, September 23). Methanex Launches Global Methanol Bunkering Operations with Strategic Partnerships in the ARA Region and South Korea. https://www.methanex.com/news/release/methanex-launches-global-methanol-bunkering-operations-with-strategic-partnerships-in-the-ara-region-and-south-korea/
- [7] Methanex Corporation. (2026, February 10). U.K.'s First Commercial Biomethanol Bunkering Service Launches at Port of Immingham. https://www.methanex.com/news/release/u-k-s-first-commercial-biomethanol-bunkering-service-launches-at-port-of-immingham/
- [8] engine.online. (2026, May 14). E-fuel firm Liquid Wind declares bankruptcy. https://engine.online/news/e-fuel-firm-liquid-wind-declares-bankruptcy-7b64
- [9] European Energy. (2025, May 13). Kassø e-methanol facility officially inaugurated. https://europeanenergy.com/2025/05/13/kasso-e-methanol-facility-officially-inaugurated
- [10] OCI Global. (2025, June 27). OCI Global Completes Sale of OCI Methanol to Methanex Corporation. https://live.euronext.com/sites/default/files/company_press_releases/attachments/2025/06/27/Connect_oci-methanol-closing.pdf
This bibliography is provided for reader reference. The full report contains the complete reference list and detailed citations.
This Report Answers
- How big is the renewable methanol market during 2026?
- What market size is projected by 2036?
- Which primary source holds notable share?
- Which end use holds notable share?
- Which countries have notable growth?
- Which companies are notable in the market?
Frequently Asked Questions
How large is the renewable methanol market expected in 2026?
Future Market Insights projects market size at USD 2.8 billion in 2026. Market size is projected to reach USD 8.3 billion by 2036, adding USD 5.5 billion over the forecast period.
What CAGR is projected for the renewable methanol market through 2036?
As per FMI analysis, renewable methanol sales will grow at a CAGR of 11.5% from 2026 to 2036. Subsidies, carbon pricing and shipping demand support the outlook.
Which primary source holds a notable market share in 2026?
Biomass accounts for 48% of primary source sales in 2026. Municipal waste follows at 24% and industrial waste at 19%.
Which end use holds a notable market share in 2026?
Formaldehyde accounts for 36% of end use sales in 2026. MTBE follows at 18%, gasoline at 14%, dimethyl ethers at 12% and solvents at 11%.
Which country has a notable expansion outlook through 2036?
The USA is projected to record the fastest growth at a CAGR of 10.1% from 2026 to 2036, according to FMI. Government incentives for clean fuels and a growing hydrogen economy are the stated levers.
Who are the key companies in the renewable methanol market?
Notable companies include Methanex, Carbon Recycling International, BASF, Enerkem, European Energy, Liquid Wind, BioMCN, Proman, ENI, Apex Energy Teterow, and Uniper.
Preview the report firsthand - request a free sample
Get SampleGet the brochure for pricing and purchase details.
Get PDFTable of Content
- Key Takeaways
- Market Size and CAGR
- Top Growth Driver
- Fastest Growing Segment
- Leading Region
- Key Companies
- Emerging Opportunities
- Executive Summary
- Global Market Outlook
- Demand-side Trends
- Supply-side Trends
- Technology Roadmap Analysis
- Analysis and Recommendations
- Analyst Perspective (What is happening? Why now? What should investors know?)
- Key Questions Answered
- How large is the market?
- What is the CAGR?
- What are key trends?
- Which region dominates?
- Who are the leaders?
- Market Overview
- Market Coverage / Taxonomy
- Market Definition / Scope / Limitations
- Research Methodology
- Chapter Orientation
- Analytical Lens and Working Hypotheses
- Market Structure, Signals, and Trend Drivers
- Benchmarking and Cross-market Comparability
- Market Sizing, Forecasting, and Opportunity Mapping
- Research Design and Evidence Framework
- Desk Research Programme (Secondary Evidence)
- Expert Input and Fieldwork (Primary Evidence)
- Tooling, Models, and Reference Databases
- Data Engineering and Model Build
- Quality Assurance and Audit Trail
- Market Background
- Market Dynamics (Drivers, Restraints, Opportunity, Trends)
- Scenario Forecast (Optimistic, Likely, Conservative)
- Impact Analysis
- AI Impact
- Sustainability Impact
- Regulatory Impact
- Technology Impact
- Consumer / Buyer Analysis
- Purchase Drivers
- Adoption Barriers
- Buyer Journey
- Opportunity Map Analysis
- Product Life Cycle Analysis
- Supply Chain Analysis
- Investment Feasibility Matrix
- Value Chain Analysis
- PESTLE and Porter's Analysis
- Regulatory Landscape
- Regional Parent Market Outlook
- Production and Consumption Statistics
- Import and Export Statistics
- Global Market Analysis and Forecast, 2021 to 2036
- Historical Market Size Value (USD Billion) Analysis, 2021 to 2025
- Current and Future Market Size Value (USD Billion) Projections, 2026 to 2036
- Y-o-Y Growth Trend Analysis
- Absolute $ Opportunity Analysis
- Global Market Pricing Analysis, 2021 to 2036
- Global Market Analysis and Forecast, By Primary Source, 2021 to 2036
- Introduction / Key Findings
- Historical Market Size Value (USD Billion) Analysis By Primary Source, 2021 to 2025
- Current and Future Market Size Value (USD Billion) Analysis and Forecast By Primary Source, 2026 to 2036
- Biomass
- Municipal Waste
- Industrial Waste
- Others
- Y-o-Y Growth Trend Analysis By Primary Source, 2021 to 2025
- Absolute $ Opportunity Analysis By Primary Source, 2026 to 2036
- Global Market Analysis and Forecast, By End Use, 2021 to 2036
- Introduction / Key Findings
- Historical Market Size Value (USD Billion) Analysis By End Use, 2021 to 2025
- Current and Future Market Size Value (USD Billion) Analysis and Forecast By End Use, 2026 to 2036
- Formaldehyde
- MTBE
- Gasoline
- Dimethyl Ethers
- Solvents
- Others
- Y-o-Y Growth Trend Analysis By End Use, 2021 to 2025
- Absolute $ Opportunity Analysis By End Use, 2026 to 2036
- Global Market Analysis and Forecast, By Region, 2021 to 2036
- Introduction
- Historical Market Size Value (USD Billion) Analysis By Region, 2021 to 2025
- Current Market Size Value (USD Billion) Analysis and Forecast By Region, 2026 to 2036
- North America
- Latin America
- Western Europe
- Eastern Europe
- East Asia
- Middle East and Africa
- Market Attractiveness Analysis By Region
- North America Market Analysis and Forecast, By Country, 2021 to 2036
- Historical Market Size Value (USD Billion) Trend Analysis By Market Taxonomy, 2021 to 2025
- Market Size Value (USD Billion) Forecast By Market Taxonomy, 2026 to 2036
- By Country
- United States
- Canada
- By Primary Source
- By End Use
- By Country
- Market Attractiveness Analysis
- By Country
- By Primary Source
- By End Use
- Key Takeaways
- Latin America Market Analysis and Forecast, By Country
- Historical Market Size Value (USD Billion) Trend Analysis By Market Taxonomy, 2021 to 2025
- Market Size Value (USD Billion) Forecast By Market Taxonomy, 2026 to 2036
- By Country
- Brazil
- Mexico
- By Primary Source
- By End Use
- By Country
- Market Attractiveness Analysis
- By Country
- By Primary Source
- By End Use
- Key Takeaways
- Western Europe Market Analysis and Forecast, By Country
- Historical Market Size Value (USD Billion) Trend Analysis By Market Taxonomy, 2021 to 2025
- Market Size Value (USD Billion) Forecast By Market Taxonomy, 2026 to 2036
- By Country
- Germany
- France
- United Kingdom
- Italy
- Spain
- Netherlands
- By Primary Source
- By End Use
- By Country
- Market Attractiveness Analysis
- By Country
- By Primary Source
- By End Use
- Key Takeaways
- Eastern Europe Market Analysis and Forecast, By Country
- Historical Market Size Value (USD Billion) Trend Analysis By Market Taxonomy, 2021 to 2025
- Market Size Value (USD Billion) Forecast By Market Taxonomy, 2026 to 2036
- By Country
- Poland
- Czech Republic
- By Primary Source
- By End Use
- By Country
- Market Attractiveness Analysis
- By Country
- By Primary Source
- By End Use
- Key Takeaways
- East Asia Market Analysis and Forecast, By Country
- Historical Market Size Value (USD Billion) Trend Analysis By Market Taxonomy, 2021 to 2025
- Market Size Value (USD Billion) Forecast By Market Taxonomy, 2026 to 2036
- By Country
- China
- Japan
- South Korea
- South Asia Pacific
- India
- Australia
- By Primary Source
- By End Use
- By Country
- Market Attractiveness Analysis
- By Country
- By Primary Source
- By End Use
- Key Takeaways
- Middle East and Africa Market Analysis and Forecast, By Country
- Historical Market Size Value (USD Billion) Trend Analysis By Market Taxonomy, 2021 to 2025
- Market Size Value (USD Billion) Forecast By Market Taxonomy, 2026 to 2036
- By Country
- GCC Countries
- South Africa
- By Primary Source
- By End Use
- By Country
- Market Attractiveness Analysis
- By Country
- By Primary Source
- By End Use
- Key Takeaways
- Key Countries Market Analysis
- United States
- Pricing Analysis
- Market Share Analysis, 2025
- By Primary Source
- By End Use
- Canada
- Pricing Analysis
- Market Share Analysis, 2025
- By Primary Source
- By End Use
- Mexico
- Pricing Analysis
- Market Share Analysis, 2025
- By Primary Source
- By End Use
- Brazil
- Pricing Analysis
- Market Share Analysis, 2025
- By Primary Source
- By End Use
- Germany
- Pricing Analysis
- Market Share Analysis, 2025
- By Primary Source
- By End Use
- United Kingdom
- Pricing Analysis
- Market Share Analysis, 2025
- By Primary Source
- By End Use
- Italy
- Pricing Analysis
- Market Share Analysis, 2025
- By Primary Source
- By End Use
- Spain
- Pricing Analysis
- Market Share Analysis, 2025
- By Primary Source
- By End Use
- France
- Pricing Analysis
- Market Share Analysis, 2025
- By Primary Source
- By End Use
- India
- Pricing Analysis
- Market Share Analysis, 2025
- By Primary Source
- By End Use
- China
- Pricing Analysis
- Market Share Analysis, 2025
- By Primary Source
- By End Use
- Japan
- Pricing Analysis
- Market Share Analysis, 2025
- By Primary Source
- By End Use
- South Korea
- Pricing Analysis
- Market Share Analysis, 2025
- By Primary Source
- By End Use
- Poland
- Pricing Analysis
- Market Share Analysis, 2025
- By Primary Source
- By End Use
- South Africa
- Pricing Analysis
- Market Share Analysis, 2025
- By Primary Source
- By End Use
- European Union
- Pricing Analysis
- Market Share Analysis, 2025
- By Primary Source
- By End Use
- United States
- Market Structure Analysis
- Competition Dashboard
- Competition Benchmarking
- Market Share Analysis of Top Players
- By Regional
- By Primary Source
- By End Use
- Emerging Startups
- Innovation Benchmarking
- Competition Analysis
- Competition Deep Dive
- European Energy
- Overview
- Product Portfolio
- Profitability by Market Segments
- Sales Footprint
- Strategy Overview
- Marketing Strategy
- Product Strategy
- Channel Strategy
- Methanex
- Liquid Wind
- Methanex Corporation
- Carbon Recycling International
- BASF SE
- Enerkem
- BioMCN
- Proman
- ENI
- Apex Energy Teterow GmbH
- Uniper SE
- European Energy
- Case Studies
- Success Stories
- Recent Developments
- Competition Deep Dive
- Assumptions & Acronyms Used


