Multiplex Biomarker Imaging Market Size and Share Forecast Outlook 2025 to 2035

The multiplex biomarker imaging market is undergoing dynamic growth, fueled by rising demand for spatial biology insights and precision diagnostics in cancer, neuroscience, and immunology research. Academic publications and company press releases have emphasized the importance of high-throughput imaging platforms that allow simultaneous visualization of multiple biomarkers within tissue samples.

This capability has become central to translational research and drug development, where spatial context is critical for understanding disease progression and therapeutic response. Technological improvements in imaging resolution, assay reproducibility, and fluorophore multiplexing capacity have strengthened the appeal of these platforms in both basic and applied biomedical settings.

Research institutions and pharmaceutical companies have increased investments in spatial omics tools, aligning with trends in single-cell analysis and tissue microenvironment profiling. Furthermore, the integration of artificial intelligence in image analysis has enhanced biomarker quantification and accelerated data interpretation. Looking ahead, market expansion is expected to be led by increasing research applications, growing availability of advanced imaging systems, and continued refinement of immunohistochemistry-based assays as a trusted technique for multiplex tissue analysis.
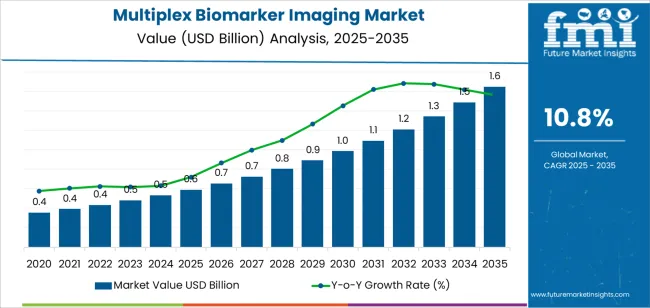
Quick Stats for Multiplex Biomarker Imaging Market

  • Multiplex Biomarker Imaging Market Industry Value (2025): USD 0.6 billion
  • Multiplex Biomarker Imaging Market Forecast Value (2035): USD 1.6 billion
  • Multiplex Biomarker Imaging Market Forecast CAGR: 10.8%
  • Leading Segment in Multiplex Biomarker Imaging Market in 2025: Instruments (42.0%)
  • Key Growth Region in Multiplex Biomarker Imaging Market: North America, Asia-Pacific, Europe
  • Top Key Players in Multiplex Biomarker Imaging Market: Thermo Fisher Scientific, Inc., PerkinElmer Inc., Bio-Rad Laboratories, Inc., Abcam plc., Merck KGaA, Illumina Inc., Leica Biosystems Nussloch GmbH, Ventana Medical Systems, Inc., Aushon BioSystems Ltd., MicroConstants, Inc., ToposNomos Ltd.

Multiplex Biomarker Imaging Market Market Value Analysis

Metric Value
Multiplex Biomarker Imaging Market Estimated Value in (2025 E) USD 0.6 billion
Multiplex Biomarker Imaging Market Forecast Value in (2035 F) USD 1.6 billion
Forecast CAGR (2025 to 2035) 10.8%

Segmental Analysis

The market is segmented by Component Type, Imaging Technique, Application, and End User and region. By Component Type, the market is divided into Instruments, Software, and Services. In terms of Imaging Technique, the market is classified into Immunohistochemistry (IHC) Assay, Fluorescent In Situ Hybridization (FISH) Assay, and Tissue Microarray (TMA) Assay. Based on Application, the market is segmented into Research and Clinical Diagnostics. By End User, the market is divided into Biopharmaceutical Companies, Translation Laboratories, and Academic Institutes. Regionally, the market is classified into North America, Latin America, Western Europe, Eastern Europe, Balkan & Baltic Countries, Russia & Belarus, Central Asia, East Asia, South Asia & Pacific, and the Middle East & Africa.
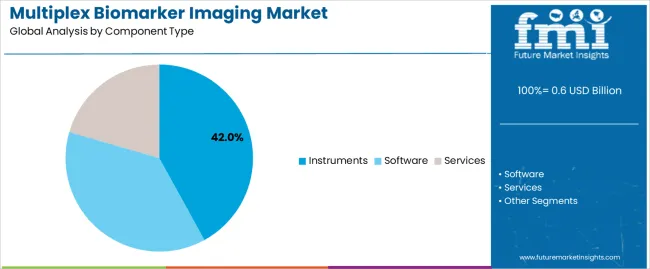
Insights into the Component Type Segment: Instruments

Multiplex Biomarker Imaging Market Analysis By Component Type

The Instruments segment is projected to contribute 42.0% of the multiplex biomarker imaging market revenue in 2025, holding the lead among component types. This segment’s growth has been supported by the growing need for advanced imaging systems capable of capturing high-resolution, multi-parametric data from tissue samples.

Research facilities and academic laboratories have prioritized the acquisition of automated and high-throughput imaging platforms to enhance research efficiency and reproducibility. Imaging instruments equipped with capabilities such as multispectral detection, fluorescence multiplexing, and real-time image capture have become essential tools in biomarker discovery and disease mechanism studies.

Moreover, vendors have expanded their instrument portfolios with integrated image analysis software, which has simplified complex data workflows and reduced reliance on manual interpretation. As multiplexing becomes a standard requirement in translational research and drug development programs, the demand for precision instruments is expected to sustain the Instruments segment’s leadership.
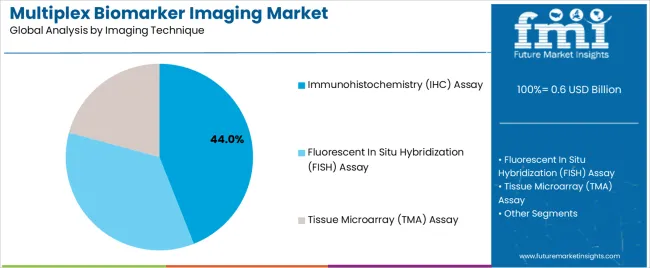
Insights into the Imaging Technique Segment: Immunohistochemistry (IHC) Assay

Multiplex Biomarker Imaging Market Analysis By Imaging Technique

The Immunohistochemistry (IHC) Assay segment is projected to account for 44.0% of the multiplex biomarker imaging market revenue in 2025, maintaining its position as the primary imaging technique. IHC has remained a widely adopted method due to its compatibility with formalin-fixed paraffin-embedded (FFPE) tissue samples and its ability to provide spatial and phenotypic insights into tissue architecture.

Research publications and clinical reports have affirmed IHC’s reliability in detecting protein expression patterns in situ, which is critical for understanding disease pathology. Multiplex IHC assays have evolved through the development of tyramide signal amplification and automated staining platforms, enhancing their multiplexing capacity without compromising tissue integrity.

Laboratories have continued to prefer IHC for its familiarity, clinical relevance, and cost-efficiency, particularly in longitudinal studies and tissue bank analyses. With growing interest in spatial biomarker mapping and targeted therapy validation, IHC is expected to remain the most utilized technique in multiplex imaging workflows.
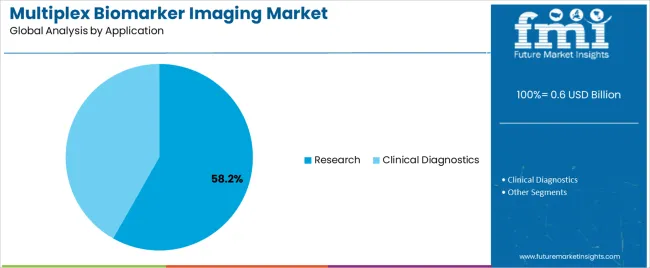
Insights into the Application Segment: Research

Multiplex Biomarker Imaging Market Analysis By Application

The Research segment is expected to capture 58.2% of the multiplex biomarker imaging market revenue in 2025, reinforcing its dominance across application areas. This segment’s growth has been driven by the increasing emphasis on high-resolution spatial analysis in academic, preclinical, and pharmaceutical research settings.

Researchers have leveraged multiplex imaging to study cellular heterogeneity, tumor microenvironments, immune cell infiltration, and biomarker co-expression, which are crucial for developing next-generation diagnostics and therapeutics. Public and private funding initiatives have prioritized projects involving tissue-based multiplex profiling, thereby accelerating adoption within academic consortia and translational research centers.

Furthermore, collaborations between research institutions and biotech firms have facilitated the deployment of multiplex imaging platforms for biomarker discovery and validation. The adaptability of multiplex imaging to both exploratory and hypothesis-driven studies has ensured its widespread use in biomedical science. As spatial biology becomes increasingly integral to drug development pipelines and personalized medicine, the Research segment is projected to remain the key growth contributor in this market.

Semi Annual Market Update

The following table presents the expected CAGR for the global multiplex biomarker imaging market over several semi annual periods spanning from 2025 to 2035. In the first half (H1) of the decade from 2025 to 2035, the industry is predicted to surge at a CAGR of 11.2%, followed by a slightly lower growth rate of 11% in the second half (H2) of the same decade.

Particular Value CAGR
H1 11.2% (2025 to 2035)
H2 11% (2025 to 2035)
H1 10.9% (2025 to 2035)
H2 10.6% (2025 to 2035)

Moving into the subsequent period, from H1 2025 to H2 2035, the CAGR is projected to increase slightly to 10.9% in the first half and followed by a slight drop at 10.6% in the second half.

Key Industry Highlights

Increasing Focus on Spatial Biology is likely to Fuel Multiplex Biomarker Imaging Market Growth

A key development in the market is a greater emphasis on spatial biology. Spatial biology studies the spatial connections between cells in their natural tissue settings, providing valuable insights into cellular interactions and microenvironments.

This trend is being driven by a growing understanding that the geographical context of biomarkers is important for appropriately interpreting biological processes and diseases.

Technological breakthroughs in imaging systems now enable high resolution, multi dimensional viewing of tissue samples, recording the precise position and interplay of several biomarkers at once.

This skill is especially important for cancer research, since understanding tumor heterogeneity and the spatial dynamics of the tumor microenvironment might lead to more effective therapies.

The use of spatial biology techniques is likely to increase, providing researchers with new tools for uncovering complicated biological insights, ultimately boosting precision medicine and individualized treatment approaches.

Complexity and Cost of Advanced Imaging Technology is likely to Stifle the Multiplex Biomarker Imaging Market Growth

A key impediment to the market is the complexity and cost of establishing and maintaining sophisticated imaging technology. While the systems have unique capabilities for analyzing many biomarkers at the same time, their installation, operation, and maintenance need specialized skills and resources, which can be difficult for smaller research laboratories and healthcare organizations with limited funds.

Interpreting multiplex imaging data can be complex and time consuming, requiring expert individuals and powerful computational resources. This complexity may impede broad acceptance and use of this imaging methods, especially in resource constrained environments.

Regulatory constraints and reimbursement concerns may stymie industry expansion. Complying with regulatory regulations and obtaining reimbursement for this imaging method can be difficult, causing delays in uptake and investment.

Addressing the constraints is critical for realizing the full potential of this imaging technique and their advantages in biological research and patient care.

Personalized Medicine is key Driver Propelling the Industry Growth

The growing desire for personalized medicine is a significant driver of the multiplex biomarker imaging industry. As healthcare moves toward more personalized treatments, the necessity for precise diagnostic tools grows.

Multiplex biomarker imaging enables the simultaneous analysis of several biomarkers within tissue samples, resulting in deep insights into disease pathology and patient specific molecular profiles.

This technique allows doctors to personalize treatments based on each patient unique biomarker expression patterns, enhancing therapeutic results while decreasing the chance of adverse responses.

The increased acknowledgment of potential advantages of personalized medicine, along with developments in multiplex biomarker imaging technologies, is boosting use of the tools in a variety of healthcare settings, supporting industry growth and innovation.

2020 to 2025 Global Multiplex Biomarker Imaging Sales Outlook Compared to Demand Forecast from 2025 to 2035

Global multiplex biomarker imaging demand increased at a CAGR of 9.7% from 2020 to 2025. For the next ten years (2025 to 2035), projections are that expenditure on multiplex biomarker imaging will reach a CAGR of 10.8%.

From 2020 to 2025, the global multiplex biomarker imaging industry showed strong growth, owing to increased application in research laboratories and clinical settings.

During this period, advancements in imaging technology and a greater emphasis on customized therapy drove industry growth. Companies spent substantially in research and development to improve their product offerings, resulting in an increase in multiplex biomarker imaging industry size.

From 2025 to 2035, demand for multiplex biomarker imaging is predicted to rise further. With continuous technological breakthroughs and rising applications in cancer, immunology, and neurology, the industry is anticipated to show positive growth prospects.

The growing trend of incorporating artificial intelligence and machine learning into imaging systems is expected to increase the multiplex biomarker imaging industry size, allowing for more efficient data processing and interpretation.

AI driven analytics and high resolution imaging are two examples of imaging technology advancements that improve precision and efficiency. The growing desire for individualized therapy is driving the need for thorough biomarker analysis.

Increased investment in cancer research and medication development, as well as the growing use of multiplex imaging in neurology and immunology, are driving the market growth.

Cooperation between academic institutions and biotech corporations spur research, while favorable regulatory regimes facilitate commercial development. Multiplex biomarker imaging industry future outlook remains positive, with continuous innovation and increased acceptance.

Market Concentration

Tier 1 firms dominate the multiplex biomarker imaging industry, accounting for 58.70% of the total. The established industry leaders have considerable expertise, strong research and development skills, and a diverse portfolio of sophisticated imaging technologies.

Companies in this tier, including PerkinElmer, Akoya Biosciences, and Bio Techne, have established strong brand recognition and global distribution networks, allowing them to maintain their industry leadership position.

Tier 2 players, on the other hand, account for 22.50% of the industry. While not as dominating as Tier 1 companies, the corporations continue to play an important role in stimulating innovation and competitiveness in the sector.

Tier 2 players frequently specialize in niche markets or provide complementary products and services that address specific client demands. Tier 2 firms contribute to industry variety by focusing on niche areas, giving clients more alternatives for multiplex biomarker imaging solutions.

Country-wise Insights

The section below discusses the industry analysis for the multiplex biomarker imaging industry in numerous nations. The report includes industry demand information for important nations in numerous areas of the world, including North America, Asia Pacific, Europe, and others.

Canada is expected to remain the leader in North America, with a CAGR of 11.4% by 2035. In Asia Pacific, China is expected to grow at a 12.3% CAGR by 2035.

Countries CAGR 2025 to 2035
China 12.3%
India 11.7%
Italy 10.3%
Canada 11.4%
The United States 10.3%

Integration of Digital Pathology and Telemedicine is likely to Drive the Industry in China

China is projected to ascend at a CAGR of 12.3% during the forecast period. The introduction of digital pathology and telemedicine is fuelling the multiplex biomarker imaging market in China.

As the government invests in healthcare infrastructure and technology, digital pathology provides considerable benefits in terms of diagnosis accuracy, remote consultations, and seamless collaboration between pathologists and researchers across geographical borders.

Telemedicine systems use digital pathology to give access to expert views and specialized diagnostic services in rural locations, therefore improving patient outcomes and eliminating healthcare inequities.

In the context of multiplex biomarker imaging, digital pathology allows for the rapid processing and interpretation of complicated imaging data, notably in cancer and infectious illnesses.

The integration of digital pathology and telemedicine into healthcare ecosystem of China is accelerating the implementation of the technologies, resulting in industry growth and innovation in the sector. This development highlights the revolutionary potential of digital technology for enhancing precision medicine and improving healthcare delivery in China.

Integration of Artificial Intelligence and Machine Learning is likely to Boost Demand in the United States

The United States is predicted to augment at a CAGR of 10.3% during the projected period. The combination of artificial intelligence and machine learning is expected to greatly boost the industry in the United States.

Artificial intelligence and machine learning technologies improve the processing and interpretation of complicated biomarker data, resulting in unparalleled precision and efficiency. The powerful algorithms can identify, quantify, and classify biomarkers in imaging data, decreasing human error and speeding up diagnostic procedures.

AI powered image analysis systems can rapidly process enormous datasets, offering precise insights into disease processes and patient reactions. This skill is key in personalized medicine, where individualized therapies are based on thorough biomarker profiles.

AI and machine learning make this easier to build predictive models, which help in early illness identification and prediction.

The rising acceptance of artificial intelligence and machine learning in healthcare, backed up by significant investments and technical breakthroughs, assures their key role in driving the multiplex biomarker imaging market.

Advancements in Imaging Technologies are propelling the Industry Demand in Italy

Italy is expected to thrive at a CAGR of 10.3% during the assessment period. Imaging technology advancements are driving growth multiplex biomarker imaging market in Italy.

The dynamic biomedical research sector and strong healthcare infrastructure in Italy are creating an environment that encourages innovation and adoption of cutting edge imaging technologies.

With ongoing advances in high resolution microscopy, improved multiplexing methods, and automation, Italian researchers and clinicians can now perform complete biomarker analyses with unparalleled precision and efficiency.

The new imaging technologies allow for precise geographic and quantitative examination of biomarkers, yielding essential insights into disease causes, patient responses to therapy, and the creation of individualized therapeutic regimens.

The use of artificial intelligence and machine learning algorithms improves data processing and interpretation, accelerating the implementation of multiplex biomarker imaging in both research and clinical settings throughout Italy.

The industry in Italy is rapidly expanding, driven by a strong need for novel imaging solutions to promote biomedical research and improve patient care.

Category-Wise Insights

This section offers information on the dominant segments of the multiplex biomarker imaging market. By component type, the research category held an industry share of 83% in 2025. The IHC Assay sector held an industry share of 61.1% in 2025.

The Research Segment Take the Lead in the Multiplex Biomarker Imaging Market

Application Research
Value Share (2025) 83%

The research category is expected to lead the industry by 2025, accounting for 83%. This growth is due to the growing need for better imaging technologies in biomedical research settings. Researchers use multiplex biomarker imaging systems to understand complicated biological processes, analyze disease causes, and discover new treatment strategies.

The imaging devices accuracy and adaptability make them valuable instruments in laboratories across the world. As research efforts develop, backed by increased funding and partnerships, the research category is likely to maintain their dominance in the multiplex biomarker imaging industry.

The IHC Assay Segment Drives the Multiplex Biomarker Imaging Market Growth

Imaging Technique IHC Assay
Value Share (2025) 61.1%

In 2025, the IHC Assay segment is predicted to lead the industry, with a industry share of 61.1%. This growth is a reflection of the importance of IHC assay in accurately detecting and localizing particular cellular components within tissue samples. IHC assays are popular for thorough tissue investigation in research and clinical diagnosis.

Continuous advances in IHC technology, such as greater multiplexing capabilities and automation, are key drivers of multiplex biomarker imaging market size.

The advancements increase the accuracy, speed, and scalability of IHC assays, making them essential tools in oncology for tumor profiling and personalized medicine for customizing therapies to specific patient profiles.

The growing use of IHC assays by pharmaceutical corporations and academic organizations emphasizes their significance in biomarker research and precision medicine.
Competitive Landscape

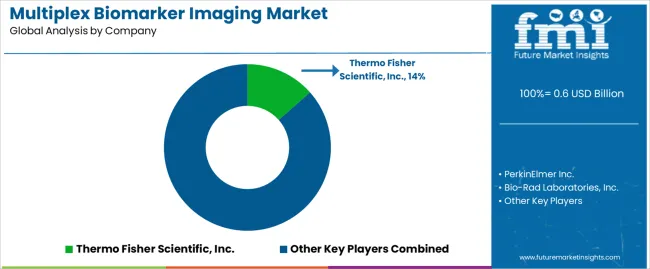
Multiplex Biomarker Imaging Market Analysis By Company

The multiplex biomarker imaging market competitive landscape is mildly competitive, with top companies pushing innovation. Potential investment opportunities in multiplex biomarker imaging technology and service providers with applications ranging from cancer to immunology and neurology.

Emerging players and strategic collaborations ratchet up competition, pushing the limits of precision medicine and driving fast advances in biomarker detection and analysis.

Company websites and investor presentations of leading players in the industry are anticipated to bring industry investment potential, which will in turn help the key players face multiplex biomarker imaging industry challenges. This will also boost the leading players in the industry and their industry share.

Recent Industry Developments

  • In May 2025, llumina Inc. announced that part of their latest research would be presented at the American Society of Clinical Oncology (ASCO) Annual Meeting in Chicago from May 31 to June 4. Highlights include data from several studies in partnership with Labcorp, demonstrating additional evidence to support the use of comprehensive genomic profiling (CGP) over single gene testing (SGT) and the most recent data supporting the development of Illumina's molecular residual disease (MRD) assay, which is currently underway in collaboration with major In all, Illumina had 14 abstracts accepted for the conference.
  • In April 2025, Merck intends to purchase Mirus Bio for USD 600 million. Mirus Bio, based in Madison, Wisconsin, focuses on the development and sale of transfection reagents. Transfection reagents, including Mirus Bio's TransIT-VirusGEN®, help genetic material enter cells. The compounds are essential in the creation of viral vectors for cell and gene therapies.

Leading Multiplex Biomarker Imaging Brands

  • PerkinElmer Inc.
  • Thermo Fisher Scientific, Inc.
  • Bio-Rad Laboratories, Inc.
  • Abcam plc.
  • Merck KGaA
  • Illumina Inc.
  • Leica BiosystemsNussloch GmbH
  • Ventana Medical Systems, Inc.
  • AushonBioSystems Ltd.
  • MicroConstants, Inc.
  • ToposNomos Ltd.

Key Segments of the Report

By Component Type:

The multiplex biomarker imagining industry is classified into instruments (quantitative pathology imaging system, immunofluorescence, multispectral imaging system and toponome imaging system), software and services (installation and integration services and maintenance services).

By Imaging Technique:

The multiplex biomarker imagining industry is classified into Immunohistochemistry (IHC) Assay, Fluorescent in Situ Hybridization (FISH) Assay and Tissue Microarray (TMA) Assay).

By Application:

The multiplex biomarker imagining industry is classified into research and clinical diagnostics.

By End User:

The multiplex biomarker imagining industry is classified into translation laboratories, biopharmaceutical companies and academic institutes.

By Region:

Analysis of the multiplex biomarker imagining industry has been carried out in key countries of North America, Latin America, Western Europe, South Asia, East Asia, Eastern Europe and Middle East & Africa.

Frequently Asked Questions

How big is the multiplex biomarker imaging market in 2025?

The global multiplex biomarker imaging market is estimated to be valued at USD 0.6 billion in 2025.

What will be the size of multiplex biomarker imaging market in 2035?

The market size for the multiplex biomarker imaging market is projected to reach USD 1.6 billion by 2035.

How much will be the multiplex biomarker imaging market growth between 2025 and 2035?

The multiplex biomarker imaging market is expected to grow at a 10.8% CAGR between 2025 and 2035.

What are the key product types in the multiplex biomarker imaging market?

The key product types in multiplex biomarker imaging market are instruments, software and services.

Which imaging technique segment to contribute significant share in the multiplex biomarker imaging market in 2025?

In terms of imaging technique, immunohistochemistry (ihc) assay segment to command 44.0% share in the multiplex biomarker imaging market in 2025.

Table of Content

  1. Executive Summary
    • Global Market Outlook
    • Demand to side Trends
    • Supply to side Trends
    • Technology Roadmap Analysis
    • Analysis and Recommendations
  2. Market Overview
    • Market Coverage / Taxonomy
    • Market Definition / Scope / Limitations
  3. Market Background
    • Market Dynamics
      • Drivers
      • Restraints
      • Opportunity
      • Trends
    • Scenario Forecast
      • Demand in Optimistic Scenario
      • Demand in Likely Scenario
      • Demand in Conservative Scenario
    • Opportunity Map Analysis
    • Product Life Cycle Analysis
    • Supply Chain Analysis
    • Investment Feasibility Matrix
    • Value Chain Analysis
    • PESTLE and Porter’s Analysis
    • Regulatory Landscape
    • Regional Parent Market Outlook
    • Production and Consumption Statistics
    • Import and Export Statistics
  4. Global Market Analysis 2020 to 2024 and Forecast, 2025 to 2035
    • Historical Market Size Value (USD Million) Analysis, 2020 to 2024
    • Current and Future Market Size Value (USD Million) Projections, 2025 to 2035
      • Y to o to Y Growth Trend Analysis
      • Absolute $ Opportunity Analysis
  5. Global Market Pricing Analysis 2020 to 2024 and Forecast 2025 to 2035
  6. Global Market Analysis 2020 to 2024 and Forecast 2025 to 2035, By Component Type
    • Introduction / Key Findings
    • Historical Market Size Value (USD Million) Analysis By Component Type , 2020 to 2024
    • Current and Future Market Size Value (USD Million) Analysis and Forecast By Component Type , 2025 to 2035
      • Instruments
      • Software
      • Services
    • Y to o to Y Growth Trend Analysis By Component Type , 2020 to 2024
    • Absolute $ Opportunity Analysis By Component Type , 2025 to 2035
  7. Global Market Analysis 2020 to 2024 and Forecast 2025 to 2035, By Imaging Technique
    • Introduction / Key Findings
    • Historical Market Size Value (USD Million) Analysis By Imaging Technique, 2020 to 2024
    • Current and Future Market Size Value (USD Million) Analysis and Forecast By Imaging Technique, 2025 to 2035
      • Immunohistochemistry (IHC) Assay
      • Fluorescent In Situ Hybridization (FISH) Assay
      • Tissue Microarray (TMA) Assay
    • Y to o to Y Growth Trend Analysis By Imaging Technique, 2020 to 2024
    • Absolute $ Opportunity Analysis By Imaging Technique, 2025 to 2035
  8. Global Market Analysis 2020 to 2024 and Forecast 2025 to 2035, By Application
    • Introduction / Key Findings
    • Historical Market Size Value (USD Million) Analysis By Application, 2020 to 2024
    • Current and Future Market Size Value (USD Million) Analysis and Forecast By Application, 2025 to 2035
      • Research
      • Clinical Diagnostics
    • Y to o to Y Growth Trend Analysis By Application, 2020 to 2024
    • Absolute $ Opportunity Analysis By Application, 2025 to 2035
  9. Global Market Analysis 2020 to 2024 and Forecast 2025 to 2035, By End User
    • Introduction / Key Findings
    • Historical Market Size Value (USD Million) Analysis By End User, 2020 to 2024
    • Current and Future Market Size Value (USD Million) Analysis and Forecast By End User, 2025 to 2035
      • Biopharmaceutical Companies
      • Translation Laboratories
      • Academic Institutes
    • Y to o to Y Growth Trend Analysis By End User, 2020 to 2024
    • Absolute $ Opportunity Analysis By End User, 2025 to 2035
  10. Global Market Analysis 2020 to 2024 and Forecast 2025 to 2035, By Region
    • Introduction
    • Historical Market Size Value (USD Million) Analysis By Region, 2020 to 2024
    • Current Market Size Value (USD Million) Analysis and Forecast By Region, 2025 to 2035
      • North America
      • Latin America
      • Western Europe
      • Eastern Europe
      • East Asia
      • South Asia and Pacific
      • Middle East & Africa
    • Market Attractiveness Analysis By Region
  11. North America Market Analysis 2020 to 2024 and Forecast 2025 to 2035, By Country
    • Historical Market Size Value (USD Million) Trend Analysis By Market Taxonomy, 2020 to 2024
    • Market Size Value (USD Million) Forecast By Market Taxonomy, 2025 to 2035
      • By Country
        • USA
        • Canada
        • Mexico
      • By Component Type
      • By Imaging Technique
      • By Application
      • By End User
    • Market Attractiveness Analysis
      • By Country
      • By Component Type
      • By Imaging Technique
      • By Application
      • By End User
    • Key Takeaways
  12. Latin America Market Analysis 2020 to 2024 and Forecast 2025 to 2035, By Country
    • Historical Market Size Value (USD Million) Trend Analysis By Market Taxonomy, 2020 to 2024
    • Market Size Value (USD Million) Forecast By Market Taxonomy, 2025 to 2035
      • By Country
        • Brazil
        • Chile
        • Rest of Latin America
      • By Component Type
      • By Imaging Technique
      • By Application
      • By End User
    • Market Attractiveness Analysis
      • By Country
      • By Component Type
      • By Imaging Technique
      • By Application
      • By End User
    • Key Takeaways
  13. Western Europe Market Analysis 2020 to 2024 and Forecast 2025 to 2035, By Country
    • Historical Market Size Value (USD Million) Trend Analysis By Market Taxonomy, 2020 to 2024
    • Market Size Value (USD Million) Forecast By Market Taxonomy, 2025 to 2035
      • By Country
        • Germany
        • UK
        • Italy
        • Spain
        • France
        • Nordic
        • BENELUX
        • Rest of Western Europe
      • By Component Type
      • By Imaging Technique
      • By Application
      • By End User
    • Market Attractiveness Analysis
      • By Country
      • By Component Type
      • By Imaging Technique
      • By Application
      • By End User
    • Key Takeaways
  14. Eastern Europe Market Analysis 2020 to 2024 and Forecast 2025 to 2035, By Country
    • Historical Market Size Value (USD Million) Trend Analysis By Market Taxonomy, 2020 to 2024
    • Market Size Value (USD Million) Forecast By Market Taxonomy, 2025 to 2035
      • By Country
        • Russia
        • Poland
        • Hungary
        • Balkan & Baltic
        • Rest of Eastern Europe
      • By Component Type
      • By Imaging Technique
      • By Application
      • By End User
    • Market Attractiveness Analysis
      • By Country
      • By Component Type
      • By Imaging Technique
      • By Application
      • By End User
    • Key Takeaways
  15. East Asia Market Analysis 2020 to 2024 and Forecast 2025 to 2035, By Country
    • Historical Market Size Value (USD Million) Trend Analysis By Market Taxonomy, 2020 to 2024
    • Market Size Value (USD Million) Forecast By Market Taxonomy, 2025 to 2035
      • By Country
        • China
        • Japan
        • South Korea
      • By Component Type
      • By Imaging Technique
      • By Application
      • By End User
    • Market Attractiveness Analysis
      • By Country
      • By Component Type
      • By Imaging Technique
      • By Application
      • By End User
    • Key Takeaways
  16. South Asia and Pacific Market Analysis 2020 to 2024 and Forecast 2025 to 2035, By Country
    • Historical Market Size Value (USD Million) Trend Analysis By Market Taxonomy, 2020 to 2024
    • Market Size Value (USD Million) Forecast By Market Taxonomy, 2025 to 2035
      • By Country
        • India
        • ASEAN
        • Australia & New Zealand
        • Rest of South Asia and Pacific
      • By Component Type
      • By Imaging Technique
      • By Application
      • By End User
    • Market Attractiveness Analysis
      • By Country
      • By Component Type
      • By Imaging Technique
      • By Application
      • By End User
    • Key Takeaways
  17. Middle East & Africa Market Analysis 2020 to 2024 and Forecast 2025 to 2035, By Country
    • Historical Market Size Value (USD Million) Trend Analysis By Market Taxonomy, 2020 to 2024
    • Market Size Value (USD Million) Forecast By Market Taxonomy, 2025 to 2035
      • By Country
        • Kingdom of Saudi Arabia
        • Other GCC Countries
        • Turkiye
        • South Africa
        • Other African Union
        • Rest of Middle East & Africa
      • By Component Type
      • By Imaging Technique
      • By Application
      • By End User
    • Market Attractiveness Analysis
      • By Country
      • By Component Type
      • By Imaging Technique
      • By Application
      • By End User
    • Key Takeaways
  18. Key Countries Market Analysis
    • USA
      • Pricing Analysis
      • Market Share Analysis, 2024
        • By Component Type
        • By Imaging Technique
        • By Application
        • By End User
    • Canada
      • Pricing Analysis
      • Market Share Analysis, 2024
        • By Component Type
        • By Imaging Technique
        • By Application
        • By End User
    • Mexico
      • Pricing Analysis
      • Market Share Analysis, 2024
        • By Component Type
        • By Imaging Technique
        • By Application
        • By End User
    • Brazil
      • Pricing Analysis
      • Market Share Analysis, 2024
        • By Component Type
        • By Imaging Technique
        • By Application
        • By End User
    • Chile
      • Pricing Analysis
      • Market Share Analysis, 2024
        • By Component Type
        • By Imaging Technique
        • By Application
        • By End User
    • Germany
      • Pricing Analysis
      • Market Share Analysis, 2024
        • By Component Type
        • By Imaging Technique
        • By Application
        • By End User
    • UK
      • Pricing Analysis
      • Market Share Analysis, 2024
        • By Component Type
        • By Imaging Technique
        • By Application
        • By End User
    • Italy
      • Pricing Analysis
      • Market Share Analysis, 2024
        • By Component Type
        • By Imaging Technique
        • By Application
        • By End User
    • Spain
      • Pricing Analysis
      • Market Share Analysis, 2024
        • By Component Type
        • By Imaging Technique
        • By Application
        • By End User
    • France
      • Pricing Analysis
      • Market Share Analysis, 2024
        • By Component Type
        • By Imaging Technique
        • By Application
        • By End User
    • India
      • Pricing Analysis
      • Market Share Analysis, 2024
        • By Component Type
        • By Imaging Technique
        • By Application
        • By End User
    • ASEAN
      • Pricing Analysis
      • Market Share Analysis, 2024
        • By Component Type
        • By Imaging Technique
        • By Application
        • By End User
    • Australia & New Zealand
      • Pricing Analysis
      • Market Share Analysis, 2024
        • By Component Type
        • By Imaging Technique
        • By Application
        • By End User
    • China
      • Pricing Analysis
      • Market Share Analysis, 2024
        • By Component Type
        • By Imaging Technique
        • By Application
        • By End User
    • Japan
      • Pricing Analysis
      • Market Share Analysis, 2024
        • By Component Type
        • By Imaging Technique
        • By Application
        • By End User
    • South Korea
      • Pricing Analysis
      • Market Share Analysis, 2024
        • By Component Type
        • By Imaging Technique
        • By Application
        • By End User
    • Russia
      • Pricing Analysis
      • Market Share Analysis, 2024
        • By Component Type
        • By Imaging Technique
        • By Application
        • By End User
    • Poland
      • Pricing Analysis
      • Market Share Analysis, 2024
        • By Component Type
        • By Imaging Technique
        • By Application
        • By End User
    • Hungary
      • Pricing Analysis
      • Market Share Analysis, 2024
        • By Component Type
        • By Imaging Technique
        • By Application
        • By End User
    • Kingdom of Saudi Arabia
      • Pricing Analysis
      • Market Share Analysis, 2024
        • By Component Type
        • By Imaging Technique
        • By Application
        • By End User
    • Turkiye
      • Pricing Analysis
      • Market Share Analysis, 2024
        • By Component Type
        • By Imaging Technique
        • By Application
        • By End User
    • South Africa
      • Pricing Analysis
      • Market Share Analysis, 2024
        • By Component Type
        • By Imaging Technique
        • By Application
        • By End User
  19. Market Structure Analysis
    • Competition Dashboard
    • Competition Benchmarking
    • Market Share Analysis of Top Players
      • By Regional
      • By Component Type
      • By Imaging Technique
      • By Application
      • By End User
  20. Competition Analysis
    • Competition Deep Dive
      • Thermo Fisher Scientific, Inc.
        • Overview
        • Product Portfolio
        • Profitability by Market Segments (Product/Age /Sales Channel/Region)
        • Sales Footprint
        • Strategy Overview
          • Marketing Strategy
          • Product Strategy
          • Channel Strategy
      • PerkinElmer Inc.
      • Bio-Rad Laboratories, Inc.
      • Abcam plc.
      • Merck KGaA
      • Illumina Inc.
      • Leica Biosystems Nussloch GmbH
      • Ventana Medical Systems, Inc.
      • Aushon BioSystems Ltd.
      • MicroConstants, Inc.
      • ToposNomos Ltd.
  21. Assumptions & Acronyms Used
  22. Research Methodology

List of Tables

  • Table 1: Global Market Value (USD Million) Forecast by Region, 2020 to 2035
  • Table 2: Global Market Value (USD Million) Forecast by Component Type , 2020 to 2035
  • Table 3: Global Market Value (USD Million) Forecast by Imaging Technique, 2020 to 2035
  • Table 4: Global Market Value (USD Million) Forecast by Application, 2020 to 2035
  • Table 5: Global Market Value (USD Million) Forecast by End User, 2020 to 2035
  • Table 6: North America Market Value (USD Million) Forecast by Country, 2020 to 2035
  • Table 7: North America Market Value (USD Million) Forecast by Component Type , 2020 to 2035
  • Table 8: North America Market Value (USD Million) Forecast by Imaging Technique, 2020 to 2035
  • Table 9: North America Market Value (USD Million) Forecast by Application, 2020 to 2035
  • Table 10: North America Market Value (USD Million) Forecast by End User, 2020 to 2035
  • Table 11: Latin America Market Value (USD Million) Forecast by Country, 2020 to 2035
  • Table 12: Latin America Market Value (USD Million) Forecast by Component Type , 2020 to 2035
  • Table 13: Latin America Market Value (USD Million) Forecast by Imaging Technique, 2020 to 2035
  • Table 14: Latin America Market Value (USD Million) Forecast by Application, 2020 to 2035
  • Table 15: Latin America Market Value (USD Million) Forecast by End User, 2020 to 2035
  • Table 16: Western Europe Market Value (USD Million) Forecast by Country, 2020 to 2035
  • Table 17: Western Europe Market Value (USD Million) Forecast by Component Type , 2020 to 2035
  • Table 18: Western Europe Market Value (USD Million) Forecast by Imaging Technique, 2020 to 2035
  • Table 19: Western Europe Market Value (USD Million) Forecast by Application, 2020 to 2035
  • Table 20: Western Europe Market Value (USD Million) Forecast by End User, 2020 to 2035
  • Table 21: Eastern Europe Market Value (USD Million) Forecast by Country, 2020 to 2035
  • Table 22: Eastern Europe Market Value (USD Million) Forecast by Component Type , 2020 to 2035
  • Table 23: Eastern Europe Market Value (USD Million) Forecast by Imaging Technique, 2020 to 2035
  • Table 24: Eastern Europe Market Value (USD Million) Forecast by Application, 2020 to 2035
  • Table 25: Eastern Europe Market Value (USD Million) Forecast by End User, 2020 to 2035
  • Table 26: East Asia Market Value (USD Million) Forecast by Country, 2020 to 2035
  • Table 27: East Asia Market Value (USD Million) Forecast by Component Type , 2020 to 2035
  • Table 28: East Asia Market Value (USD Million) Forecast by Imaging Technique, 2020 to 2035
  • Table 29: East Asia Market Value (USD Million) Forecast by Application, 2020 to 2035
  • Table 30: East Asia Market Value (USD Million) Forecast by End User, 2020 to 2035
  • Table 31: South Asia and Pacific Market Value (USD Million) Forecast by Country, 2020 to 2035
  • Table 32: South Asia and Pacific Market Value (USD Million) Forecast by Component Type , 2020 to 2035
  • Table 33: South Asia and Pacific Market Value (USD Million) Forecast by Imaging Technique, 2020 to 2035
  • Table 34: South Asia and Pacific Market Value (USD Million) Forecast by Application, 2020 to 2035
  • Table 35: South Asia and Pacific Market Value (USD Million) Forecast by End User, 2020 to 2035
  • Table 36: Middle East & Africa Market Value (USD Million) Forecast by Country, 2020 to 2035
  • Table 37: Middle East & Africa Market Value (USD Million) Forecast by Component Type , 2020 to 2035
  • Table 38: Middle East & Africa Market Value (USD Million) Forecast by Imaging Technique, 2020 to 2035
  • Table 39: Middle East & Africa Market Value (USD Million) Forecast by Application, 2020 to 2035
  • Table 40: Middle East & Africa Market Value (USD Million) Forecast by End User, 2020 to 2035

List of Figures

  • Figure 1: Global Market Pricing Analysis
  • Figure 2: Global Market Value (USD Million) Forecast 2020-2035
  • Figure 3: Global Market Value Share and BPS Analysis by Component Type , 2025 and 2035
  • Figure 4: Global Market Y to o to Y Growth Comparison by Component Type , 2025-2035
  • Figure 5: Global Market Attractiveness Analysis by Component Type
  • Figure 6: Global Market Value Share and BPS Analysis by Imaging Technique, 2025 and 2035
  • Figure 7: Global Market Y to o to Y Growth Comparison by Imaging Technique, 2025-2035
  • Figure 8: Global Market Attractiveness Analysis by Imaging Technique
  • Figure 9: Global Market Value Share and BPS Analysis by Application, 2025 and 2035
  • Figure 10: Global Market Y to o to Y Growth Comparison by Application, 2025-2035
  • Figure 11: Global Market Attractiveness Analysis by Application
  • Figure 12: Global Market Value Share and BPS Analysis by End User, 2025 and 2035
  • Figure 13: Global Market Y to o to Y Growth Comparison by End User, 2025-2035
  • Figure 14: Global Market Attractiveness Analysis by End User
  • Figure 15: Global Market Value (USD Million) Share and BPS Analysis by Region, 2025 and 2035
  • Figure 16: Global Market Y to o to Y Growth Comparison by Region, 2025-2035
  • Figure 17: Global Market Attractiveness Analysis by Region
  • Figure 18: North America Market Incremental Dollar Opportunity, 2025-2035
  • Figure 19: Latin America Market Incremental Dollar Opportunity, 2025-2035
  • Figure 20: Western Europe Market Incremental Dollar Opportunity, 2025-2035
  • Figure 21: Eastern Europe Market Incremental Dollar Opportunity, 2025-2035
  • Figure 22: East Asia Market Incremental Dollar Opportunity, 2025-2035
  • Figure 23: South Asia and Pacific Market Incremental Dollar Opportunity, 2025-2035
  • Figure 24: Middle East & Africa Market Incremental Dollar Opportunity, 2025-2035
  • Figure 25: North America Market Value Share and BPS Analysis by Country, 2025 and 2035
  • Figure 26: North America Market Value Share and BPS Analysis by Component Type , 2025 and 2035
  • Figure 27: North America Market Y to o to Y Growth Comparison by Component Type , 2025-2035
  • Figure 28: North America Market Attractiveness Analysis by Component Type
  • Figure 29: North America Market Value Share and BPS Analysis by Imaging Technique, 2025 and 2035
  • Figure 30: North America Market Y to o to Y Growth Comparison by Imaging Technique, 2025-2035
  • Figure 31: North America Market Attractiveness Analysis by Imaging Technique
  • Figure 32: North America Market Value Share and BPS Analysis by Application, 2025 and 2035
  • Figure 33: North America Market Y to o to Y Growth Comparison by Application, 2025-2035
  • Figure 34: North America Market Attractiveness Analysis by Application
  • Figure 35: North America Market Value Share and BPS Analysis by End User, 2025 and 2035
  • Figure 36: North America Market Y to o to Y Growth Comparison by End User, 2025-2035
  • Figure 37: North America Market Attractiveness Analysis by End User
  • Figure 38: Latin America Market Value Share and BPS Analysis by Country, 2025 and 2035
  • Figure 39: Latin America Market Value Share and BPS Analysis by Component Type , 2025 and 2035
  • Figure 40: Latin America Market Y to o to Y Growth Comparison by Component Type , 2025-2035
  • Figure 41: Latin America Market Attractiveness Analysis by Component Type
  • Figure 42: Latin America Market Value Share and BPS Analysis by Imaging Technique, 2025 and 2035
  • Figure 43: Latin America Market Y to o to Y Growth Comparison by Imaging Technique, 2025-2035
  • Figure 44: Latin America Market Attractiveness Analysis by Imaging Technique
  • Figure 45: Latin America Market Value Share and BPS Analysis by Application, 2025 and 2035
  • Figure 46: Latin America Market Y to o to Y Growth Comparison by Application, 2025-2035
  • Figure 47: Latin America Market Attractiveness Analysis by Application
  • Figure 48: Latin America Market Value Share and BPS Analysis by End User, 2025 and 2035
  • Figure 49: Latin America Market Y to o to Y Growth Comparison by End User, 2025-2035
  • Figure 50: Latin America Market Attractiveness Analysis by End User
  • Figure 51: Western Europe Market Value Share and BPS Analysis by Country, 2025 and 2035
  • Figure 52: Western Europe Market Value Share and BPS Analysis by Component Type , 2025 and 2035
  • Figure 53: Western Europe Market Y to o to Y Growth Comparison by Component Type , 2025-2035
  • Figure 54: Western Europe Market Attractiveness Analysis by Component Type
  • Figure 55: Western Europe Market Value Share and BPS Analysis by Imaging Technique, 2025 and 2035
  • Figure 56: Western Europe Market Y to o to Y Growth Comparison by Imaging Technique, 2025-2035
  • Figure 57: Western Europe Market Attractiveness Analysis by Imaging Technique
  • Figure 58: Western Europe Market Value Share and BPS Analysis by Application, 2025 and 2035
  • Figure 59: Western Europe Market Y to o to Y Growth Comparison by Application, 2025-2035
  • Figure 60: Western Europe Market Attractiveness Analysis by Application
  • Figure 61: Western Europe Market Value Share and BPS Analysis by End User, 2025 and 2035
  • Figure 62: Western Europe Market Y to o to Y Growth Comparison by End User, 2025-2035
  • Figure 63: Western Europe Market Attractiveness Analysis by End User
  • Figure 64: Eastern Europe Market Value Share and BPS Analysis by Country, 2025 and 2035
  • Figure 65: Eastern Europe Market Value Share and BPS Analysis by Component Type , 2025 and 2035
  • Figure 66: Eastern Europe Market Y to o to Y Growth Comparison by Component Type , 2025-2035
  • Figure 67: Eastern Europe Market Attractiveness Analysis by Component Type
  • Figure 68: Eastern Europe Market Value Share and BPS Analysis by Imaging Technique, 2025 and 2035
  • Figure 69: Eastern Europe Market Y to o to Y Growth Comparison by Imaging Technique, 2025-2035
  • Figure 70: Eastern Europe Market Attractiveness Analysis by Imaging Technique
  • Figure 71: Eastern Europe Market Value Share and BPS Analysis by Application, 2025 and 2035
  • Figure 72: Eastern Europe Market Y to o to Y Growth Comparison by Application, 2025-2035
  • Figure 73: Eastern Europe Market Attractiveness Analysis by Application
  • Figure 74: Eastern Europe Market Value Share and BPS Analysis by End User, 2025 and 2035
  • Figure 75: Eastern Europe Market Y to o to Y Growth Comparison by End User, 2025-2035
  • Figure 76: Eastern Europe Market Attractiveness Analysis by End User
  • Figure 77: East Asia Market Value Share and BPS Analysis by Country, 2025 and 2035
  • Figure 78: East Asia Market Value Share and BPS Analysis by Component Type , 2025 and 2035
  • Figure 79: East Asia Market Y to o to Y Growth Comparison by Component Type , 2025-2035
  • Figure 80: East Asia Market Attractiveness Analysis by Component Type
  • Figure 81: East Asia Market Value Share and BPS Analysis by Imaging Technique, 2025 and 2035
  • Figure 82: East Asia Market Y to o to Y Growth Comparison by Imaging Technique, 2025-2035
  • Figure 83: East Asia Market Attractiveness Analysis by Imaging Technique
  • Figure 84: East Asia Market Value Share and BPS Analysis by Application, 2025 and 2035
  • Figure 85: East Asia Market Y to o to Y Growth Comparison by Application, 2025-2035
  • Figure 86: East Asia Market Attractiveness Analysis by Application
  • Figure 87: East Asia Market Value Share and BPS Analysis by End User, 2025 and 2035
  • Figure 88: East Asia Market Y to o to Y Growth Comparison by End User, 2025-2035
  • Figure 89: East Asia Market Attractiveness Analysis by End User
  • Figure 90: South Asia and Pacific Market Value Share and BPS Analysis by Country, 2025 and 2035
  • Figure 91: South Asia and Pacific Market Value Share and BPS Analysis by Component Type , 2025 and 2035
  • Figure 92: South Asia and Pacific Market Y to o to Y Growth Comparison by Component Type , 2025-2035
  • Figure 93: South Asia and Pacific Market Attractiveness Analysis by Component Type
  • Figure 94: South Asia and Pacific Market Value Share and BPS Analysis by Imaging Technique, 2025 and 2035
  • Figure 95: South Asia and Pacific Market Y to o to Y Growth Comparison by Imaging Technique, 2025-2035
  • Figure 96: South Asia and Pacific Market Attractiveness Analysis by Imaging Technique
  • Figure 97: South Asia and Pacific Market Value Share and BPS Analysis by Application, 2025 and 2035
  • Figure 98: South Asia and Pacific Market Y to o to Y Growth Comparison by Application, 2025-2035
  • Figure 99: South Asia and Pacific Market Attractiveness Analysis by Application
  • Figure 100: South Asia and Pacific Market Value Share and BPS Analysis by End User, 2025 and 2035
  • Figure 101: South Asia and Pacific Market Y to o to Y Growth Comparison by End User, 2025-2035
  • Figure 102: South Asia and Pacific Market Attractiveness Analysis by End User
  • Figure 103: Middle East & Africa Market Value Share and BPS Analysis by Country, 2025 and 2035
  • Figure 104: Middle East & Africa Market Value Share and BPS Analysis by Component Type , 2025 and 2035
  • Figure 105: Middle East & Africa Market Y to o to Y Growth Comparison by Component Type , 2025-2035
  • Figure 106: Middle East & Africa Market Attractiveness Analysis by Component Type
  • Figure 107: Middle East & Africa Market Value Share and BPS Analysis by Imaging Technique, 2025 and 2035
  • Figure 108: Middle East & Africa Market Y to o to Y Growth Comparison by Imaging Technique, 2025-2035
  • Figure 109: Middle East & Africa Market Attractiveness Analysis by Imaging Technique
  • Figure 110: Middle East & Africa Market Value Share and BPS Analysis by Application, 2025 and 2035
  • Figure 111: Middle East & Africa Market Y to o to Y Growth Comparison by Application, 2025-2035
  • Figure 112: Middle East & Africa Market Attractiveness Analysis by Application
  • Figure 113: Middle East & Africa Market Value Share and BPS Analysis by End User, 2025 and 2035
  • Figure 114: Middle East & Africa Market Y to o to Y Growth Comparison by End User, 2025-2035
  • Figure 115: Middle East & Africa Market Attractiveness Analysis by End User
  • Figure 116: Global Market - Tier Structure Analysis
  • Figure 117: Global Market - Company Share Analysis
Dashboard
Dashboard
Dashboard
Dashboard
Dashboard
Dashboard

Full Research Suite comprises of:

Market outlook & trends analysis

Market outlook & trends analysis

Interviews & case studies

Interviews & case studies

Strategic recommendations

Strategic recommendations

Vendor profiles & capabilities analysis

Vendor profiles & capabilities analysis

5-year forecasts

5-year forecasts

8 regions and 60+ country-level data splits

8 regions and 60+ country-level data splits

Market segment data splits

Market segment data splits

12 months of continuous data updates

12 months of continuous data updates

DELIVERED AS:

PDF EXCEL ONLINE

Full Research Suite


$5000

$7500

$10000

Buy Report Now
Similar Industry Reports

Similar Industry Reports

Multiplex Protein Profiling Market

Multiplex Protein Profiling Market Size and Share Forecast Outlook 2025 to 2035

Multiplex PCR Assays Market

Multiplex PCR Assays Market Size and Share Forecast Outlook 2025 to 2035

Multiplex Molecular Diagnostics Market

Multiplex Molecular Diagnostics Market Size and Share Forecast Outlook 2025 to 2035

Multiplex Assay Market

Multiplex Assay Market

Multiplex Sepsis Biomarker Panels Market

Multiplex Sepsis Biomarker Panels Market Size and Share Forecast Outlook 2025 to 2035

Syndromic Multiplex Diagnostic Market

Syndromic Multiplex Diagnostic Market

Wavelength Division Multiplexing (WDM) Equipment Market

Wavelength Division Multiplexing (WDM) Equipment Market Analysis - Size, Growth, and Forecast 2025 to 2035

Biomarker-based Immunoassays Market

Biomarker-based Immunoassays Market Size and Share Forecast Outlook 2025 to 2035

Biomarker Discovery Outsourcing Service Market

Global Biomarker Discovery Outsourcing Service Market Analysis – Size, Share & Forecast 2024-2034

EPO Biomarkers Market

EPO Biomarkers Market Size and Share Forecast Outlook 2025 to 2035

ST2 Biomarker Market

ST2 Biomarker Market

Dual Biomarker Assays Market

Dual Biomarker Assays Market Analysis - Size, Share, & Forecast Outlook 2025 to 2035

PD-L1 Biomarker Testing Market

PD-L1 Biomarker Testing Market Report – Demand, Trends & Forecast 2025–2035

Brain Biomarker Market

Brain Biomarker Market Trends and Forecast 2025 to 2035

PD-L1 Biomarker Testing Market Share Analysis

Market Share Breakdown of PD-L1 Biomarker Testing Manufacturers

Renal Biomarker Market

Renal Biomarker Market Report – Trends & Forecast 2024-2034

Vitamin Biomarkers Market

Vitamin Biomarkers Market Size and Share Forecast Outlook 2025 to 2035

Cardiac Biomarker Diagnostic Test Kits Market

Cardiac Biomarker Diagnostic Test Kits Market Analysis – Trends & Forecast 2025 to 2035

Molecular Biomarkers For Cancer Detection Market

Molecular Biomarkers For Cancer Detection Market Size and Share Forecast Outlook 2025 to 2035

Prognostic Biomarkers Market

Prognostic Biomarkers Market

Future Market Insights

Multiplex Biomarker Imaging Market

Chat With MaRIA

Chat With

MaRIA

Hi There, I am MaRIA, Your Market Research Intelligence Assistant. How may I help you?