Tennis Equipment Market Size and Share Forecast Outlook 2025 to 2035

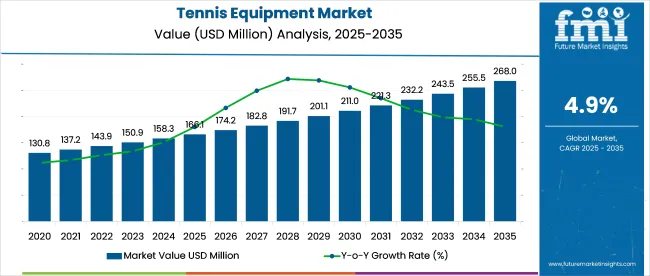
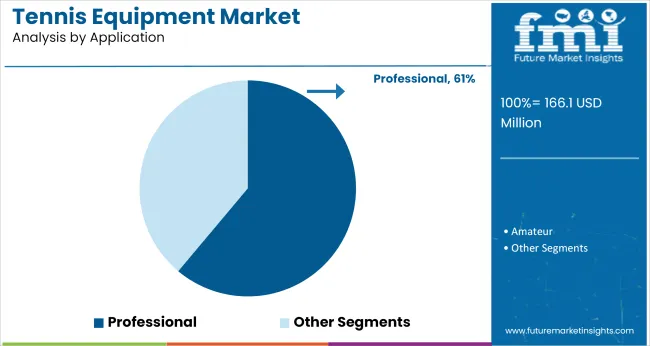
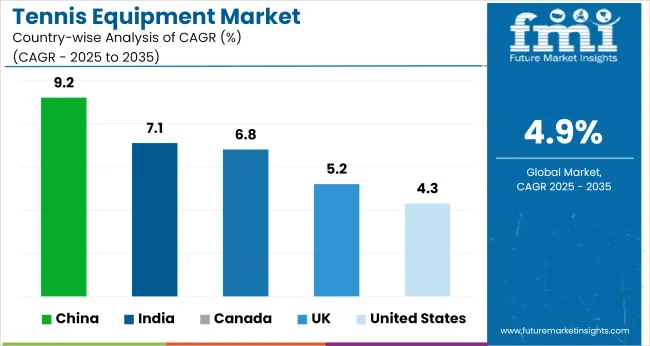
The global tennis equipment market is projected to expand from USD 166.1 million in 2025 to USD 265.8 million by 2035, growing at a CAGR of 4.9% during the forecast period. The United States is expected to remain dominant in the overall market in terms of value share, while China is anticipated to register the fastest growth from 2025 to 2035.

Market expansion is also being encouraged by the increasing demand for compact, high-efficiency sports gear that suits the fast-paced lifestyle of modern consumers. Performance-enhancing features such as smart sensors, AI-enabled swing analysis, and custom grip ergonomics have been steadily integrated into tennis products

. However, the market faces barriers such as high costs of premium products and seasonal sport adoption in certain geographies. Sustainability continues to emerge as a dominant theme, with consumers gravitating toward recyclable and biodegradable materials.

Additional emphasis is being placed on modular product design, allowing ease of upgrade and improved adaptability across varied playing conditions. Furthermore, long-term durability is being prioritized to enhance product value and reduce replacement frequency.

Looking ahead, innovation in eco-friendly tennis gear, supported by technological advancements like augmented reality previews and direct-to-consumer digital platforms, is projected to redefine the purchasing experience. Growth will also be sustained by increased investments in online retail channels and strategic collaborations between global sports brands and e-commerce giants.

As tennis increasingly becomes a lifestyle choice among urban millennials, manufacturers are expected to focus on product versatility, low environmental impact, and smart technology integration to meet evolving consumer expectations across all levels of play.

Greater emphasis is also being placed on customization features, with gear being designed to adapt to varied skill levels and court conditions. Enhanced post-purchase services are further being introduced to strengthen brand loyalty and consumer satisfaction.

Metric Value
Estimated Size (2025E) USD 166.1 million
Projected Value (2035F) USD 265.8 million
CAGR (2025 to 2035) 4.9%

Semi-Annual Market Update

The below table presents the expected CAGR for the tennis equipment industry over semi-annual periods spanning from 2025 to 2035.

Particular Value CAGR
H1 (2025 to 2035) 3.7%
H2 (2025 to 2035) 5.9%
H1 (2025 to 2035) 6.3%
H2 (2025 to 2035) 3.5%

The CAGR exhibits a fluctuating trend, initially increasing by 37 BPS from H1 (2024 to 2034) to H2 (2024 to 2034), indicating stronger growth momentum in the latter half. However, a slight increase of 63 BPS in H1 (2025 to 2035) suggests temporary market stabilization or external constraints. Growth rebounds in H2 (2025 to 2035) with a 35 BPS decrease, reflecting renewed demand or industry expansion. This pattern suggests cyclical variations, with stronger growth in the second half of each period, possibly driven by evolving market conditions and strategic investments.

Analyzing Tennis Equipment Market by Top Investment Segments

Rackets Dominate the Tennis Equipment Industry in Terms of Product Type

Product Type CAGR (2025 to 2035)
Racket 5.3%

The racket segment leads the tennis equipment market and is projected to grow at a compound annual growth rate (CAGR) of 5.3% from 2025 to 2035. This growth is fueled by rising adoption in casual households and amateur courts, where performance efficiency is a major priority. The increasing demand for durable and environmentally friendly gear further propels the expansion of this segment. Consumers prefer lightweight, durable rackets requiring minimal upkeep, so rackets have become a highly sought-after option nowadays. Manufacturers integrate smart features like swing connectivity and automatic tensioning, making rackets more convenient for modern users.

Online Retail Channels Dominate Sales of Tennis Equipment

Sales Channel CAGR (2025 to 2035)
Online Retail 8.2%

The online retail segment dominates the sales of tennis equipment and is projected to grow at a compound annual growth rate (CAGR) of 8.2% from 2025 to 2035. The convenience of doorstep delivery facilitates easy access to guides and wide product choices, thus accelerating online purchases rapidly every day. Consumers rely heavily on customer reviews and flexible payment options, making e-commerce platforms a preferred online shopping destination nowadays. Manufacturers’ shift towards direct-to-consumer sales substantially fortifies this particular sales pathwa,y allowing brands to offer bespoke models alongside comprehensive post-purchase support services. Partnerships between leading brands and e-commerce giants significantly enhance visibility accessibility promoting robust expansion of online sales.

Key Industry Highlights

Rising Demand for Compact and Smart Tennis Gear Drives Market Growth

The global tennis equipment market is experiencing significant growth rapidly nowadays because of the rising demand for performance-enhancing, durable solutions daily. Modern urban players prefer sleek rackets that fit snugly into active lifestyles in densely populated city settings. Luxury consumers tend to favor sleek tennis gear that features advanced swing analytics and superior comfort.

Manufacturers respond with sleek, multifunctional designs, enhancing convenience beneath remarkably high standards of playing performance. Sustainable gear is gaining rapid popularity, driving market growth through its low environmental impact and reduced production waste. Digital platforms offer augmented reality previews with personalized recommendations that boost buying experiences significantly, driving sales upward rapidly online.

Growing Popularity of Eco-Friendly and Durable Tennis Equipment Boosts Market Expansion

Sustainability efforts coupled with durability needs fuel demand for extremely eco-friendly tennis equipment units daily. Eco-conscious shoppers perceive sustainable gear as a savvy financial move that lowers costs beneath sprawling environmental programs. Globally, governments promote recyclable tennis balls, which significantly influence consumer purchasing habits on a daily basis.

Manufacturers integrate fairly sophisticated materials, low-impact technology, and enhanced grip mechanisms, appealing directly to environmentally conscious consumers. Sophisticated swing tracking systems, coupled with durable designs, become major distinguishing factors in some ways.

Eco-friendly gear is likely to drive market growth upward fairly rapidly over the next few years. Rising Focus on Convenience and Flexibility Drives Demand for Tennis Equipment. Players now prioritize flexibility in their gear, driving the adoption of super-lightweight rackets that prioritize ease of use and mobility. Unlike traditional equipment, these units offer easy customization, mobility, and compatibility with multiple playing styles, making them attractive for enthusiasts.

Innovations like ergonomic grips and foldable designs enhance product versatility in multiple ways, catering directly to diverse consumer needs. Active living trends accelerate market growth rapidly in urban areas as consumers opt for performance-driven sports solutions daily.

E-Commerce and Digital Platforms Revolutionize the Tennis Equipment Buying Experience

Digital platforms are transforming the tennis equipment market, offering seamless access through various online tools and expert reviews that are readily available everywhere. Digital stores offer numerous models at fixed prices with flexible payment plans, making high-end gear relatively affordable overall nowadays. Virtual product demos boost online shopping with AR-based gear previews and AI-driven personalized recommendations.

Social media has a significant impact on consumer behavior through highly targeted digital marketing campaigns and effective influencer partnerships, steadily boosting online sales. Doorstep delivery convenience and easy return policies will likely continue to fuel rapid e-commerce growth in the overall tennis equipment market segments.

Market Concentration

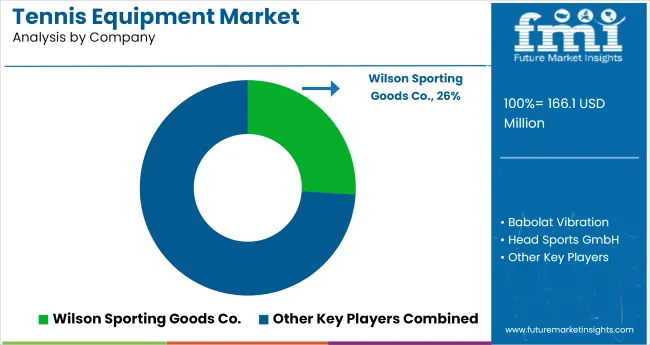
Tier-1 players dominate the global tennis equipment market, holding a 35-40% share. These firms capitalize on cutting-edge production methods, strong brand recognition, and sprawling international networks to maintain dominance. They prioritize novelty, offering smart-enabled, durable gear with cutting-edge features like AI-driven analytics and ergonomic designs, all while seamlessly. These brands cater to premium consumers who seek high-performance, durable gear. Notable Tier-1 players include Wilson, HEAD, Babolat, and Yonex.

Tier-2 companies account for 30-35% of the market and primarily serve mid-range consumers seeking reliable and affordable sporting solutions. These firms prioritize efficiency by incorporating durable materials and versatile designs in products suited for densely populated cities. They focus heavily on regional market expansion via partnerships with various retailers and numerous e-commerce platforms. Notable Tier-2 players include Dunlop, Prince, Tecnifibre, and Slazenger.

Tier-3 players operate in niche and budget-friendly segments, holding a 15-20% market share. They focus on compact, low-cost gear designed specifically for casual urban players and frugal buyers. These brands fiercely compete on price offering basic models with remarkably simple functionalities amidst decent overall quality levels. Notable Tier-3 players include Solinco, Gamma, Volkl, and various private-label brands on online marketplaces.

Per Capita Spending on Tennis Equipment - Top 5 Countries

Country United States
Market Share (%) 345.4
Estimated Per Capita Spending (USD) 4.3
Country France
Market Share (%) 68.2
Estimated Per Capita Spending (USD) 3.6
Country Japan
Market Share (%) 123.2
Estimated Per Capita Spending (USD) 7.2
Country United Kingdom
Market Share (%) 67.4
Estimated Per Capita Spending (USD) 3.5

United States

The US tennis equipment market, valued at USD 24.1 million, is driven by high consumer spending on sports gear, an increasing preference for smart and durable rackets, and a strong amateur and professional market. Urban consumers often favor lightweight gear with sleek designs, but premium buyers prefer smart-enabled models featuring swing analysis.

Germany

Germany’s tennis equipment market, valued at USD 11.5 million, benefits greatly from strong sustainable practices and durable habits. Eco-conscious consumers largely drive innovation in recyclable tennis balls due to their preference for eco-friendly gear. Lightweight models are gaining popularity amidst urban play trends and the space constraints found in many settings.

Japan

Japan’s tennis equipment market, valued at USD 4.5 million, thrives heavily on cutting-edge high-tech innovations alongside super-compact playing solutions. Many players have small practice spaces, so demand remains high for slim-profile rackets. Japanese consumers favor gear with sleek designs and numerous features that blend seamlessly into modern playing spaces, remaining discreet and unobtrusive.

France

France’s tennis equipment market, valued at USD 8.7 million, is driven by urbanization, growing rapidly amid an increasing number of amateur households and a strong preference for smart gear. French consumers adore ultra-sleek rackets that are beautifully integrated into modern play styles. Market insiders notice surprisingly robust interest in modular gear and those that adapt neatly across various courts.

United Kingdom

The UK tennis equipment market is valued at USD 13.3 million, driven largely by the increasing adoption of smart gear alongside fluctuations in the recreational market. Demand for eco-friendly, durable rackets increases rapidly in densely populated urban areas with smaller playing spaces. Consumers prefer remarkably adaptive gear featuring versatile designs and flexible performance capabilities to suit various needs.

Country-wise Insights

Country CAGR (2025 to 2035)
USA 4.3%
Canada 6.8%
UK 5.2%
China 9.2%
India 7.1%

USA: Convenience and Performance Efficiency Drive Market Growth

The US tennis equipment market is expected to experience rapid growth at a 4.3% CAGR from 2025, driven by increasing demand for durable gear. Urbanization fuels demand for active lifestyles, making tennis gear highly desirable in smaller courts nowadays.

Consumers prioritize durability and energy conservation amid government efforts to promote eco-friendly gear. Smart tech significantly impacts buying decisions as app-connected swing-tracking rackets gain popularity very rapidly online. Strong online retail platforms significantly boost market growth by facilitating consumer comparisons of features and providing easy access to nearby options.

UK: Sustainability and Amateur Play Boom Fuel Demand

The UK tennis equipment market is expected to expand rapidly at a compound annual growth rate (CAGR) of 5.2% over the next decade, driven by eco-conscious consumers. Manufacturers introduce recyclable ball models amidst rising concerns regarding waste reduction and energy efficiency requirements.

Casual play increases and likewise fuels demand since players generally prefer lightweight gear that facilitates easy transport. Younger buyers seek performance-driven solutions with modular adaptive rackets rapidly gaining traction in today's fast-paced lifestyle. E-commerce players offer at-home trials and flexible financing options for buyers through various online platforms nowadays.

India: Rising Disposable Incomes and Urbanization Propel Market Expansion

India’s tennis equipment market is projected to grow at a robust CAGR of 7.1% from 2025 to 2035, driven by rapid urbanization, the expansion of the middle class, and the increasing adoption of modern sports gear. Nuclear families, alongside rising disposable incomes, drive demand for convenient playing solutions that don’t require dedicated courts.

Growing awareness of fitness and durable gizmos fuels the emergence of tennis gear as a preferred alternative in urban hubs. The E-commerce boom has made these products extremely accessible through leading platforms offering enormous discounts under easy EMI options and doorstep services. Global brands eye the Indian market, introducing super lightweight racket models suited perfectly for local playing habits daily.

Competitive Outlook

The global tennis equipment market is highly competitive, with key players such as Wilson, HEAD, Babolat, Yonex, and Dunlop dominating the industry through innovation, durability, and the integration of advanced technology. Wilson is a leading brand recognized for its lightweight operation and cutting-edge, durable rackets, particularly its Clash technology, which enhances power and reduces strain. HEAD stands out with its smart racket features, including sensor-based analytics and app connectivity, catering to tech-savvy consumers looking for performance.

Apart from these major brands, emerging players such as Solinco and Gamma are redefining the market with affordable and performance-driven solutions, targeting casual households and urban consumers. Solinco specializes in lightweight, durable rackets with intuitive designs and quick adaptability, making them ideal for enthusiasts. Gamma, on the other hand, focuses on budget-friendly models with high-tension strings, eliminating the need for frequent restringing and enhancing durability.

The market is witnessing a strong shift toward eco-friendly and smart-enabled gear, with brands investing in sensor-powered analytics, material optimization, and ergonomic compatibility. Sustainability and eco-friendly initiatives also play a crucial role, as manufacturers develop recyclable ball gear and introduce biodegradable string compatibility to align with growing environmental concerns.

Recent Industry Developments in the Tennis Equipment Market

  • January 2025: Wilson Unveils AI-Powered Tennis Racket

Wilson introduced a new AI-powered tennis racket that optimizes swing and power based on the player style and court level. This innovation enhances efficiency and sustainability, catering to the growing demand for smart sports gear with eco-friendly features.

  • March 2024: HEAD Expands Lightweight Racket Line with Smart Connectivity

HEAD expanded its range of lightweight rackets by introducing models with app connectivity and swing assistant integration. These rackets enable users to track their swings remotely via a mobile app, enhancing performance for both casual gamers and professional players on pro courts.

  • May 2024: Babolat Launches Durable Tennis Gear with UV Protection

Babolat launched a durable tennis racket featuring UV protection technology to extend life and strength, ensuring a more reliable hit. This development aligns with rising consumer concerns about longevity and fitness-conscious sports gear.

Report Coverage for Tennis Equipment Market

Report Attributes Details
Current Total Market Size (2025) USD 166.1 million
Projected Market Size (2035) USD 265.8 million
Overall Market CAGR (2025 to 2035) 4.9%
Base Year for Estimation 2024
Historical Period 2020 to 2024
Projections Period 2025 to 2035
Market Analysis Parameter Revenue in USD million
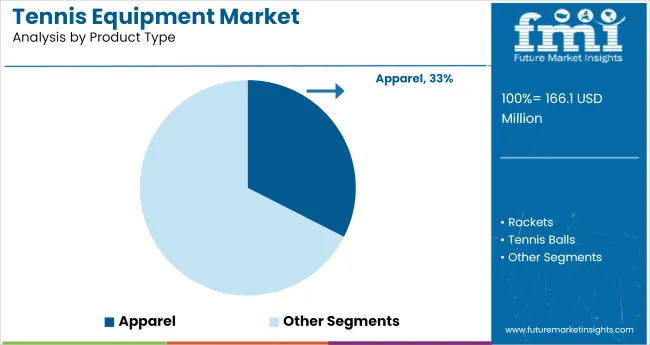
By Product Type Segments Rackets, Tennis Balls, Strings, Apparel
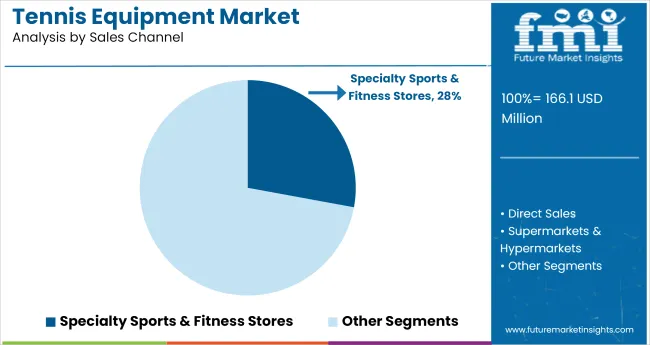
By Sales Channel Direct Sales, Supermarkets & Hypermarkets, Specialty Sports & Fitness Stores, Electronics & Sports Stores, Online Retailers, Other Sales Channels
By Regions North America, Latin America, Europe, South Asia, East Asia, Oceania, Middle East & Africa
Countries Covered United States, Japan, Germany, India, United Kingdom, France, Italy, Brazil, Canada, South Korea, Australia, Spain, Netherlands, Saudi Arabia, Switzerland
Key Players Wilson Sporting Goods Co., Babolat Vibration, Head Sports GmbH, Prince Global Sports LLC, Yonex Co., Ltd., Adidas AG, Nike, Inc., Dunlop Sport, Asics Corporation, Tecnifibre
Additional Attributes Technological Advancements, Sustainability Trends, Market Dynamics
Customization and Pricing Available upon request

Market Segmentation

By Product Type:

In terms of product type, the industry is divided into rackets, tennis balls, strings, apparel, and others.

By Sales Channel:

The industry is further divided by sales channels that are direct sales, supermarkets & hypermarkets, specialty sports & fitness stores, electronics & sports stores, online retailers, and other sales channels.

By Region:

Key countries of North America, Latin America, Europe, East Asia, South Asia, Middle East and Africa (MEA), and Oceania have been covered in the report.

Table of Content

  1. Executive Summary
  2. Industry Introduction
  3. Market Trends
  4. Market Demand Analysis 2020 to 2024 and Forecast, 2025 to 2035
  5. Pricing Analysis
  6. Market Demand (in Value or Size in USD million) Analysis and Forecast 2025 to 2035
  7. Market Background
  8. Market Analysis 2020 to 2024 and Forecast 2025 to 2035, by Product Type
    • Rackets
    • Tennis Balls
    • Strings
    • Apparel
    • Others
  9. Market Analysis 2020 to 2024 and Forecast 2025 to 2035, by Sales Channel
    • Direct Sales
    • Supermarkets & Hypermarkets
    • Specialty Sports & Fitness Stores
    • Electronics & Sports Stores
    • Online Retailers
    • Other Sales Channels
  10. Market Analysis 2020 to 2024 and Forecast 2025 to 2035, By Region
    • North America
    • Latin America
    • Europe
    • South Asia
    • East Asia
    • Oceania
    • Middle East & Africa
  11. North America Region Sales Analysis 2020 to 2024 and Forecast 2025 to 2035, by Key Segments
  12. Latin America Region Sales Analysis 2020 to 2024 and Forecast 2025 to 2035, by Key Segments
  13. Europe Region Sales Analysis 2020 to 2024 and Forecast 2025 to 2035, by Key Segments
  14. East Asia Region Sales Analysis 2020 to 2024 and Forecast 2025 to 2035, by Key Segments
  15. South Asia Region Sales Analysis 2020 to 2024 and Forecast 2025 to 2035, by Key Segments
  16. Oceania Region Sales Analysis 2020 to 2024 and Forecast 2025 to 2035, by Key Segments
  17. MEA Region Sales Analysis 2020 to 2024 and Forecast 2025 to 2035, by Key Segments
  18. Market Structure Analysis
  19. Competition Deep-Dive Analysis
    • Wilson Sporting Goods Co.
    • Babolat Vibration
    • Head Sports GmbH
    • Prince Global Sports LLC
    • Yonex Co., Ltd.
    • Adidas AG
    • Nike, Inc.
    • Dunlop Sport
    • Asics Corporation
    • Tecnifibre
    • Other Players (As requested)
  20. Assumptions and Acronyms
  21. Research Methodology

List of Tables

Table 1: Global Market Value (US$ Million) Forecast by Region, 2018 to 2033

Table 2: Global Market Volume (Units) Forecast by Region, 2018 to 2033

Table 3: Global Market Value (US$ Million) Forecast by Product Type, 2018 to 2033

Table 4: Global Market Volume (Units) Forecast by Product Type, 2018 to 2033

Table 5: Global Market Value (US$ Million) Forecast by Material, 2018 to 2033

Table 6: Global Market Volume (Units) Forecast by Material, 2018 to 2033

Table 7: Global Market Value (US$ Million) Forecast by Buyer, 2018 to 2033

Table 8: Global Market Volume (Units) Forecast by Buyer, 2018 to 2033

Table 9: Global Market Value (US$ Million) Forecast by Sales Channel, 2018 to 2033

Table 10: Global Market Volume (Units) Forecast by Sales Channel, 2018 to 2033

Table 11: North America Market Value (US$ Million) Forecast by Country, 2018 to 2033

Table 12: North America Market Volume (Units) Forecast by Country, 2018 to 2033

Table 13: North America Market Value (US$ Million) Forecast by Product Type, 2018 to 2033

Table 14: North America Market Volume (Units) Forecast by Product Type, 2018 to 2033

Table 15: North America Market Value (US$ Million) Forecast by Material, 2018 to 2033

Table 16: North America Market Volume (Units) Forecast by Material, 2018 to 2033

Table 17: North America Market Value (US$ Million) Forecast by Buyer, 2018 to 2033

Table 18: North America Market Volume (Units) Forecast by Buyer, 2018 to 2033

Table 19: North America Market Value (US$ Million) Forecast by Sales Channel, 2018 to 2033

Table 20: North America Market Volume (Units) Forecast by Sales Channel, 2018 to 2033

Table 21: Latin America Market Value (US$ Million) Forecast by Country, 2018 to 2033

Table 22: Latin America Market Volume (Units) Forecast by Country, 2018 to 2033

Table 23: Latin America Market Value (US$ Million) Forecast by Product Type, 2018 to 2033

Table 24: Latin America Market Volume (Units) Forecast by Product Type, 2018 to 2033

Table 25: Latin America Market Value (US$ Million) Forecast by Material, 2018 to 2033

Table 26: Latin America Market Volume (Units) Forecast by Material, 2018 to 2033

Table 27: Latin America Market Value (US$ Million) Forecast by Buyer, 2018 to 2033

Table 28: Latin America Market Volume (Units) Forecast by Buyer, 2018 to 2033

Table 29: Latin America Market Value (US$ Million) Forecast by Sales Channel, 2018 to 2033

Table 30: Latin America Market Volume (Units) Forecast by Sales Channel, 2018 to 2033

Table 31: Western Europe Market Value (US$ Million) Forecast by Country, 2018 to 2033

Table 32: Western Europe Market Volume (Units) Forecast by Country, 2018 to 2033

Table 33: Western Europe Market Value (US$ Million) Forecast by Product Type, 2018 to 2033

Table 34: Western Europe Market Volume (Units) Forecast by Product Type, 2018 to 2033

Table 35: Western Europe Market Value (US$ Million) Forecast by Material, 2018 to 2033

Table 36: Western Europe Market Volume (Units) Forecast by Material, 2018 to 2033

Table 37: Western Europe Market Value (US$ Million) Forecast by Buyer, 2018 to 2033

Table 38: Western Europe Market Volume (Units) Forecast by Buyer, 2018 to 2033

Table 39: Western Europe Market Value (US$ Million) Forecast by Sales Channel, 2018 to 2033

Table 40: Western Europe Market Volume (Units) Forecast by Sales Channel, 2018 to 2033

Table 41: Eastern Europe Market Value (US$ Million) Forecast by Country, 2018 to 2033

Table 42: Eastern Europe Market Volume (Units) Forecast by Country, 2018 to 2033

Table 43: Eastern Europe Market Value (US$ Million) Forecast by Product Type, 2018 to 2033

Table 44: Eastern Europe Market Volume (Units) Forecast by Product Type, 2018 to 2033

Table 45: Eastern Europe Market Value (US$ Million) Forecast by Material, 2018 to 2033

Table 46: Eastern Europe Market Volume (Units) Forecast by Material, 2018 to 2033

Table 47: Eastern Europe Market Value (US$ Million) Forecast by Buyer, 2018 to 2033

Table 48: Eastern Europe Market Volume (Units) Forecast by Buyer, 2018 to 2033

Table 49: Eastern Europe Market Value (US$ Million) Forecast by Sales Channel, 2018 to 2033

Table 50: Eastern Europe Market Volume (Units) Forecast by Sales Channel, 2018 to 2033

Table 51: South Asia and Pacific Market Value (US$ Million) Forecast by Country, 2018 to 2033

Table 52: South Asia and Pacific Market Volume (Units) Forecast by Country, 2018 to 2033

Table 53: South Asia and Pacific Market Value (US$ Million) Forecast by Product Type, 2018 to 2033

Table 54: South Asia and Pacific Market Volume (Units) Forecast by Product Type, 2018 to 2033

Table 55: South Asia and Pacific Market Value (US$ Million) Forecast by Material, 2018 to 2033

Table 56: South Asia and Pacific Market Volume (Units) Forecast by Material, 2018 to 2033

Table 57: South Asia and Pacific Market Value (US$ Million) Forecast by Buyer, 2018 to 2033

Table 58: South Asia and Pacific Market Volume (Units) Forecast by Buyer, 2018 to 2033

Table 59: South Asia and Pacific Market Value (US$ Million) Forecast by Sales Channel, 2018 to 2033

Table 60: South Asia and Pacific Market Volume (Units) Forecast by Sales Channel, 2018 to 2033

Table 61: East Asia Market Value (US$ Million) Forecast by Country, 2018 to 2033

Table 62: East Asia Market Volume (Units) Forecast by Country, 2018 to 2033

Table 63: East Asia Market Value (US$ Million) Forecast by Product Type, 2018 to 2033

Table 64: East Asia Market Volume (Units) Forecast by Product Type, 2018 to 2033

Table 65: East Asia Market Value (US$ Million) Forecast by Material, 2018 to 2033

Table 66: East Asia Market Volume (Units) Forecast by Material, 2018 to 2033

Table 67: East Asia Market Value (US$ Million) Forecast by Buyer, 2018 to 2033

Table 68: East Asia Market Volume (Units) Forecast by Buyer, 2018 to 2033

Table 69: East Asia Market Value (US$ Million) Forecast by Sales Channel, 2018 to 2033

Table 70: East Asia Market Volume (Units) Forecast by Sales Channel, 2018 to 2033

Table 71: Middle East and Africa Market Value (US$ Million) Forecast by Country, 2018 to 2033

Table 72: Middle East and Africa Market Volume (Units) Forecast by Country, 2018 to 2033

Table 73: Middle East and Africa Market Value (US$ Million) Forecast by Product Type, 2018 to 2033

Table 74: Middle East and Africa Market Volume (Units) Forecast by Product Type, 2018 to 2033

Table 75: Middle East and Africa Market Value (US$ Million) Forecast by Material, 2018 to 2033

Table 76: Middle East and Africa Market Volume (Units) Forecast by Material, 2018 to 2033

Table 77: Middle East and Africa Market Value (US$ Million) Forecast by Buyer, 2018 to 2033

Table 78: Middle East and Africa Market Volume (Units) Forecast by Buyer, 2018 to 2033

Table 79: Middle East and Africa Market Value (US$ Million) Forecast by Sales Channel, 2018 to 2033

Table 80: Middle East and Africa Market Volume (Units) Forecast by Sales Channel, 2018 to 2033

List of Figures

Figure 1: Global Market Value (US$ Million) by Product Type, 2023 to 2033

Figure 2: Global Market Value (US$ Million) by Material, 2023 to 2033

Figure 3: Global Market Value (US$ Million) by Buyer, 2023 to 2033

Figure 4: Global Market Value (US$ Million) by Sales Channel, 2023 to 2033

Figure 5: Global Market Value (US$ Million) by Region, 2023 to 2033

Figure 6: Global Market Value (US$ Million) Analysis by Region, 2018 to 2033

Figure 7: Global Market Volume (Units) Analysis by Region, 2018 to 2033

Figure 8: Global Market Value Share (%) and BPS Analysis by Region, 2023 to 2033

Figure 9: Global Market Y-o-Y Growth (%) Projections by Region, 2023 to 2033

Figure 10: Global Market Value (US$ Million) Analysis by Product Type, 2018 to 2033

Figure 11: Global Market Volume (Units) Analysis by Product Type, 2018 to 2033

Figure 12: Global Market Value Share (%) and BPS Analysis by Product Type, 2023 to 2033

Figure 13: Global Market Y-o-Y Growth (%) Projections by Product Type, 2023 to 2033

Figure 14: Global Market Value (US$ Million) Analysis by Material, 2018 to 2033

Figure 15: Global Market Volume (Units) Analysis by Material, 2018 to 2033

Figure 16: Global Market Value Share (%) and BPS Analysis by Material, 2023 to 2033

Figure 17: Global Market Y-o-Y Growth (%) Projections by Material, 2023 to 2033

Figure 18: Global Market Value (US$ Million) Analysis by Buyer, 2018 to 2033

Figure 19: Global Market Volume (Units) Analysis by Buyer, 2018 to 2033

Figure 20: Global Market Value Share (%) and BPS Analysis by Buyer, 2023 to 2033

Figure 21: Global Market Y-o-Y Growth (%) Projections by Buyer, 2023 to 2033

Figure 22: Global Market Value (US$ Million) Analysis by Sales Channel, 2018 to 2033

Figure 23: Global Market Volume (Units) Analysis by Sales Channel, 2018 to 2033

Figure 24: Global Market Value Share (%) and BPS Analysis by Sales Channel, 2023 to 2033

Figure 25: Global Market Y-o-Y Growth (%) Projections by Sales Channel, 2023 to 2033

Figure 26: Global Market Attractiveness by Product Type, 2023 to 2033

Figure 27: Global Market Attractiveness by Material, 2023 to 2033

Figure 28: Global Market Attractiveness by Buyer, 2023 to 2033

Figure 29: Global Market Attractiveness by Sales Channel, 2023 to 2033

Figure 30: Global Market Attractiveness by Region, 2023 to 2033

Figure 31: North America Market Value (US$ Million) by Product Type, 2023 to 2033

Figure 32: North America Market Value (US$ Million) by Material, 2023 to 2033

Figure 33: North America Market Value (US$ Million) by Buyer, 2023 to 2033

Figure 34: North America Market Value (US$ Million) by Sales Channel, 2023 to 2033

Figure 35: North America Market Value (US$ Million) by Country, 2023 to 2033

Figure 36: North America Market Value (US$ Million) Analysis by Country, 2018 to 2033

Figure 37: North America Market Volume (Units) Analysis by Country, 2018 to 2033

Figure 38: North America Market Value Share (%) and BPS Analysis by Country, 2023 to 2033

Figure 39: North America Market Y-o-Y Growth (%) Projections by Country, 2023 to 2033

Figure 40: North America Market Value (US$ Million) Analysis by Product Type, 2018 to 2033

Figure 41: North America Market Volume (Units) Analysis by Product Type, 2018 to 2033

Figure 42: North America Market Value Share (%) and BPS Analysis by Product Type, 2023 to 2033

Figure 43: North America Market Y-o-Y Growth (%) Projections by Product Type, 2023 to 2033

Figure 44: North America Market Value (US$ Million) Analysis by Material, 2018 to 2033

Figure 45: North America Market Volume (Units) Analysis by Material, 2018 to 2033

Figure 46: North America Market Value Share (%) and BPS Analysis by Material, 2023 to 2033

Figure 47: North America Market Y-o-Y Growth (%) Projections by Material, 2023 to 2033

Figure 48: North America Market Value (US$ Million) Analysis by Buyer, 2018 to 2033

Figure 49: North America Market Volume (Units) Analysis by Buyer, 2018 to 2033

Figure 50: North America Market Value Share (%) and BPS Analysis by Buyer, 2023 to 2033

Figure 51: North America Market Y-o-Y Growth (%) Projections by Buyer, 2023 to 2033

Figure 52: North America Market Value (US$ Million) Analysis by Sales Channel, 2018 to 2033

Figure 53: North America Market Volume (Units) Analysis by Sales Channel, 2018 to 2033

Figure 54: North America Market Value Share (%) and BPS Analysis by Sales Channel, 2023 to 2033

Figure 55: North America Market Y-o-Y Growth (%) Projections by Sales Channel, 2023 to 2033

Figure 56: North America Market Attractiveness by Product Type, 2023 to 2033

Figure 57: North America Market Attractiveness by Material, 2023 to 2033

Figure 58: North America Market Attractiveness by Buyer, 2023 to 2033

Figure 59: North America Market Attractiveness by Sales Channel, 2023 to 2033

Figure 60: North America Market Attractiveness by Country, 2023 to 2033

Figure 61: Latin America Market Value (US$ Million) by Product Type, 2023 to 2033

Figure 62: Latin America Market Value (US$ Million) by Material, 2023 to 2033

Figure 63: Latin America Market Value (US$ Million) by Buyer, 2023 to 2033

Figure 64: Latin America Market Value (US$ Million) by Sales Channel, 2023 to 2033

Figure 65: Latin America Market Value (US$ Million) by Country, 2023 to 2033

Figure 66: Latin America Market Value (US$ Million) Analysis by Country, 2018 to 2033

Figure 67: Latin America Market Volume (Units) Analysis by Country, 2018 to 2033

Figure 68: Latin America Market Value Share (%) and BPS Analysis by Country, 2023 to 2033

Figure 69: Latin America Market Y-o-Y Growth (%) Projections by Country, 2023 to 2033

Figure 70: Latin America Market Value (US$ Million) Analysis by Product Type, 2018 to 2033

Figure 71: Latin America Market Volume (Units) Analysis by Product Type, 2018 to 2033

Figure 72: Latin America Market Value Share (%) and BPS Analysis by Product Type, 2023 to 2033

Figure 73: Latin America Market Y-o-Y Growth (%) Projections by Product Type, 2023 to 2033

Figure 74: Latin America Market Value (US$ Million) Analysis by Material, 2018 to 2033

Figure 75: Latin America Market Volume (Units) Analysis by Material, 2018 to 2033

Figure 76: Latin America Market Value Share (%) and BPS Analysis by Material, 2023 to 2033

Figure 77: Latin America Market Y-o-Y Growth (%) Projections by Material, 2023 to 2033

Figure 78: Latin America Market Value (US$ Million) Analysis by Buyer, 2018 to 2033

Figure 79: Latin America Market Volume (Units) Analysis by Buyer, 2018 to 2033

Figure 80: Latin America Market Value Share (%) and BPS Analysis by Buyer, 2023 to 2033

Figure 81: Latin America Market Y-o-Y Growth (%) Projections by Buyer, 2023 to 2033

Figure 82: Latin America Market Value (US$ Million) Analysis by Sales Channel, 2018 to 2033

Figure 83: Latin America Market Volume (Units) Analysis by Sales Channel, 2018 to 2033

Figure 84: Latin America Market Value Share (%) and BPS Analysis by Sales Channel, 2023 to 2033

Figure 85: Latin America Market Y-o-Y Growth (%) Projections by Sales Channel, 2023 to 2033

Figure 86: Latin America Market Attractiveness by Product Type, 2023 to 2033

Figure 87: Latin America Market Attractiveness by Material, 2023 to 2033

Figure 88: Latin America Market Attractiveness by Buyer, 2023 to 2033

Figure 89: Latin America Market Attractiveness by Sales Channel, 2023 to 2033

Figure 90: Latin America Market Attractiveness by Country, 2023 to 2033

Figure 91: Western Europe Market Value (US$ Million) by Product Type, 2023 to 2033

Figure 92: Western Europe Market Value (US$ Million) by Material, 2023 to 2033

Figure 93: Western Europe Market Value (US$ Million) by Buyer, 2023 to 2033

Figure 94: Western Europe Market Value (US$ Million) by Sales Channel, 2023 to 2033

Figure 95: Western Europe Market Value (US$ Million) by Country, 2023 to 2033

Figure 96: Western Europe Market Value (US$ Million) Analysis by Country, 2018 to 2033

Figure 97: Western Europe Market Volume (Units) Analysis by Country, 2018 to 2033

Figure 98: Western Europe Market Value Share (%) and BPS Analysis by Country, 2023 to 2033

Figure 99: Western Europe Market Y-o-Y Growth (%) Projections by Country, 2023 to 2033

Figure 100: Western Europe Market Value (US$ Million) Analysis by Product Type, 2018 to 2033

Figure 101: Western Europe Market Volume (Units) Analysis by Product Type, 2018 to 2033

Figure 102: Western Europe Market Value Share (%) and BPS Analysis by Product Type, 2023 to 2033

Figure 103: Western Europe Market Y-o-Y Growth (%) Projections by Product Type, 2023 to 2033

Figure 104: Western Europe Market Value (US$ Million) Analysis by Material, 2018 to 2033

Figure 105: Western Europe Market Volume (Units) Analysis by Material, 2018 to 2033

Figure 106: Western Europe Market Value Share (%) and BPS Analysis by Material, 2023 to 2033

Figure 107: Western Europe Market Y-o-Y Growth (%) Projections by Material, 2023 to 2033

Figure 108: Western Europe Market Value (US$ Million) Analysis by Buyer, 2018 to 2033

Figure 109: Western Europe Market Volume (Units) Analysis by Buyer, 2018 to 2033

Figure 110: Western Europe Market Value Share (%) and BPS Analysis by Buyer, 2023 to 2033

Figure 111: Western Europe Market Y-o-Y Growth (%) Projections by Buyer, 2023 to 2033

Figure 112: Western Europe Market Value (US$ Million) Analysis by Sales Channel, 2018 to 2033

Figure 113: Western Europe Market Volume (Units) Analysis by Sales Channel, 2018 to 2033

Figure 114: Western Europe Market Value Share (%) and BPS Analysis by Sales Channel, 2023 to 2033

Figure 115: Western Europe Market Y-o-Y Growth (%) Projections by Sales Channel, 2023 to 2033

Figure 116: Western Europe Market Attractiveness by Product Type, 2023 to 2033

Figure 117: Western Europe Market Attractiveness by Material, 2023 to 2033

Figure 118: Western Europe Market Attractiveness by Buyer, 2023 to 2033

Figure 119: Western Europe Market Attractiveness by Sales Channel, 2023 to 2033

Figure 120: Western Europe Market Attractiveness by Country, 2023 to 2033

Figure 121: Eastern Europe Market Value (US$ Million) by Product Type, 2023 to 2033

Figure 122: Eastern Europe Market Value (US$ Million) by Material, 2023 to 2033

Figure 123: Eastern Europe Market Value (US$ Million) by Buyer, 2023 to 2033

Figure 124: Eastern Europe Market Value (US$ Million) by Sales Channel, 2023 to 2033

Figure 125: Eastern Europe Market Value (US$ Million) by Country, 2023 to 2033

Figure 126: Eastern Europe Market Value (US$ Million) Analysis by Country, 2018 to 2033

Figure 127: Eastern Europe Market Volume (Units) Analysis by Country, 2018 to 2033

Figure 128: Eastern Europe Market Value Share (%) and BPS Analysis by Country, 2023 to 2033

Figure 129: Eastern Europe Market Y-o-Y Growth (%) Projections by Country, 2023 to 2033

Figure 130: Eastern Europe Market Value (US$ Million) Analysis by Product Type, 2018 to 2033

Figure 131: Eastern Europe Market Volume (Units) Analysis by Product Type, 2018 to 2033

Figure 132: Eastern Europe Market Value Share (%) and BPS Analysis by Product Type, 2023 to 2033

Figure 133: Eastern Europe Market Y-o-Y Growth (%) Projections by Product Type, 2023 to 2033

Figure 134: Eastern Europe Market Value (US$ Million) Analysis by Material, 2018 to 2033

Figure 135: Eastern Europe Market Volume (Units) Analysis by Material, 2018 to 2033

Figure 136: Eastern Europe Market Value Share (%) and BPS Analysis by Material, 2023 to 2033

Figure 137: Eastern Europe Market Y-o-Y Growth (%) Projections by Material, 2023 to 2033

Figure 138: Eastern Europe Market Value (US$ Million) Analysis by Buyer, 2018 to 2033

Figure 139: Eastern Europe Market Volume (Units) Analysis by Buyer, 2018 to 2033

Figure 140: Eastern Europe Market Value Share (%) and BPS Analysis by Buyer, 2023 to 2033

Figure 141: Eastern Europe Market Y-o-Y Growth (%) Projections by Buyer, 2023 to 2033

Figure 142: Eastern Europe Market Value (US$ Million) Analysis by Sales Channel, 2018 to 2033

Figure 143: Eastern Europe Market Volume (Units) Analysis by Sales Channel, 2018 to 2033

Figure 144: Eastern Europe Market Value Share (%) and BPS Analysis by Sales Channel, 2023 to 2033

Figure 145: Eastern Europe Market Y-o-Y Growth (%) Projections by Sales Channel, 2023 to 2033

Figure 146: Eastern Europe Market Attractiveness by Product Type, 2023 to 2033

Figure 147: Eastern Europe Market Attractiveness by Material, 2023 to 2033

Figure 148: Eastern Europe Market Attractiveness by Buyer, 2023 to 2033

Figure 149: Eastern Europe Market Attractiveness by Sales Channel, 2023 to 2033

Figure 150: Eastern Europe Market Attractiveness by Country, 2023 to 2033

Figure 151: South Asia and Pacific Market Value (US$ Million) by Product Type, 2023 to 2033

Figure 152: South Asia and Pacific Market Value (US$ Million) by Material, 2023 to 2033

Figure 153: South Asia and Pacific Market Value (US$ Million) by Buyer, 2023 to 2033

Figure 154: South Asia and Pacific Market Value (US$ Million) by Sales Channel, 2023 to 2033

Figure 155: South Asia and Pacific Market Value (US$ Million) by Country, 2023 to 2033

Figure 156: South Asia and Pacific Market Value (US$ Million) Analysis by Country, 2018 to 2033

Figure 157: South Asia and Pacific Market Volume (Units) Analysis by Country, 2018 to 2033

Figure 158: South Asia and Pacific Market Value Share (%) and BPS Analysis by Country, 2023 to 2033

Figure 159: South Asia and Pacific Market Y-o-Y Growth (%) Projections by Country, 2023 to 2033

Figure 160: South Asia and Pacific Market Value (US$ Million) Analysis by Product Type, 2018 to 2033

Figure 161: South Asia and Pacific Market Volume (Units) Analysis by Product Type, 2018 to 2033

Figure 162: South Asia and Pacific Market Value Share (%) and BPS Analysis by Product Type, 2023 to 2033

Figure 163: South Asia and Pacific Market Y-o-Y Growth (%) Projections by Product Type, 2023 to 2033

Figure 164: South Asia and Pacific Market Value (US$ Million) Analysis by Material, 2018 to 2033

Figure 165: South Asia and Pacific Market Volume (Units) Analysis by Material, 2018 to 2033

Figure 166: South Asia and Pacific Market Value Share (%) and BPS Analysis by Material, 2023 to 2033

Figure 167: South Asia and Pacific Market Y-o-Y Growth (%) Projections by Material, 2023 to 2033

Figure 168: South Asia and Pacific Market Value (US$ Million) Analysis by Buyer, 2018 to 2033

Figure 169: South Asia and Pacific Market Volume (Units) Analysis by Buyer, 2018 to 2033

Figure 170: South Asia and Pacific Market Value Share (%) and BPS Analysis by Buyer, 2023 to 2033

Figure 171: South Asia and Pacific Market Y-o-Y Growth (%) Projections by Buyer, 2023 to 2033

Figure 172: South Asia and Pacific Market Value (US$ Million) Analysis by Sales Channel, 2018 to 2033

Figure 173: South Asia and Pacific Market Volume (Units) Analysis by Sales Channel, 2018 to 2033

Figure 174: South Asia and Pacific Market Value Share (%) and BPS Analysis by Sales Channel, 2023 to 2033

Figure 175: South Asia and Pacific Market Y-o-Y Growth (%) Projections by Sales Channel, 2023 to 2033

Figure 176: South Asia and Pacific Market Attractiveness by Product Type, 2023 to 2033

Figure 177: South Asia and Pacific Market Attractiveness by Material, 2023 to 2033

Figure 178: South Asia and Pacific Market Attractiveness by Buyer, 2023 to 2033

Figure 179: South Asia and Pacific Market Attractiveness by Sales Channel, 2023 to 2033

Figure 180: South Asia and Pacific Market Attractiveness by Country, 2023 to 2033

Figure 181: East Asia Market Value (US$ Million) by Product Type, 2023 to 2033

Figure 182: East Asia Market Value (US$ Million) by Material, 2023 to 2033

Figure 183: East Asia Market Value (US$ Million) by Buyer, 2023 to 2033

Figure 184: East Asia Market Value (US$ Million) by Sales Channel, 2023 to 2033

Figure 185: East Asia Market Value (US$ Million) by Country, 2023 to 2033

Figure 186: East Asia Market Value (US$ Million) Analysis by Country, 2018 to 2033

Figure 187: East Asia Market Volume (Units) Analysis by Country, 2018 to 2033

Figure 188: East Asia Market Value Share (%) and BPS Analysis by Country, 2023 to 2033

Figure 189: East Asia Market Y-o-Y Growth (%) Projections by Country, 2023 to 2033

Figure 190: East Asia Market Value (US$ Million) Analysis by Product Type, 2018 to 2033

Figure 191: East Asia Market Volume (Units) Analysis by Product Type, 2018 to 2033

Figure 192: East Asia Market Value Share (%) and BPS Analysis by Product Type, 2023 to 2033

Figure 193: East Asia Market Y-o-Y Growth (%) Projections by Product Type, 2023 to 2033

Figure 194: East Asia Market Value (US$ Million) Analysis by Material, 2018 to 2033

Figure 195: East Asia Market Volume (Units) Analysis by Material, 2018 to 2033

Figure 196: East Asia Market Value Share (%) and BPS Analysis by Material, 2023 to 2033

Figure 197: East Asia Market Y-o-Y Growth (%) Projections by Material, 2023 to 2033

Figure 198: East Asia Market Value (US$ Million) Analysis by Buyer, 2018 to 2033

Figure 199: East Asia Market Volume (Units) Analysis by Buyer, 2018 to 2033

Figure 200: East Asia Market Value Share (%) and BPS Analysis by Buyer, 2023 to 2033

Figure 201: East Asia Market Y-o-Y Growth (%) Projections by Buyer, 2023 to 2033

Figure 202: East Asia Market Value (US$ Million) Analysis by Sales Channel, 2018 to 2033

Figure 203: East Asia Market Volume (Units) Analysis by Sales Channel, 2018 to 2033

Figure 204: East Asia Market Value Share (%) and BPS Analysis by Sales Channel, 2023 to 2033

Figure 205: East Asia Market Y-o-Y Growth (%) Projections by Sales Channel, 2023 to 2033

Figure 206: East Asia Market Attractiveness by Product Type, 2023 to 2033

Figure 207: East Asia Market Attractiveness by Material, 2023 to 2033

Figure 208: East Asia Market Attractiveness by Buyer, 2023 to 2033

Figure 209: East Asia Market Attractiveness by Sales Channel, 2023 to 2033

Figure 210: East Asia Market Attractiveness by Country, 2023 to 2033

Figure 211: Middle East and Africa Market Value (US$ Million) by Product Type, 2023 to 2033

Figure 212: Middle East and Africa Market Value (US$ Million) by Material, 2023 to 2033

Figure 213: Middle East and Africa Market Value (US$ Million) by Buyer, 2023 to 2033

Figure 214: Middle East and Africa Market Value (US$ Million) by Sales Channel, 2023 to 2033

Figure 215: Middle East and Africa Market Value (US$ Million) by Country, 2023 to 2033

Figure 216: Middle East and Africa Market Value (US$ Million) Analysis by Country, 2018 to 2033

Figure 217: Middle East and Africa Market Volume (Units) Analysis by Country, 2018 to 2033

Figure 218: Middle East and Africa Market Value Share (%) and BPS Analysis by Country, 2023 to 2033

Figure 219: Middle East and Africa Market Y-o-Y Growth (%) Projections by Country, 2023 to 2033

Figure 220: Middle East and Africa Market Value (US$ Million) Analysis by Product Type, 2018 to 2033

Figure 221: Middle East and Africa Market Volume (Units) Analysis by Product Type, 2018 to 2033

Figure 222: Middle East and Africa Market Value Share (%) and BPS Analysis by Product Type, 2023 to 2033

Figure 223: Middle East and Africa Market Y-o-Y Growth (%) Projections by Product Type, 2023 to 2033

Figure 224: Middle East and Africa Market Value (US$ Million) Analysis by Material, 2018 to 2033

Figure 225: Middle East and Africa Market Volume (Units) Analysis by Material, 2018 to 2033

Figure 226: Middle East and Africa Market Value Share (%) and BPS Analysis by Material, 2023 to 2033

Figure 227: Middle East and Africa Market Y-o-Y Growth (%) Projections by Material, 2023 to 2033

Figure 228: Middle East and Africa Market Value (US$ Million) Analysis by Buyer, 2018 to 2033

Figure 229: Middle East and Africa Market Volume (Units) Analysis by Buyer, 2018 to 2033

Figure 230: Middle East and Africa Market Value Share (%) and BPS Analysis by Buyer, 2023 to 2033

Figure 231: Middle East and Africa Market Y-o-Y Growth (%) Projections by Buyer, 2023 to 2033

Figure 232: Middle East and Africa Market Value (US$ Million) Analysis by Sales Channel, 2018 to 2033

Figure 233: Middle East and Africa Market Volume (Units) Analysis by Sales Channel, 2018 to 2033

Figure 234: Middle East and Africa Market Value Share (%) and BPS Analysis by Sales Channel, 2023 to 2033

Figure 235: Middle East and Africa Market Y-o-Y Growth (%) Projections by Sales Channel, 2023 to 2033

Figure 236: Middle East and Africa Market Attractiveness by Product Type, 2023 to 2033

Figure 237: Middle East and Africa Market Attractiveness by Material, 2023 to 2033

Figure 238: Middle East and Africa Market Attractiveness by Buyer, 2023 to 2033

Figure 239: Middle East and Africa Market Attractiveness by Sales Channel, 2023 to 2033

Figure 240: Middle East and Africa Market Attractiveness by Country, 2023 to 2033

Frequently Asked Questions

What is the future of the global tennis equipment industry?

The global tennis equipment industry is projected to witness a CAGR of 4.9% between 2025 and 2035.

What was the worth of the global tennis equipment industry in 2024?

The global tennis equipment industry stood at USD 163.6 million in 2024.

What will the worth of the global tennis equipment industry by 2035 end?

The global tennis equipment industry is anticipated to reach USD 265.8 million by 2035 end.

Which country to showcase the highest CAGR during the forecast period?

India is set to record the highest CAGR of 7.1% in the assessment period.

Who are the key manufacturers of the global tennis equipment industry?

The key players operating in the global tennis equipment industry include Wilson, HEAD, Babolat, Yonex, and Dunlop, among others.

Explore Similar Insights

Future Market Insights

Tennis Equipment Market