Thoracolumbar Stabilization Devices Market Size and Share Forecast Outlook 2025 to 2035

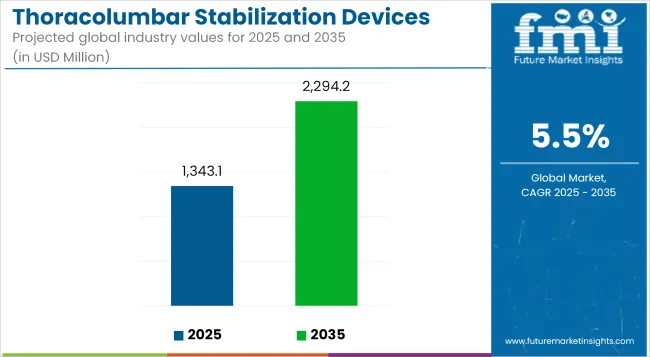
The Thoracolumbar Stabilization Devices Market is anticipated to be valued at USD 1,343.1 million in 2025 and is expected to reach USD 2,294.2 million by 2035, registering a CAGR of 5.5%.
Quick Stats for Thoracolumbar Stabilization Devices Market

  •  Industry Value (2025): USD 1,343.1 million
  •  Forecast Value (2035): USD 2,294.2 million
  • Forecast CAGR: 5.5%
  • Leading Segment in 2025: Posterior Stabilization Devices
  • Key Growth Region: Asia-Pacific, North America
  • Top Key Players: Medtronic plc, DePuy Synthes (J&J), Stryker Corporation, Globus Medical, Zimmer Biomet Holdings, NuVasive Inc., Orthofix Medical Inc., Alphatec Spine, Aesculap Implant Systems, B. Braun Melsungen AG

Thoracolumbar Stabilization Devices Market Industry Value Analysis

Metric Value (USD Million)
Industry Size (2025E) USD 1,343.1 million
Industry Value (2035F) USD 2,294.2 million
CAGR (2025 to 2035) 5.5%

This market is poised for significant growth, driven by the increasing prevalence of spinal disorders, traumatic injuries, and age-related degenerative conditions. Advancements in minimally invasive surgical techniques, such as robotic-assisted systems and bioengineered materials, are enhancing surgical precision and reducing postoperative recovery times.

The rising demand for these devices is further fueled by the global aging population, leading to a higher incidence of vertebral compression fractures, spinal stenosis, scoliosis, and degenerative disc disease. As healthcare infrastructure improves and awareness of advanced surgical options increases, the market is expected to experience robust growth through 2035.

Analyzing Thoracolumbar Stabilization Devices Market by Top Investment Segments

Posterior Stabilization Devices Lead the Market Due to Greater Surgical Accessibility and Procedural Versatility

Posterior Stabilization Devices have been observed to dominate the thoracolumbar stabilization market, accounting for 67.3% of the global revenue share in 2025. This leadership has been attributed to the procedural simplicity and anatomical accessibility provided by posterior surgical approaches.

Due to fewer complications and a broader application in trauma, tumor, and deformity cases, posterior systems are widely preferred by spine surgeons globally. Moreover, enhanced instrumentation systems and the integration of image-guided navigation have improved the precision and safety of posterior stabilization, reinforcing clinical preference.

These devices have also been increasingly adopted in minimally invasive procedures, thereby expanding their utilization across outpatient settings. The posterior approach is also typically favored in multi-level fusion surgeries due to its stability and biomechanical advantages. As a result, procedural standardization and broader training availability among surgeons have further contributed to its dominant share in the market.

Titanium-Based Devices Dominate the Market Owing to Superior Biocompatibility and Corrosion Resistance

Titanium has been identified as the leading material in the thoracolumbar stabilization devices segment, securing 77.8% of total market revenue in 2025. The growth of this segment has been propelled by the material’s excellent strength-to-weight ratio, exceptional biocompatibility, and corrosion resistance.

These properties have made titanium implants the standard of care in spine surgeries, especially for long-term stabilization. Titanium’s compatibility with MRI imaging and its reduced risk of inflammatory response compared to stainless steel has further increased its adoption among healthcare providers.

The growing preference for minimally invasive and robotic-assisted spinal procedures has also favored titanium, as its malleability allows precise shaping without compromising structural integrity. Additionally, long-term performance, reduced incidence of implant-related complications, and strong regulatory approval histories have supported its sustained dominance across geographies.

Hospitals Dominate the End User Segment Due to Access to Complex Spinal Surgery Infrastructure and Multidisciplinary Care

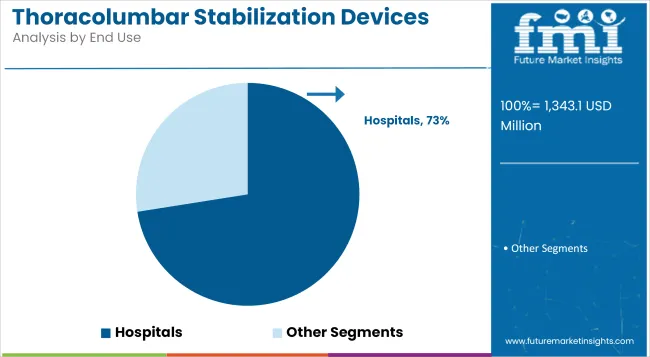
Hospitals have emerged as the leading end-user segment in the thoracolumbar stabilization devices market, commanding 72.5% of the global revenue share in 2025. This dominance has been attributed to the availability of advanced surgical infrastructure, neurosurgical expertise, and comprehensive patient care protocols, which are critical for thoracolumbar interventions.

These healthcare settings are equipped with high-end imaging systems, robotic-assisted surgery platforms, and intensive post-operative care, all of which are essential for managing complex spinal trauma, degenerative conditions, and oncologic procedures.

Furthermore, the presence of multidisciplinary spine care teams and streamlined insurance reimbursement pathways within hospital systems has encouraged patient preference and procedural volume concentration in this segment. As surgical procedures become more specialized, hospitals remain the preferred location for both primary and revision stabilization surgeries, ensuring their sustained market leadership.
Thoracolumbar Stabilization Devices Market Analysis By End Use

Challenges and Opportunities

Post-Surgical Complications and Implant Failures Is Emerging as The Significant Market Restraint.

There are multiple challenges to hardware utilization in resource-poor environments, which may inhibit broad consideration of thoracolumbar stabilization devices. One of the main barriers is the high cost of implants - especially if advanced materials and robotic-compatible systems are involved - making these stabilization solutions inaccessible to healthcare providers working in developing areas of the world.

Furthermore, the operative interventions associated with thoracolumbar instrumentation are typically complex procedures that necessitate an exceptional degree of surgical acumen and organizational backing. The variables of buffering on the one hand and operating infrastructure on the other create a duality around common outcomes as they split, stagger away from underperforming these areas.

Such inconsistent reimbursement policies - from one part of the world to another - especially with an increasing desire to bring hospitals’ costs down may yet limit access to the newer class of expensive devices.

The Growing Preference for Minimally Invasive Procedures Presents Significant Opportunities for Device Manufacturers.

Despite these challenges, the potential of thoracolumbar stabilization devices market is huge, as the advancements in technology and care delivery systems continue to evolve at a rapid pace. An area of rapid evolution is the utilization of 3D printing and patient-specific implant fabrication, which allows tailored stabilization constructs customized to each patient's spinal anatomy and pathology.

This results in better biomechanical compatibility with both improved outcomes and increases in a surgeon’s confidence. Minimally invasive surgery (MIS) technique is also becoming increasingly popular, allowing for percutaneous device placement with lower intensity, reduced blood loss, and rapid recovery which will have a crucial impact on the outpatient and day-care surgical models.

The onward migration of ASCs and bundled payment models is pushing hospitals and surgeons towards value-based devices that provide optimum performance and safety for the dollar. The surge of innovation within surgical navigation, augmented reality (AR), and intraoperative imaging further fuels precision-based implant positioning with enhanced complication rates.

Industry-Specific Highlights

Minimally Invasive Stabilization

Minimally invasive spinal surgery is changing the ways and methods of thoracolumbar stabilizations by rendering safe and fast alternatives for the traditional surgery. MISS techniques employ percutaneous screws, tubular retractors, and endoscopic visualization to minimize soft-tissue damage, intraoperative blood loss, and hospital stay.All these advantages become relevant in elderly and high-risk patients who may not be able to tolerate conventional open procedure.

Use of MIS stabilization systems is extending to trauma, tumor resection, and deformity correction cases, where preservation of spinal integrity with minimal disruption is crucial. Increasingly, simulation-based training and workshops in these techniques are being offered to surgeons. Manufacturers are developing special implant design for minimal invasive delivery, including low-profile rods and expandable interbody cages.

Biocompatible Materials Innovation

Material innovation is a key focus in the thoracolumbar stabilization devices market in order to improve biocompatibility, mechanical performance, and radiographic visibility. Titanium and titanium alloys are highly biocompatible and widely used in orthopedic implants. But more recent widening use of materials such as polyetheretherketone (PEEK) and carbon fiber-reinforced composites for their radiolucency and modulus of elasticity similar to natural bone could increase in wider use.

Temporary stabilization in select trauma cases using bioresorbable polymers is also being investigated and is an attractive option since the implant would degrade progressively after healing has occurred. They decrease long-term complications and avoid the need for secondary procedures. To increase bonding between the bone and the implant, osseointegration-promoting coatings and surface treatments such as hydroxyapatite, titanium plasma spray, or nano-structured textures are also being used.

Emerging Trends

AR platforms project preoperative imaging on the surgeon's field of view during an operation, thereby providing real-time information to support the surgical team in implant positioning and anatomical navigation. It enhances decision-making during surgery, minimizes radiation exposure to the patient and the surgical team provided by fluoroscopy, and, most importantly, enhances precision.

AR systems are being developed to interface with robotic platforms and navigation software for seamless planning and execution of complex stabilization cases. The beneficial application of AR is more evident in the minimally invasive approach when visibility is compromised but requires utmost precision.

Brief Market Overview

The global thoracolumbar stabilization devices market held significant growth between 2020 and 2024 due to the growing prevalence of spinal disorders, innovations in surgical techniques, and the rapidly increasing aging of world population susceptible to spinal injuries. This upward trend was fueled by important innovations in device design and materials where device design is engineered for better surgical precision and faster patient recovery.

The filter would then enable the seamless integration of advanced implants into a range of conditions, although challenges due to the cost of even the advanced implants and improving surgical training to embed street medicine in specialized surgical operations would also be factors for broader use.

The upcoming 2025 to 2035 period observes continued growth in the market, aided by the continued technological advancements, improved healthcare facilities, and more medical professionals favouring minimally invasive methods. Next-Generation stabilization systems with improved biocompatibility and durability are going to optimize patient outcomes even further.

In addition, increasing awareness of spinal health and improved accessibility of healthcare services in developing economies are probable to provide new growth such opportunities for market players.
Country Wise Analysis

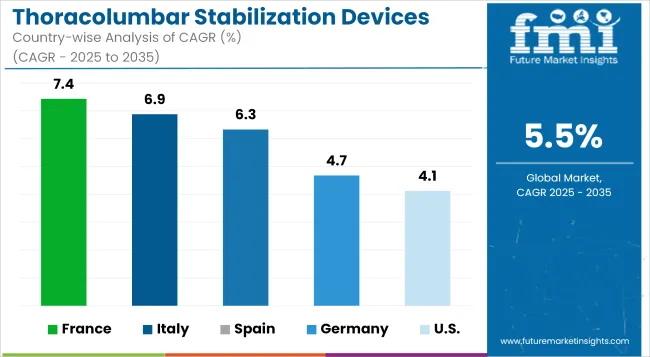
Thoracolumbar Stabilization Devices Market Cagr Analysis By Country

United States

Market Outlook

High healthcare infrastructure development, high prevalence of spinal disorders, and strong presence of leading medical device manufacturers make the USA a lucrative nation for the thoracolumbar stabilization devices market. Demand is being propelled by rising incidences of traumatic spinal injuries, majorly by road traffic accidents, sports, and occupational hazards.

Favorable reimbursement policies and early adoption of the minimally invasive stabilization technique favor market growth. Customization in the implants and robotic-assisted spinal surgeries are other factors generating technological innovations. Increasing geriatric population suffering from degenerative spinal diseases continues to support long-term demand. Strategic partnerships along with FDA approvals serve as key growth enablers in the USA market.

Market Growth Factors

  • High Prevalence of Spinal Degenerative Conditions and Trauma: Especially in the aging and obese populations.
  • Adoption of Robotic and Image-Guided Spinal Fixation: Improves surgical precision and patient outcomes.
  • Expansion of Outpatient Spine Surgery Centers: Driving demand for MIS-compatible stabilization hardware.
  • Technological Advancements in Pedicle Screw Systems: Including expandable and navigable screw designs.
  • Strong Reimbursement Framework for Spinal Fusion Procedures: Encourages use of advanced devices.

Market Forecast

Country CAGR (2025 to 2035)
United States 1.7%

Germany

Market Outlook

The thoracolumbar stabilization devices market in Europe is dominated by Germany, due to the supportive healthcare facilities and rising elderly population. The country’s healthcare system also focuses on precise surgeries and advanced spinal care, thus supporting the demand for novel stabilization implants and instrumentation. As the number of osteoporotic fractures and spinal deformities among the elderly continues to rise, so does the demand for effective stabilization solutions.

Leading research institutions and medical device companies in Germany are key to the development of innovative products. Government support for healthcare innovation and surgical training initiatives increases procedural volume. The students readily embraced this hands-on opportunity to learn the latest surgical techniques, and patient preference for minimally invasive options only has stoked the fires of adoption.

Market Growth Factors

  • Rising Incidence of Osteoporotic Vertebral Fractures: Drives demand for cement-augmented and fixation-supported treatments.
  • Advanced Integration of Intraoperative Navigation: Promotes precision in thoracolumbar screw placement.
  • Strong Public and Private Health Coverage: Facilitates access to high-quality spinal implants.
  • Increasing Adoption of Biocompatible and Titanium Alloy Implants: Enhances long-term outcomes.
  • Multidisciplinary Spinal Surgery Teams: Encourage evidence-based use of stabilization devices.

Market Forecast

Country CAGR (2025 to 2035)
Germany 2.6%

Japan

Market Outlook

Japan thoracolumbar stabilization devices market share is largely driven by rapidly growing geriatric population and high rate of degenerative spinal disorders such as lumbar spondylosis and spinal stenosis. With its concentration on precision medicine and advanced surgical techniques, there is also strong demand for innovative stabilization solutions.

Overlapping with this is a major involvement from Japanese manufacturers in creating compact, biocompatible and motion-preserving implants. Increased patient awareness, advancement in diagnostic imaging technologies, and government initiatives for elderly care also contribute to the growth of the market.

In addition, the increasing number of minimally invasive spine surgeries performed in Japanese hospitals and clinics drives device usage. Market expansion is driven by technological sophistication and a quality-centric healthcare model.

Market Growth Factors

  • High Geriatric Population with Spinal Fragility Issues: Drives demand for safe, less invasive stabilization systems.
  • Government Support for Technologically Advanced Procedures: Reimburses modern spinal instrumentation.
  • Strong Use of Hybrid Surgical Techniques: Combining posterior fusion and anterior column reconstruction.
  • R&D in Expandable and Modular Fixation Devices: Focused on reducing reoperation risk.
  • Clinical Preference for Biomechanically Optimized Constructs: Tailored to patient-specific anatomy and pathology.

Market Forecast

Country CAGR (2025 to 2035)
Japan 4.4%

United Kingdom

Market Outlook

The market for thoracolumbar stabilization devices is also steadily rising in the United Kingdom, fueled by a rise in cases of spinal injuries caused by old age, stress in the workplace, and other lifestyle conditions. The National Health Service (NHS) encourages access to spinal operations, but budget limitations frequently direct demand towards economical, less invasive options.

The adoption of robotics and 3D-printed titanium in thoracolumbar stabilization in the UK. Biomechanical research in academia as well as clinical validation of spinal implants further support the market. Moreover, a gradual transition to outpatient spine surgeries and the use of rehabilitation protocols propels the early adoption of advanced stabilization systems leading to reduced hospitalization and complications.

Market Growth Factors

  • Rising Elective and Emergency Spinal Surgeries: Backlog post-pandemic driving procedural acceleration.
  • Shift Toward MIS in NHS Spine Units: Use of low-profile, modular fixation systems is increasing.
  • Strong Neurosurgical and Ortho-Spine Collaboration: Fosters adoption of advanced stabilization protocols.
  • Growth in Private Spine Surgery Networks: Enables use of premium implants and navigation tools.
  • Academic-Clinical Partnerships: Accelerate clinical validation of emerging spinal technologies.

Market Forecast

Country CAGR (2025 to 2035)
United Kingdom 2.3%

India

Market Outlook

The thoracolumbar stabilization devices market in India is rapidly emerging owing to the rising number of road accidents, sports injuries, and spinal disorders especially in the younger and working-age population. An increasing number of neurosurgeons and orthopedic specialists are providing support for surgical volume by adding more private healthcare infrastructure. Introduction:Spinal implants are a vital part of this journey, yet cost sensitivity is a concern.

Local manufacturing and government endeavors (in line with "Make in India")are working towards making affordable spinal implants accessible. One of the key factors driving this increase is the growing trend of medical tourism, with patients from neighboring areas traveling to India for high-quality and cost-effective spine check-ups and surgeries. The market is expected to expand in the future due to technological awareness and increasing investments in minimal invasive spinal procedures.

Market Growth Factors

  • High Trauma Case Volume Requiring Stabilization: RTAs remain a major driver for thoracolumbar procedures.
  • Expansion of Orthopedic and Spine Surgery Infrastructure: Urban and private hospitals are improving surgical capacity.
  • Growth of Domestic Implant Manufacturers: Providing economical alternatives to imported systems.
  • Government Health Schemes (e.g., Ayushman Bharat): Enhancing access to surgical treatment in underserved areas.
  • Training and Fellowship Programs in Spine Surgery: Boosting surgeon competency with modern fixation tools.

Market Forecast

Country CAGR (2025 to 2035)
India 4.6%

Competitive Outlook

The thoracolumbar stabilization devices market is competitive and expanding due to the rising incidence of spinal disorders, trauma, and the growth in minimally invasive spine procedures. Advances in spinal fixation systems, better biomaterials, and the growth in geriatric populations are driving demand. The market consists of established orthopedic device manufacturers, spine care specialists, and new entrants with innovative stabilization technologies.

Key Development:

  • In 2024, Globus Medical has commercially launched the ADIRA™ XLIF™ Plate System, its first product compatible across its expanded lateral interbody portfolio, signifying a key integration milestone and continued innovation in lateral spine surgery.
  • In 2024, Xtant Medical has launched the Cortera Posterior Fixation System in the USA, a comprehensive solution designed to streamline and enhance thoracolumbar fixation surgeries with innovative implants and multi-functional instruments.

Key Players

  • NuVasive, Inc.
  • B. Braun Melsungen AG
  • Orthofix Medical Inc.
  • Alphatec Spine, Inc.
  • Aesculap Implant Systems

Key Segments

By Device Type:

Anterior stabilization device, posterior stabilization device and retractors.

By Material:

Titanium and stainless steel.

By End User:

Hospitals, clinics and ambulatory surgical centers.

By Region:

North America, Latin America, Western Europe, Eastern Europe, East Asia, South Asia Pacific, Middle East Africa

Table of Content

  1. Executive Summary
  2. Industry Introduction, including Taxonomy and Market Definition
  3. Market Trends and Success Factors, including Macro-Economic Factors, Market Dynamics, and Recent Industry Developments
  4. Global Market Demand (Value in USD) and Volume (Units) Analysis 2020 to 2024 and Forecast 2025 to 2035, including Historical Analysis and Future Projections
  5. Global Market - Pricing Analysis
  6. Global Market Analysis 2020 to 2024 and Forecast 2025 to 2035
    • By Device Type
    • By Material
    • By End User
    • By Region
  7. Global Market Analysis 2020 to 2024 and Forecast 2025 to 2035, By Device Type
    • Anterior Stabilization Device
    • Posterior Stabilization Device
    • Retractors
  8. Global Market Analysis 2020 to 2024 and Forecast 2025 to 2035, By Material
    • Titanium
    • Stainless Steel
  9. Global Market Analysis 2020 to 2024 and Forecast 2025 to 2035, By End User
    • Hospitals
    • Clinics
    • Ambulatory Surgical Centers
  10. Global Market Analysis 2020 to 2024 and Forecast 2025 to 2035, By Region
    • North America
    • Latin America
    • Western Europe
    • Eastern Europe
    • South Asia & Pacific
    • East Asia
    • Middle East & Africa
  11. North America Sales Analysis 2020 to 2024 and Forecast 2025 to 2035, by Key Segments and Countries
  12. Latin America Sales Analysis 2020 to 2024 and Forecast 2025 to 2035, by Key Segments and Countries
  13. Western Europe Sales Analysis 2020 to 2024 and Forecast 2025 to 2035, by Key Segments and Countries
  14. Eastern Europe Sales Analysis 2020 to 2024 and Forecast 2025 to 2035, by Key Segments and Countries
  15. South Asia & Pacific Sales Analysis 2020 to 2024 and Forecast 2025 to 2035, by Key Segments and Countries
  16. East Asia Sales Analysis 2020 to 2024 and Forecast 2025 to 2035, by Key Segments and Countries
  17. Middle East and Africa Sales Analysis 2020 to 2024 and Forecast 2025 to 2035, by Key Segments and Countries
  18. Sales Forecast 2025 to 2035 By Device Type, By Material and by End User for 30 Countries
  19. Competition Outlook, including Market Structure Analysis, Company Share Analysis by Key Players, and Competition Dashboard
  20. Company Profile
    • Medtronic plc
    • DePuy Synthes
    • Stryker Corporation
    • Globus Medical
    • Zimmer Biomet Holdings
    • NuVasive, Inc.
    • B. Braun Melsungen AG
    • Orthofix Medical Inc.
    • Alphatec Spine, Inc.
    • Aesculap Implant Systems
    • Others

List of Tables

  • Table 1: Global Market Value (USD Million) Forecast by Region, 2020 to 2035
  • Table 2: Global Market Volume (Units) Forecast by Region, 2020 to 2035
  • Table 3: Global Market Value (USD Million) Forecast by Device Type, 2020 to 2035
  • Table 4: Global Market Volume (Units) Forecast by Device Type, 2020 to 2035
  • Table 5: Global Market Value (USD Million) Forecast by Material, 2020 to 2035
  • Table 6: Global Market Volume (Units) Forecast by Material, 2020 to 2035
  • Table 7: Global Market Value (USD Million) Forecast by End Use, 2020 to 2035
  • Table 8: Global Market Volume (Units) Forecast by End Use, 2020 to 2035
  • Table 9: North America Market Value (USD Million) Forecast by Country, 2020 to 2035
  • Table 10: North America Market Volume (Units) Forecast by Country, 2020 to 2035
  • Table 11: North America Market Value (USD Million) Forecast by Device Type, 2020 to 2035
  • Table 12: North America Market Volume (Units) Forecast by Device Type, 2020 to 2035
  • Table 13: North America Market Value (USD Million) Forecast by Material, 2020 to 2035
  • Table 14: North America Market Volume (Units) Forecast by Material, 2020 to 2035
  • Table 15: North America Market Value (USD Million) Forecast by End Use, 2020 to 2035
  • Table 16: North America Market Volume (Units) Forecast by End Use, 2020 to 2035
  • Table 17: Latin America Market Value (USD Million) Forecast by Country, 2020 to 2035
  • Table 18: Latin America Market Volume (Units) Forecast by Country, 2020 to 2035
  • Table 19: Latin America Market Value (USD Million) Forecast by Device Type, 2020 to 2035
  • Table 20: Latin America Market Volume (Units) Forecast by Device Type, 2020 to 2035
  • Table 21: Latin America Market Value (USD Million) Forecast by Material, 2020 to 2035
  • Table 22: Latin America Market Volume (Units) Forecast by Material, 2020 to 2035
  • Table 23: Latin America Market Value (USD Million) Forecast by End Use, 2020 to 2035
  • Table 24: Latin America Market Volume (Units) Forecast by End Use, 2020 to 2035
  • Table 25: Western Europe Market Value (USD Million) Forecast by Country, 2020 to 2035
  • Table 26: Western Europe Market Volume (Units) Forecast by Country, 2020 to 2035
  • Table 27: Western Europe Market Value (USD Million) Forecast by Device Type, 2020 to 2035
  • Table 28: Western Europe Market Volume (Units) Forecast by Device Type, 2020 to 2035
  • Table 29: Western Europe Market Value (USD Million) Forecast by Material, 2020 to 2035
  • Table 30: Western Europe Market Volume (Units) Forecast by Material, 2020 to 2035
  • Table 31: Western Europe Market Value (USD Million) Forecast by End Use, 2020 to 2035
  • Table 32: Western Europe Market Volume (Units) Forecast by End Use, 2020 to 2035
  • Table 33: Eastern Europe Market Value (USD Million) Forecast by Country, 2020 to 2035
  • Table 34: Eastern Europe Market Volume (Units) Forecast by Country, 2020 to 2035
  • Table 35: Eastern Europe Market Value (USD Million) Forecast by Device Type, 2020 to 2035
  • Table 36: Eastern Europe Market Volume (Units) Forecast by Device Type, 2020 to 2035
  • Table 37: Eastern Europe Market Value (USD Million) Forecast by Material, 2020 to 2035
  • Table 38: Eastern Europe Market Volume (Units) Forecast by Material, 2020 to 2035
  • Table 39: Eastern Europe Market Value (USD Million) Forecast by End Use, 2020 to 2035
  • Table 40: Eastern Europe Market Volume (Units) Forecast by End Use, 2020 to 2035
  • Table 41: South Asia and Pacific Market Value (USD Million) Forecast by Country, 2020 to 2035
  • Table 42: South Asia and Pacific Market Volume (Units) Forecast by Country, 2020 to 2035
  • Table 43: South Asia and Pacific Market Value (USD Million) Forecast by Device Type, 2020 to 2035
  • Table 44: South Asia and Pacific Market Volume (Units) Forecast by Device Type, 2020 to 2035
  • Table 45: South Asia and Pacific Market Value (USD Million) Forecast by Material, 2020 to 2035
  • Table 46: South Asia and Pacific Market Volume (Units) Forecast by Material, 2020 to 2035
  • Table 47: South Asia and Pacific Market Value (USD Million) Forecast by End Use, 2020 to 2035
  • Table 48: South Asia and Pacific Market Volume (Units) Forecast by End Use, 2020 to 2035
  • Table 49: East Asia Market Value (USD Million) Forecast by Country, 2020 to 2035
  • Table 50: East Asia Market Volume (Units) Forecast by Country, 2020 to 2035
  • Table 51: East Asia Market Value (USD Million) Forecast by Device Type, 2020 to 2035
  • Table 52: East Asia Market Volume (Units) Forecast by Device Type, 2020 to 2035
  • Table 53: East Asia Market Value (USD Million) Forecast by Material, 2020 to 2035
  • Table 54: East Asia Market Volume (Units) Forecast by Material, 2020 to 2035
  • Table 55: East Asia Market Value (USD Million) Forecast by End Use, 2020 to 2035
  • Table 56: East Asia Market Volume (Units) Forecast by End Use, 2020 to 2035
  • Table 57: Middle East and Africa Market Value (USD Million) Forecast by Country, 2020 to 2035
  • Table 58: Middle East and Africa Market Volume (Units) Forecast by Country, 2020 to 2035
  • Table 59: Middle East and Africa Market Value (USD Million) Forecast by Device Type, 2020 to 2035
  • Table 60: Middle East and Africa Market Volume (Units) Forecast by Device Type, 2020 to 2035
  • Table 61: Middle East and Africa Market Value (USD Million) Forecast by Material, 2020 to 2035
  • Table 62: Middle East and Africa Market Volume (Units) Forecast by Material, 2020 to 2035
  • Table 63: Middle East and Africa Market Value (USD Million) Forecast by End Use, 2020 to 2035
  • Table 64: Middle East and Africa Market Volume (Units) Forecast by End Use, 2020 to 2035

List of Figures

  • Figure 1: Global Market Value (USD Million) by Device Type, 2025 to 2035
  • Figure 2: Global Market Value (USD Million) by Material, 2025 to 2035
  • Figure 3: Global Market Value (USD Million) by End Use, 2025 to 2035
  • Figure 4: Global Market Value (USD Million) by Region, 2025 to 2035
  • Figure 5: Global Market Value (USD Million) Analysis by Region, 2020 to 2035
  • Figure 6: Global Market Volume (Units) Analysis by Region, 2020 to 2035
  • Figure 7: Global Market Value Share (%) and BPS Analysis by Region, 2025 to 2035
  • Figure 8: Global Market Y-o-Y Growth (%) Projections by Region, 2025 to 2035
  • Figure 9: Global Market Value (USD Million) Analysis by Device Type, 2020 to 2035
  • Figure 10: Global Market Volume (Units) Analysis by Device Type, 2020 to 2035
  • Figure 11: Global Market Value Share (%) and BPS Analysis by Device Type, 2025 to 2035
  • Figure 12: Global Market Y-o-Y Growth (%) Projections by Device Type, 2025 to 2035
  • Figure 13: Global Market Value (USD Million) Analysis by Material, 2020 to 2035
  • Figure 14: Global Market Volume (Units) Analysis by Material, 2020 to 2035
  • Figure 15: Global Market Value Share (%) and BPS Analysis by Material, 2025 to 2035
  • Figure 16: Global Market Y-o-Y Growth (%) Projections by Material, 2025 to 2035
  • Figure 17: Global Market Value (USD Million) Analysis by End Use, 2020 to 2035
  • Figure 18: Global Market Volume (Units) Analysis by End Use, 2020 to 2035
  • Figure 19: Global Market Value Share (%) and BPS Analysis by End Use, 2025 to 2035
  • Figure 20: Global Market Y-o-Y Growth (%) Projections by End Use, 2025 to 2035
  • Figure 21: Global Market Attractiveness by Device Type, 2025 to 2035
  • Figure 22: Global Market Attractiveness by Material, 2025 to 2035
  • Figure 23: Global Market Attractiveness by End Use, 2025 to 2035
  • Figure 24: Global Market Attractiveness by Region, 2025 to 2035
  • Figure 25: North America Market Value (USD Million) by Device Type, 2025 to 2035
  • Figure 26: North America Market Value (USD Million) by Material, 2025 to 2035
  • Figure 27: North America Market Value (USD Million) by End Use, 2025 to 2035
  • Figure 28: North America Market Value (USD Million) by Country, 2025 to 2035
  • Figure 29: North America Market Value (USD Million) Analysis by Country, 2020 to 2035
  • Figure 30: North America Market Volume (Units) Analysis by Country, 2020 to 2035
  • Figure 31: North America Market Value Share (%) and BPS Analysis by Country, 2025 to 2035
  • Figure 32: North America Market Y-o-Y Growth (%) Projections by Country, 2025 to 2035
  • Figure 33: North America Market Value (USD Million) Analysis by Device Type, 2020 to 2035
  • Figure 34: North America Market Volume (Units) Analysis by Device Type, 2020 to 2035
  • Figure 35: North America Market Value Share (%) and BPS Analysis by Device Type, 2025 to 2035
  • Figure 36: North America Market Y-o-Y Growth (%) Projections by Device Type, 2025 to 2035
  • Figure 37: North America Market Value (USD Million) Analysis by Material, 2020 to 2035
  • Figure 38: North America Market Volume (Units) Analysis by Material, 2020 to 2035
  • Figure 39: North America Market Value Share (%) and BPS Analysis by Material, 2025 to 2035
  • Figure 40: North America Market Y-o-Y Growth (%) Projections by Material, 2025 to 2035
  • Figure 41: North America Market Value (USD Million) Analysis by End Use, 2020 to 2035
  • Figure 42: North America Market Volume (Units) Analysis by End Use, 2020 to 2035
  • Figure 43: North America Market Value Share (%) and BPS Analysis by End Use, 2025 to 2035
  • Figure 44: North America Market Y-o-Y Growth (%) Projections by End Use, 2025 to 2035
  • Figure 45: North America Market Attractiveness by Device Type, 2025 to 2035
  • Figure 46: North America Market Attractiveness by Material, 2025 to 2035
  • Figure 47: North America Market Attractiveness by End Use, 2025 to 2035
  • Figure 48: North America Market Attractiveness by Country, 2025 to 2035
  • Figure 49: Latin America Market Value (USD Million) by Device Type, 2025 to 2035
  • Figure 50: Latin America Market Value (USD Million) by Material, 2025 to 2035
  • Figure 51: Latin America Market Value (USD Million) by End Use, 2025 to 2035
  • Figure 52: Latin America Market Value (USD Million) by Country, 2025 to 2035
  • Figure 53: Latin America Market Value (USD Million) Analysis by Country, 2020 to 2035
  • Figure 54: Latin America Market Volume (Units) Analysis by Country, 2020 to 2035
  • Figure 55: Latin America Market Value Share (%) and BPS Analysis by Country, 2025 to 2035
  • Figure 56: Latin America Market Y-o-Y Growth (%) Projections by Country, 2025 to 2035
  • Figure 57: Latin America Market Value (USD Million) Analysis by Device Type, 2020 to 2035
  • Figure 58: Latin America Market Volume (Units) Analysis by Device Type, 2020 to 2035
  • Figure 59: Latin America Market Value Share (%) and BPS Analysis by Device Type, 2025 to 2035
  • Figure 60: Latin America Market Y-o-Y Growth (%) Projections by Device Type, 2025 to 2035
  • Figure 61: Latin America Market Value (USD Million) Analysis by Material, 2020 to 2035
  • Figure 62: Latin America Market Volume (Units) Analysis by Material, 2020 to 2035
  • Figure 63: Latin America Market Value Share (%) and BPS Analysis by Material, 2025 to 2035
  • Figure 64: Latin America Market Y-o-Y Growth (%) Projections by Material, 2025 to 2035
  • Figure 65: Latin America Market Value (USD Million) Analysis by End Use, 2020 to 2035
  • Figure 66: Latin America Market Volume (Units) Analysis by End Use, 2020 to 2035
  • Figure 67: Latin America Market Value Share (%) and BPS Analysis by End Use, 2025 to 2035
  • Figure 68: Latin America Market Y-o-Y Growth (%) Projections by End Use, 2025 to 2035
  • Figure 69: Latin America Market Attractiveness by Device Type, 2025 to 2035
  • Figure 70: Latin America Market Attractiveness by Material, 2025 to 2035
  • Figure 71: Latin America Market Attractiveness by End Use, 2025 to 2035
  • Figure 72: Latin America Market Attractiveness by Country, 2025 to 2035
  • Figure 73: Western Europe Market Value (USD Million) by Device Type, 2025 to 2035
  • Figure 74: Western Europe Market Value (USD Million) by Material, 2025 to 2035
  • Figure 75: Western Europe Market Value (USD Million) by End Use, 2025 to 2035
  • Figure 76: Western Europe Market Value (USD Million) by Country, 2025 to 2035
  • Figure 77: Western Europe Market Value (USD Million) Analysis by Country, 2020 to 2035
  • Figure 78: Western Europe Market Volume (Units) Analysis by Country, 2020 to 2035
  • Figure 79: Western Europe Market Value Share (%) and BPS Analysis by Country, 2025 to 2035
  • Figure 80: Western Europe Market Y-o-Y Growth (%) Projections by Country, 2025 to 2035
  • Figure 81: Western Europe Market Value (USD Million) Analysis by Device Type, 2020 to 2035
  • Figure 82: Western Europe Market Volume (Units) Analysis by Device Type, 2020 to 2035
  • Figure 83: Western Europe Market Value Share (%) and BPS Analysis by Device Type, 2025 to 2035
  • Figure 84: Western Europe Market Y-o-Y Growth (%) Projections by Device Type, 2025 to 2035
  • Figure 85: Western Europe Market Value (USD Million) Analysis by Material, 2020 to 2035
  • Figure 86: Western Europe Market Volume (Units) Analysis by Material, 2020 to 2035
  • Figure 87: Western Europe Market Value Share (%) and BPS Analysis by Material, 2025 to 2035
  • Figure 88: Western Europe Market Y-o-Y Growth (%) Projections by Material, 2025 to 2035
  • Figure 89: Western Europe Market Value (USD Million) Analysis by End Use, 2020 to 2035
  • Figure 90: Western Europe Market Volume (Units) Analysis by End Use, 2020 to 2035
  • Figure 91: Western Europe Market Value Share (%) and BPS Analysis by End Use, 2025 to 2035
  • Figure 92: Western Europe Market Y-o-Y Growth (%) Projections by End Use, 2025 to 2035
  • Figure 93: Western Europe Market Attractiveness by Device Type, 2025 to 2035
  • Figure 94: Western Europe Market Attractiveness by Material, 2025 to 2035
  • Figure 95: Western Europe Market Attractiveness by End Use, 2025 to 2035
  • Figure 96: Western Europe Market Attractiveness by Country, 2025 to 2035
  • Figure 97: Eastern Europe Market Value (USD Million) by Device Type, 2025 to 2035
  • Figure 98: Eastern Europe Market Value (USD Million) by Material, 2025 to 2035
  • Figure 99: Eastern Europe Market Value (USD Million) by End Use, 2025 to 2035
  • Figure 100: Eastern Europe Market Value (USD Million) by Country, 2025 to 2035
  • Figure 101: Eastern Europe Market Value (USD Million) Analysis by Country, 2020 to 2035
  • Figure 102: Eastern Europe Market Volume (Units) Analysis by Country, 2020 to 2035
  • Figure 103: Eastern Europe Market Value Share (%) and BPS Analysis by Country, 2025 to 2035
  • Figure 104: Eastern Europe Market Y-o-Y Growth (%) Projections by Country, 2025 to 2035
  • Figure 105: Eastern Europe Market Value (USD Million) Analysis by Device Type, 2020 to 2035
  • Figure 106: Eastern Europe Market Volume (Units) Analysis by Device Type, 2020 to 2035
  • Figure 107: Eastern Europe Market Value Share (%) and BPS Analysis by Device Type, 2025 to 2035
  • Figure 108: Eastern Europe Market Y-o-Y Growth (%) Projections by Device Type, 2025 to 2035
  • Figure 109: Eastern Europe Market Value (USD Million) Analysis by Material, 2020 to 2035
  • Figure 110: Eastern Europe Market Volume (Units) Analysis by Material, 2020 to 2035
  • Figure 111: Eastern Europe Market Value Share (%) and BPS Analysis by Material, 2025 to 2035
  • Figure 112: Eastern Europe Market Y-o-Y Growth (%) Projections by Material, 2025 to 2035
  • Figure 113: Eastern Europe Market Value (USD Million) Analysis by End Use, 2020 to 2035
  • Figure 114: Eastern Europe Market Volume (Units) Analysis by End Use, 2020 to 2035
  • Figure 115: Eastern Europe Market Value Share (%) and BPS Analysis by End Use, 2025 to 2035
  • Figure 116: Eastern Europe Market Y-o-Y Growth (%) Projections by End Use, 2025 to 2035
  • Figure 117: Eastern Europe Market Attractiveness by Device Type, 2025 to 2035
  • Figure 118: Eastern Europe Market Attractiveness by Material, 2025 to 2035
  • Figure 119: Eastern Europe Market Attractiveness by End Use, 2025 to 2035
  • Figure 120: Eastern Europe Market Attractiveness by Country, 2025 to 2035
  • Figure 121: South Asia and Pacific Market Value (USD Million) by Device Type, 2025 to 2035
  • Figure 122: South Asia and Pacific Market Value (USD Million) by Material, 2025 to 2035
  • Figure 123: South Asia and Pacific Market Value (USD Million) by End Use, 2025 to 2035
  • Figure 124: South Asia and Pacific Market Value (USD Million) by Country, 2025 to 2035
  • Figure 125: South Asia and Pacific Market Value (USD Million) Analysis by Country, 2020 to 2035
  • Figure 126: South Asia and Pacific Market Volume (Units) Analysis by Country, 2020 to 2035
  • Figure 127: South Asia and Pacific Market Value Share (%) and BPS Analysis by Country, 2025 to 2035
  • Figure 128: South Asia and Pacific Market Y-o-Y Growth (%) Projections by Country, 2025 to 2035
  • Figure 129: South Asia and Pacific Market Value (USD Million) Analysis by Device Type, 2020 to 2035
  • Figure 130: South Asia and Pacific Market Volume (Units) Analysis by Device Type, 2020 to 2035
  • Figure 131: South Asia and Pacific Market Value Share (%) and BPS Analysis by Device Type, 2025 to 2035
  • Figure 132: South Asia and Pacific Market Y-o-Y Growth (%) Projections by Device Type, 2025 to 2035
  • Figure 133: South Asia and Pacific Market Value (USD Million) Analysis by Material, 2020 to 2035
  • Figure 134: South Asia and Pacific Market Volume (Units) Analysis by Material, 2020 to 2035
  • Figure 135: South Asia and Pacific Market Value Share (%) and BPS Analysis by Material, 2025 to 2035
  • Figure 136: South Asia and Pacific Market Y-o-Y Growth (%) Projections by Material, 2025 to 2035
  • Figure 137: South Asia and Pacific Market Value (USD Million) Analysis by End Use, 2020 to 2035
  • Figure 138: South Asia and Pacific Market Volume (Units) Analysis by End Use, 2020 to 2035
  • Figure 139: South Asia and Pacific Market Value Share (%) and BPS Analysis by End Use, 2025 to 2035
  • Figure 140: South Asia and Pacific Market Y-o-Y Growth (%) Projections by End Use, 2025 to 2035
  • Figure 141: South Asia and Pacific Market Attractiveness by Device Type, 2025 to 2035
  • Figure 142: South Asia and Pacific Market Attractiveness by Material, 2025 to 2035
  • Figure 143: South Asia and Pacific Market Attractiveness by End Use, 2025 to 2035
  • Figure 144: South Asia and Pacific Market Attractiveness by Country, 2025 to 2035
  • Figure 145: East Asia Market Value (USD Million) by Device Type, 2025 to 2035
  • Figure 146: East Asia Market Value (USD Million) by Material, 2025 to 2035
  • Figure 147: East Asia Market Value (USD Million) by End Use, 2025 to 2035
  • Figure 148: East Asia Market Value (USD Million) by Country, 2025 to 2035
  • Figure 149: East Asia Market Value (USD Million) Analysis by Country, 2020 to 2035
  • Figure 150: East Asia Market Volume (Units) Analysis by Country, 2020 to 2035
  • Figure 151: East Asia Market Value Share (%) and BPS Analysis by Country, 2025 to 2035
  • Figure 152: East Asia Market Y-o-Y Growth (%) Projections by Country, 2025 to 2035
  • Figure 153: East Asia Market Value (USD Million) Analysis by Device Type, 2020 to 2035
  • Figure 154: East Asia Market Volume (Units) Analysis by Device Type, 2020 to 2035
  • Figure 155: East Asia Market Value Share (%) and BPS Analysis by Device Type, 2025 to 2035
  • Figure 156: East Asia Market Y-o-Y Growth (%) Projections by Device Type, 2025 to 2035
  • Figure 157: East Asia Market Value (USD Million) Analysis by Material, 2020 to 2035
  • Figure 158: East Asia Market Volume (Units) Analysis by Material, 2020 to 2035
  • Figure 159: East Asia Market Value Share (%) and BPS Analysis by Material, 2025 to 2035
  • Figure 160: East Asia Market Y-o-Y Growth (%) Projections by Material, 2025 to 2035
  • Figure 161: East Asia Market Value (USD Million) Analysis by End Use, 2020 to 2035
  • Figure 162: East Asia Market Volume (Units) Analysis by End Use, 2020 to 2035
  • Figure 163: East Asia Market Value Share (%) and BPS Analysis by End Use, 2025 to 2035
  • Figure 164: East Asia Market Y-o-Y Growth (%) Projections by End Use, 2025 to 2035
  • Figure 165: East Asia Market Attractiveness by Device Type, 2025 to 2035
  • Figure 166: East Asia Market Attractiveness by Material, 2025 to 2035
  • Figure 167: East Asia Market Attractiveness by End Use, 2025 to 2035
  • Figure 168: East Asia Market Attractiveness by Country, 2025 to 2035
  • Figure 169: Middle East and Africa Market Value (USD Million) by Device Type, 2025 to 2035
  • Figure 170: Middle East and Africa Market Value (USD Million) by Material, 2025 to 2035
  • Figure 171: Middle East and Africa Market Value (USD Million) by End Use, 2025 to 2035
  • Figure 172: Middle East and Africa Market Value (USD Million) by Country, 2025 to 2035
  • Figure 173: Middle East and Africa Market Value (USD Million) Analysis by Country, 2020 to 2035
  • Figure 174: Middle East and Africa Market Volume (Units) Analysis by Country, 2020 to 2035
  • Figure 175: Middle East and Africa Market Value Share (%) and BPS Analysis by Country, 2025 to 2035
  • Figure 176: Middle East and Africa Market Y-o-Y Growth (%) Projections by Country, 2025 to 2035
  • Figure 177: Middle East and Africa Market Value (USD Million) Analysis by Device Type, 2020 to 2035
  • Figure 178: Middle East and Africa Market Volume (Units) Analysis by Device Type, 2020 to 2035
  • Figure 179: Middle East and Africa Market Value Share (%) and BPS Analysis by Device Type, 2025 to 2035
  • Figure 180: Middle East and Africa Market Y-o-Y Growth (%) Projections by Device Type, 2025 to 2035
  • Figure 181: Middle East and Africa Market Value (USD Million) Analysis by Material, 2020 to 2035
  • Figure 182: Middle East and Africa Market Volume (Units) Analysis by Material, 2020 to 2035
  • Figure 183: Middle East and Africa Market Value Share (%) and BPS Analysis by Material, 2025 to 2035
  • Figure 184: Middle East and Africa Market Y-o-Y Growth (%) Projections by Material, 2025 to 2035
  • Figure 185: Middle East and Africa Market Value (USD Million) Analysis by End Use, 2020 to 2035
  • Figure 186: Middle East and Africa Market Volume (Units) Analysis by End Use, 2020 to 2035
  • Figure 187: Middle East and Africa Market Value Share (%) and BPS Analysis by End Use, 2025 to 2035
  • Figure 188: Middle East and Africa Market Y-o-Y Growth (%) Projections by End Use, 2025 to 2035
  • Figure 189: Middle East and Africa Market Attractiveness by Device Type, 2025 to 2035
  • Figure 190: Middle East and Africa Market Attractiveness by Material, 2025 to 2035
  • Figure 191: Middle East and Africa Market Attractiveness by End Use, 2025 to 2035
  • Figure 192: Middle East and Africa Market Attractiveness by Country, 2025 to 2035

Frequently Asked Questions

What is the future of global thoracolumbar stabilization devices industry?

The global thoracolumbar stabilization devices industry is projected to witness CAGR of 5.5% between 2025 and 2035.

What was the worth of the global thoracolumbar stabilization devices industry in 2024?

The global thoracolumbar stabilization devices industry stood at USD 1,273.1 million in 2024.

What will the worth of global thoracolumbar stabilization devices industry by 2035 end?

The global thoracolumbar stabilization devices industry is anticipated to reach USD 2,294.2 million by 2035 end.

What is the expected CAGR for China during forecast period?

China is expected to show a CAGR of 5.0% in the assessment period.

Who are the key manufacturer of global thoracolumbar stabilization devices industry?

The key players operating in the global thoracolumbar stabilization devices industry are Medtronic plc, DePuy Synthes, Stryker Corporation, Globus Medical, Zimmer Biomet Holdings, NuVasive, Inc., B. Braun Melsungen AG, Orthofix Medical Inc., Alphatec Spine, Inc., Aesculap Implant Systems and Others.

Explore Similar Insights

Future Market Insights

Thoracolumbar Stabilization Devices Market