
- Market Size (2026)
- USD 180.0 Bn
- Forecast (2036)
- USD 426.1 Bn
- CAGR (2026 to 2036)
- 9.0%
How big is Solar Panel Market in 2026?
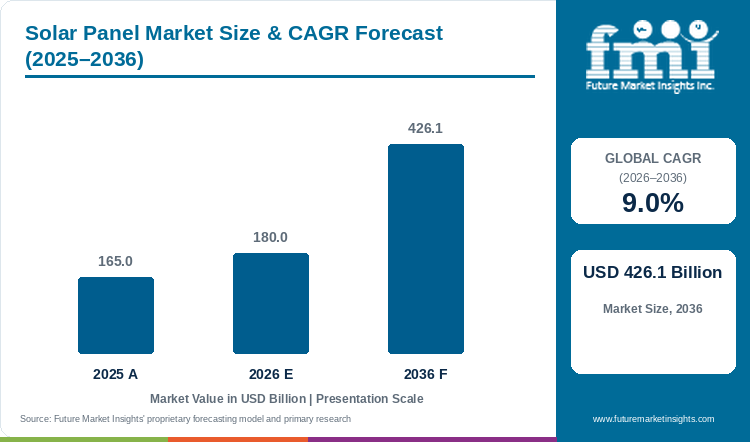
Accounting for USD 165.0 billion in 2025 and rising to USD 180.0 billion in 2026, the solar panel market is projected to expand to USD 426.1 billion by 2036, advancing at a CAGR of 9.0%.
The global solar panel market was valued at USD 165.0 billion in 2025 and is estimated to reach USD 180.0 billion in 2026. Overall industry valuation is projected to reach USD 426.1 billion by 2036, expanding at a compound annual growth rate (CAGR) of 9.0% between 2026 and 2036. Monocrystalline Silicon TOPCon and PERC Cells are estimated to capture a leading 82.0% share of 2026 cell technology demand, given that n-type phosphorus-doped silicon wafers eliminate boron-oxygen light-induced degradation and lift nameplate output above 620 watts per panel. Project-pipeline tracking by FMI indicates that independent power producers, hyperscale data-center off-takers, and industrial enterprises are purchasing 600-watt to 700-watt-plus bifacial modules at record gigawatt volumes since rising electricity loads and land-permitting bottlenecks force developers to pack maximum megawatt-hours onto every tracker row. That high-wattage module repowering cycle outpaces the mature solar power inverter category at a 5.3% CAGR, since developers replace or dense-pack photovoltaic modules across utility and commercial sites while central inverter skids scale at lower per-watt hardware ratios. Global installation statistics published by the International Energy Agency in March 2026 confirm this deployment wave, showing that annual global solar photovoltaic additions surpassed 600 gigawatts in 2025 to lift cumulative installed solar capacity to roughly 2,800 gigawatts [1]. Module manufacturers are commercializing higher-wattage n-type platforms to capture those utility tenders, highlighted when JinkoSolar launched its next-generation Tiger Neo 5.0 TOPCon module in June 2026 delivering over 700 watts of front-side power and up to 25.91% module efficiency after cumulative global module deliveries passed 420 gigawatts [2]. Utility procurement teams and engineering-procurement-construction contractors award multi-year module supply agreements on verified levelized cost of electricity, temperature coefficient stability, and domestic-content tariff compliance through 2036.
Key Market Trends & Insights
- By cell technology: Monocrystalline Silicon TOPCon and PERC Cells hold an estimated 82.0% share in 2026 given that n-type tunnel oxide passivated contact architectures maximize cell conversion efficiency and reduce first-year degradation to 1.0%.
- By module architecture: Bifacial Dual-Glass Solar Modules represent 64.0% in 2026 since double-glass encapsulation captures 5% to 20% rear-side ground-reflected irradiance and prevents moisture ingress.
- By mounting configuration: Ground-Mounted Utility-Scale Solar Farms account for 58.0% in 2026 owing to multi-hundred-megawatt utility procurements and corporate data-center power purchase agreements.
- By system voltage: 1500 Volt Utility Class Modules secure 74.0% in 2026 on account of longer series string lengths that cut combiner-box, copper cabling, and balance-of-system installation costs.
- By end-user sector: Utility and Independent Power Producers (IPPs) command 56.0% in 2026 through centralized grid-scale solar and co-located battery storage auctions.
Regional Highlights
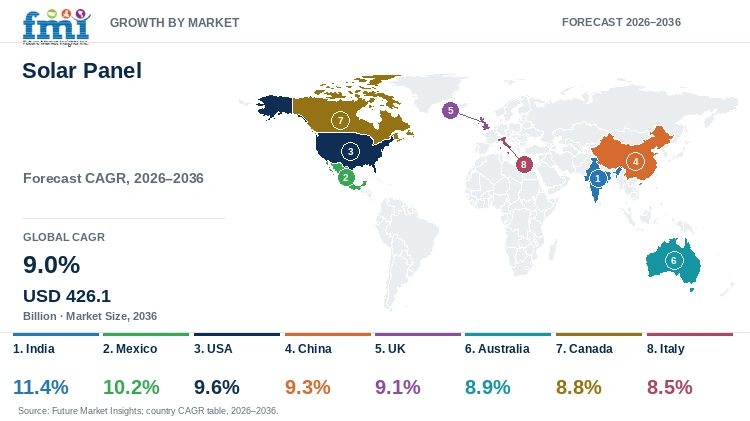
- Top national expansion: India leads national growth projections at an 11.4% CAGR through 2036 under 44.61 GW annual solar additions, domestic ALMM manufacturing rules, and PM Surya Ghar rooftop incentives.
- Broader country progression: Mexico tracks at a 10.2% CAGR ahead of the USA at 9.6% and China at 9.3%, whereas the UK follows at 9.1% and Australia, Canada, and Italy advance at 8.9%, 8.8%, and 8.5%.
Market Size & Forecast
Table 1: Market Size and Forecast for the Solar Panel Market (USD billion and CAGR percentage), 2025 to 2036
| Metric | Value |
|---|---|
| 2025 Market Size | USD 165.0 billion |
| Estimated Market Size in 2026 | USD 180.0 billion |
| Projected Market Size by 2036 | USD 426.1 billion |
| CAGR, 2026 to 2036 | 9.0% |
| Added Revenue, 2026 to 2036 | USD 246.1 billion |
Electric utilities and industrial power buyers face surging daytime and evening load growth from artificial-intelligence data centers, electric vehicle charging networks, and industrial heat electrification. Since solar photovoltaic arrays can be permitted and commissioned in 12 to 24 months compared with 5 to 10 years for gas turbines or nuclear reactors, grid planners rely on bifacial solar modules as the primary source of new generation capacity. Official data from the April 2026 Snapshot of Global PV Markets report from the International Energy Agency Photovoltaic Power Systems Programme, cumulative global installed solar photovoltaic capacity surpassed 2.2 terawatts at the end of 2025 after adding more than 500 gigawatts of new panels in a single year [3]. That multi-terawatt installed base also creates a growing secondary repowering market as early-generation 250-watt poly-Si panels are replaced with 650-watt n-type modules.
Module Wattage Density and System Cost Benchmarks
Table 2: Global Shipment Gigawatts and System Cost Benchmarks for the Solar Panel Market (USD billion and operational ranges), 2025 to 2036
| Metric | 2025 | 2026 | 2036 |
|---|---|---|---|
| Market size (USD billion) | 165.0 | 180.0 | 426.1 |
| Annual global solar PV module shipments (gigawatts DC) | 560.0 to 610.0 | 620.0 to 680.0 | 1,450.0 to 1,620.0 |
| Mainstream utility n-type TOPCon/BC module power rating (watts DC) | 580 to 650 | 610 to 700 | 740 to 850 |
| Mainstream commercial n-type module conversion efficiency (%) | 22.4% to 23.8% | 23.0% to 25.9% | 26.5% to 29.5% |
Operational note: System benchmarks reflect standard 600W to 700W+ utility bifacial modules on 1500V single-axis trackers, 500W commercial rooftop modules, and 400W to 460W residential panels.
Utility engineering contractors optimize project internal rates of return by pairing large-format rectangular silicon wafers (182mm and 210mm) with single-axis solar trackers to reduce structural steel piles and labor hours per megawatt. Official Solar Photovoltaic System Cost Benchmarks published by the US Department of Energy in October 2026 show that representative 100-megawatt-DC utility-scale PV plants deploy 600-watt bifacial modules at 21.9% efficiency while commercial rooftop systems use 500-watt modules at 21.1% efficiency and residential systems use 400-watt monofacial modules at 20.4% efficiency, with US domestic module producers eligible for a Section 45X tax credit of USD 70 per kilowatt-DC [4]. Those higher module wattage ratings directly lower racking, wiring, and land-clearing expenditure per installed watt.
Encapsulation Durability & Lifecycle Material Indicators
Table 3: Module Efficiency, Bifacial Share, and Material Lifecycle Indicators for the Solar Panel Market (operational metrics), 2025 to 2036
| Metric | 2025 | 2026 | 2036 |
|---|---|---|---|
| Cumulative global installed solar PV capacity (terawatts, IEA-PVPS basis) | 2.2 | 2.8 | 9.6 |
| US DOE benchmark utility bifacial module rating & efficiency (watts / %) | 600 W / 21.9% | 625 W / 22.8% | 760 W / 26.8% |
| India domestic solar module manufacturing capacity (GW, MNRE/PIB basis) | 145.0 | 172.0 | 340.0 |
| Bifacial dual-glass share of global utility module shipments (%) | 61.0% to 64.0% | 63.0% to 66.0% | 78.0% to 83.0% |
Table 4: Sectoral Capacity & Institutional Reference Indicators for the Solar Panel Market (values and institutional reference basis), 2026
| Metric | Value | Institutional Reference Basis |
|---|---|---|
| Market size, 2026 | USD 180.0 billion | 2026 global revenue baseline |
| Global annual renewable capacity additions, 2025 | 800.0 GW (+16% YoY, solar PV led) | IEA Global Energy Review 2026 |
| US Section 45X domestic module manufacturing credit | USD 70 per kWdc (USD 0.07/Wdc) | US Department of Energy Solar Cost Benchmarks |
| Ground-Mounted Utility-Scale Solar Farms allocation, 2026 | USD 104.4 billion | 58.0% primary mounting configuration share |
Since n-type TOPCon and heterojunction metallization layers are more sensitive to acetic-acid corrosion than legacy aluminum-back-surface-field cells, module engineers are replacing standard ethylene-vinyl-acetate sheets with low-water-vapor-transmission polyolefin elastomer PV module encapsulant films and 2.0-millimeter tempered dual glass. As documented in a July 2026 technical report from the International Renewable Energy Agency (IRENA), extended 30-to-35-year bifacial dual-glass module lifetimes and design-for-recycling standards are reshaping utility procurement tenders as global cumulative PV waste management regulations take effect [5]. Expansion of warrantied power output from 25 years to 30 years with 0.40% annual degradation materially lowers project levelized cost of electricity.
Analyst Perspective
"The global solar module industry has completed its fastest cell architecture transition in history, moving from p-type PERC to n-type TOPCon and back-contact designs in less than 36 months. Module manufacturers that survive intense polysilicon and wafer price cycles will be those operating tariff-compliant regional assembly hubs in the United States, India, and Europe while bundling high-efficiency 700-watt bifacial modules with utility battery storage."
- Nikhil Kaitwade, Principal Consultant, Future Market Insights.
How is the solar panel market segmented?
The solar panel market is segmented by cell technology, module architecture, mounting configuration, system voltage, and end-user sector. In 2026, Monocrystalline Silicon TOPCon and PERC Cells are projected at 82.0%, Bifacial Dual-Glass Solar Modules at 64.0%, Ground-Mounted Utility-Scale Solar Farms at 58.0%, 1500 Volt Utility Class Modules at 74.0%, and Utility and Independent Power Producers (IPPs) at 56.0%.
By cell technology: Monocrystalline Silicon TOPCon and PERC Cells, Heterojunction (HJT) High-Efficiency Cells, Polycrystalline Multicrystalline Silicon Cells, and Thin-Film Cadmium Telluride (CdTe), CIGS & Perovskite Tandem Cells.
By module architecture: Bifacial Dual-Glass Solar Modules, Monofacial Standard Backsheet Modules, Shingled & Half-Cut High-Density Modules, and Building-Integrated Photovoltaic (BIPV) Glazing & Tiles.
By mounting configuration: Ground-Mounted Utility-Scale Solar Farms, Commercial and Industrial (C&I) Rooftop Systems, Residential Rooftop Solar Installations, and Floating Solar Photovoltaics (FPV) & Agrivoltaic Canopies.
By system voltage: 1500 Volt Utility Class Modules, 1000 Volt Distributed Generation Modules, and Sub-1000 Volt Residential & Off-Grid DC Microgrid Modules.
By end-user sector: Utility and Independent Power Producers (IPPs), Commercial and Industrial (C&I) Enterprises, Residential Homeowners, and Agricultural, Municipal & Off-Grid Infrastructure.
Why do Monocrystalline Silicon TOPCon and PERC Cells lead the cell technology category?
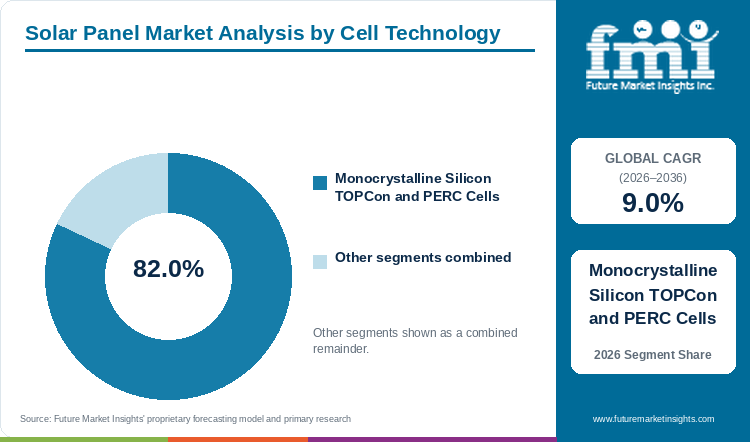
Monocrystalline Silicon TOPCon and PERC Cells hold an estimated 82.0% of cell technology demand in 2026, anchored by 22.5% to 25.9% module efficiency and low light-induced degradation.
Table 5: Cell Technology Share for the Solar Panel Market (percentage share), 2026
| Cell Technology | Share (2026) |
|---|---|
| Monocrystalline Silicon TOPCon and PERC Cells | 82.0% |
| Other Segments Combined | 18.0%* |
| Total | 100.0% |
*Note: Remaining cell technology categories account for the balance of 2026 global solar panel demand.
Table 6: Cell Technology Leadership and Market Growth for the Solar Panel Market (segment and CAGR percentage), 2026 to 2036
| Metric | Value |
|---|---|
| Global CAGR (2026 to 2036) | 9.0% |
| Leading Segment | Monocrystalline Silicon TOPCon and PERC Cells |
Monocrystalline Silicon TOPCon and PERC Cells dominate global photovoltaic manufacturing since n-type tunnel oxide passivated contact structures can be upgraded directly onto existing Czochralski monocrystalline silicon solar wafer production lines while raising cell efficiency above 25.5% and cutting temperature power loss coefficients to minus 0.29% per degree Celsius. Unlike heterojunction cells that require entirely new low-temperature amorphous-silicon deposition lines and high silver-paste loadings, TOPCon allows tier-one manufacturers to scale 50-gigawatt-plus factories at highly competitive per-watt capital costs. Even so, aggressive industry-wide TOPCon capacity additions in China have created periodic module oversupply and severe spot-price compression.
- Within the cell technology segment, Monocrystalline Silicon TOPCon and PERC Cells are projected to account for a leading 82.0% share in 2026, driven by rapid utility and rooftop conversion to n-type TOPCon modules.
- JA Solar delivered its first commercial batch of 650-watt DeepBlue 5.0 n-type TOPCon bifacial modules in October 2025, featuring Bycium+ 5.0 cell architecture with 24.07% module conversion efficiency and 85% bifaciality [6].
What sustains Bifacial Dual-Glass Solar Modules leadership in the module architecture segment?
Bifacial Dual-Glass Solar Modules represent 64.0% of the module architecture category in 2026, supported by rear-side ground-albedo energy yield and 30-year dual-glass encapsulation durability.
Bifacial Dual-Glass Solar Modules replace opaque polymer backsheets with a rear heat-strengthened glass pane and transparent grid fingers, allowing the solar cell string to harvest both direct front sunlight and rear-side light reflected from sand, grass, white roofing membranes, or snow. Removal of polymer thin-film solar PV backsheets also places the silicon cells along a neutral mechanical stress plane between two symmetric 2.0-millimeter glass sheets, preventing micro-cracks under heavy wind and snow loads. Field durability evaluations indexed by the US Department of Energy Office of Scientific and Technical Information in September 2026 confirmed that utility-scale bifacial TOPCon arrays deliver superior multi-year energy yield and mechanical encapsulation stability compared with legacy monofacial architectures [7]. However, dual-glass modules weigh 15% to 20% more than monofacial panels, complicating manual handling on steep residential roofs.
- In 2026, Bifacial Dual-Glass Solar Modules are anticipated to capture 64.0% of global module architecture demand, supported by 30-year power warranties and rear-side albedo energy gains on single-axis trackers.
- While utility ground-mount farms overwhelmingly specify dual-glass bifacial modules, lightweight transparent-backsheet and all-black monofacial back-contact modules retain strong demand across weight-restricted residential and historic commercial rooftops.
How do Ground-Mounted Utility-Scale Solar Farms lead the mounting configuration category?
Ground-Mounted Utility-Scale Solar Farms account for 58.0% of mounting configuration demand in 2026, driven by utility solar-plus-storage auctions and corporate data-center PPAs.
Utility-scale ground-mounted solar farms form the primary volume driver for global module shipments since multi-hundred-megawatt solar parks achieve the lowest levelized cost of electricity across wholesale power markets and corporate clean-energy procurement tenders. Utility developers deploy long rows of high-wattage bifacial modules on automated single-axis trackers and floating solar photovoltaic platforms on hydropower reservoirs to supply clean power to grid operators and data-center campuses. Nevertheless, multi-year high-voltage transmission interconnection queues and transformer shortages in North America and Europe frequently delay ground-mounted project commercial operation dates.
- By mounting configuration, Ground-Mounted Utility-Scale Solar Farms are estimated to reach 58.0% of total category share in 2026 as utilities and independent power producers execute multi-gigawatt solar-plus-storage buildouts.
- Official electric generating capacity statistics published by the US Energy Information Administration in February 2026 confirm that utility-scale solar accounts for 51% (43.4 gigawatts) of the record 86 gigawatts of planned US utility-scale capacity additions in 2026 [8].
Why do 1500 Volt Utility Class Modules lead the system voltage category?
1500 Volt Utility Class Modules secure 74.0% of system voltage share in 2026, supported by longer series strings that reduce DC cabling, combiner boxes, and balance-of-system labor.
1500 Volt Utility Class Modules allow solar plant electrical engineers to connect 26 to 30 high-power modules in a single series string compared with only 18 to 20 modules in legacy 1000-volt architectures, cutting the number of DC combiner boxes, trenching runs, and copper string cables by up to 33%. Higher DC string voltages also raise conversion efficiency across central and string utility-scale PV inverters feeding medium-voltage step-up transformers and co-located battery storage containers. Grid storage tracking published by the US Energy Information Administration in August 2026 documented that 1500-volt utility solar plants host the largest co-located battery storage installations in the United States, exemplified by the 500-megawatt Bellefield Solar and Energy Storage Farm in California [9]. Stricter arc-fault and insulation-resistance safety codes nonetheless limit 1500-volt arrays on occupied residential buildings.
- Strong cost-of-balance-of-system savings across utility and large C&I projects place 1500 Volt Utility Class Modules on course to hold an estimated 74.0% share of the system voltage category in 2026.
- 1000 Volt Distributed Generation Modules are forecast to maintain steady volume across European and Asian commercial factory roofs, schools, and hospital carports where municipal fire codes cap DC rooftop voltages at 1,000 volts.
What gives Utility and Independent Power Producers (IPPs) the leading position in end-user sector?
Utility and Independent Power Producers (IPPs) command 56.0% of end-user sector share in 2026, anchored by multi-gigawatt centralized module tenders and grid-scale storage integration.
Utility and Independent Power Producers (IPPs) command the largest share of global solar panel procurement since state-owned power corporations, investor-owned utilities, and private IPPs sign centralized framework agreements ranging from 500 megawatts to over 20 gigawatts in a single tender round. Centralized bulk purchasing allows IPPs to enforce strict third-party factory electroluminescence audits, hail-impact certifications, and bankability guarantees directly with tier-one module makers. However, negative midday wholesale electricity prices in solar-saturated grids compel IPPs to pair new module orders with four-hour battery energy storage systems.
- Utility and Independent Power Producers (IPPs) are predicted to secure 56.0% of end-user sector demand in 2026, anchored by centralized sovereign renewable auctions and corporate hyperscale PPA contracts.
- Concrete project awards confirm the scale of centralized utility procurement, Astronergy won a record 26.667-gigawatt centralized solar module tender (including 25 gigawatts of n-type TOPCon modules) from China National Nuclear Corporation in June 2025 to supply utility bases across China [10].
What are the drivers, restraints, and opportunities in the solar panel market?
In the solar panel market, hyperscale data-center clean power procurement and 700W+ n-type TOPCon and back-contact efficiency gains are projected to drive adoption whereas trade tariffs and grid interconnection queues restrain cross-border shipments and domestic US/Indian factories and perovskite tandems unlock new margins.
- Driver: Hyperscale data-center clean power purchase agreements and n-type TOPCon and back-contact cell efficiency breakthroughs above 25% accelerate utility and commercial module procurement.
- Restraint: Antidumping and countervailing import tariffs combine with high-voltage grid interconnection backlogs and ultraviolet-induced degradation risks to complicate cross-border module supply.
- Opportunity: Domestic tariff-protected solar manufacturing hubs in the USA and India and perovskite-silicon tandem cells and agrivoltaic canopies open high-margin revenue.
Growth Analysis and Future Potential: Qualitative Demand Catalysts
Continuous cell conversion efficiency gains across n-type TOPCon, heterojunction (HJT), and interdigitated back-contact (IBC) architectures are lowering balance-of-system installation costs and unlocking corporate power purchase agreements across lower-irradiance latitudes. When module efficiency rises from 21.0% to above 25.0%, developers generate 18% more electricity from the exact same land acreage, mounting structure, and cabling footprint while also deploying thin-film cadmium telluride solar cells in high-temperature desert utility arrays. Corporate laboratory milestones confirm this rapid efficiency climb, as Trina Solar announced a world-record 25.44% aperture module efficiency for its large-area fully passivated n-type HJT solar module in January 2025 confirmed by Fraunhofer ISE CalLab [11]. Higher watt-per-square-meter density directly expands C&I rooftop and utility demand.
Risk Assessment of the Solar Panel Market: Operational and Formulation Friction
Trade protectionism, including US Section 201, Section 301, and antidumping and countervailing duties and India's federal ALMM domestic module registry, combines with grid interconnection delays and n-type module degradation mechanisms to restrain frictionless global shipments. Furthermore, thinner passivating oxide layers in n-type TOPCon cells exhibit heightened sensitivity to ultraviolet-induced degradation (UVID), moisture-driven sodium migration, and cell-to-module optical losses if encapsulation quality slips. Technical research published in MDPI Solar in September 2026 investigating commercial PERC, TOPCon, and HJT photovoltaic modules confirmed that mitigating cell-to-module electrical losses and field degradation requires tighter encapsulation and metallization process controls [12]. Tariff compliance audits and curtailment risks frequently delay project financial close.
Commercial Opportunity Analysis: Formulation Differentiation and Value-Add Formats
Module manufacturers are unlocking substantial margin premiums by establishing vertically integrated wafer-cell-module plants inside tariff-protected markets while advancing two-terminal perovskite photovoltaic tandem modules and AI-optimized solar-plus-storage plants. Combination of wide-bandgap perovskite top cells with silicon bottom cells lifts theoretical conversion limits beyond the 29.4% single-junction Shockley-Queisser ceiling, while machine-learning irradiance forecasting maximizes dispatchable revenue from hybrid solar-storage parks. Technical research released on arXiv in September 2026 demonstrated how machine-learning Solar Intelligence forecasting models trained on satellite and ground sensor data accurately predict daily irradiance and module operating temperatures for grid-connected PV dispatch [13]. Suppliers delivering tariff-exempt domestic modules integrated with smart storage capture premium utility pricing.
Solar Panel Market by Country (2026 to 2036)
FMI country modeling indicates that India leads solar panel expansion at an 11.4% CAGR through 2036, while Mexico advances at 10.2%, the USA at 9.6%, China at 9.3%, the UK at 9.1%, Australia at 8.9%, Canada at 8.8%, and Italy at 8.5%. National growth trajectories reflect domestic manufacturing tax credits, import tariff walls, corporate C&I rooftop economics, and utility solar-plus-storage auction volumes.
Table 7: Country CAGR and Primary Growth Levers for the Solar Panel Market (CAGR percentage and operational drivers), 2026 to 2036
| Country | CAGR (2026 to 2036) | Primary Growth Lever |
|---|---|---|
| India | 11.4% | Record 44.61 GW FY26 solar additions, 172 GW domestic ALMM module capacity, and PM Surya Ghar |
| Mexico | 10.2% | Nearshored industrial C&I rooftop solar arrays and northern high-irradiance utility projects |
| USA | 9.6% | AI data-center corporate PPAs, Section 45X domestic cell/module plants, and solar-plus-storage |
| China | 9.3% | Multi-gigawatt western desert renewable bases, C&I rooftops, and 700W+ TOPCon/BC upgrades |
| UK | 9.1% | Contracts for Difference (CfD) utility solar auctions, Clean Power 2030, and warehouse rooftops |
| Australia | 8.9% | 2.1 GW committed large-scale renewable projects and 10kW+ commercial/residential rooftop upgrades |
| Canada | 8.8% | 30% Clean Technology Investment Tax Credit and high-albedo bifacial snow-belt utility arrays |
| Italy | 8.5% | 27.1% PV generation surge, Parco Agrisolare rooftop subsidies, and southern agrivoltaic canopies |
Source: Future Market Insights analysis
India Solar Panel Market Outlook (2026 to 2036)
Demand for solar panels in India is forecast to climb at a leading 11.4% CAGR between 2026 and 2036, driven by record utility-scale solar park auctions, the PM Surya Ghar residential rooftop program, and PM-KUSUM agricultural feeder solarization. What distinguishes India from import-dependent solar markets is the enforcement of the Approved List of Models and Manufacturers (ALMM) and Production-Linked Incentive (PLI) grants that mandate domestically manufactured cells and modules. Official statistics released by the Press Information Bureau of the Government of India in August 2026 reported that India added a record 44.61 gigawatts of solar capacity in FY 2025-26 to reach 162.15 gigawatts installed by June 30, 2026, while domestic solar module manufacturing capacity reached 172 gigawatts [14]. Approval of the 5,000-megawatt PM-SSY floating solar scheme in July 2026 further expands domestic utility module demand.
Key takeaway: In India, record 44.61 GW annual solar installations and 172 GW of domestic ALMM module manufacturing capacity are projected to drive a leading 11.4% CAGR through 2036.
Mexico Solar Panel Market Outlook (2026 to 2036)
In Mexico, solar panel market growth is anticipated to reach a 10.2% CAGR during the 2026 to 2036 assessment window, driven by nearshored manufacturing plants installing behind-the-meter commercial and industrial rooftop arrays and renewed utility-scale solar permitting. Multinational automotive, aerospace, and electronics exporters operating in northern and central Mexican industrial parks face grid transmission constraints and corporate decarbonization mandates that make on-site bifacial and TOPCon rooftop generation highly economical. Market intelligence published by the US International Trade Administration in February 2026 highlights that Mexico's 2025 energy reform defines permit-exempt distributed generation up to 0.7 megawatts and industrial self-generation from 0.7 to 20 megawatts and nine new federal photovoltaic plants [15]. More than 30% of Mexico's industrial sector is actively deploying on-site decarbonization and solar efficiency solutions.
Key takeaway: In Mexico, industrial nearshoring C&I rooftop installations and high-irradiance northern utility solar projects are anticipated to support a 10.2% CAGR.
USA Solar Panel Market Outlook (2026 to 2036)
Commercial solar panel valuation in the USA is forecast to advance at a 9.6% CAGR through 2036, anchored by hyperscale artificial-intelligence data-center power purchase agreements and the buildout of domestic polysilicon, wafer, cell, and module factories under Section 45X manufacturing tax credits. Unlike unsubsidized import markets, US utility and commercial buyers pay a substantial price premium for modules assembled in the United States with domestic solar cells to qualify for the 10% domestic-content Investment Tax Credit adder. Landmark factory commissioning occurred in June 2026 when Qcells began commercial solar cell manufacturing at its vertically integrated Cartersville, Georgia complex, pairing domestic ingot, wafer, cell, and module production under one roof [16]. First Solar's expanding cadmium telluride thin-film plants in Alabama, Louisiana, and Ohio further anchor domestic utility supply.
Key takeaway: In the USA, AI data-center clean power procurement and vertically integrated domestic cell and module factories are forecast to sustain a 9.6% CAGR.
China Solar Panel Market Outlook (2026 to 2036)
China's domestic photovoltaic installation and global export manufacturing base is anticipated to progress at a 9.3% CAGR between 2026 and 2036, supported by multi-gigawatt desert wind-solar-storage megabases in Xinjiang, Inner Mongolia, and Qinghai and county-wide distributed commercial rooftop programs. With over 75% of global wafer, cell, and module output, Chinese manufacturers lead the rapid commercial transition from standard TOPCon toward high-efficiency back-contact (BC) and perovskite-tandem modules to restore gross margins after 2025 price consolidation. Corporate financial disclosures from LONGi Green Energy in April 2026 reported 2025 revenue of CNY 70.347 billion and 86.58 gigawatts of module shipments, including 22.87 gigawatts of high-efficiency HPBC 2.0 back-contact modules reaching 650W to 670W output and 24.8% efficiency [17]. Ultra-high-voltage DC transmission lines connecting western desert arrays to coastal industrial loads sustain massive domestic gigawatt absorption.
Key takeaway: In China, multi-gigawatt desert renewable bases and rapid manufacturing upgrades to back-contact and 700W+ TOPCon modules are projected to drive a 9.3% CAGR.
UK Solar Panel Market Outlook (2026 to 2036)
Solar panel procurement in the UK is estimated to grow at a 9.1% CAGR from 2026 to 2036, driven by the British government's Clean Power 2030 Action Plan, record Contracts for Difference (CfD) utility solar auction awards, and mandatory solar rooftop standards on new commercial warehouses and homes. Compared with high-insolation Mediterranean markets, British solar developers prioritize low-light n-type TOPCon and heterojunction bifacial modules co-located with grid-forming battery energy storage systems to maximize yield under diffuse cloud cover. To demonstrate this integrated deployment model, Trina Solar began delivering its Vertex N high-efficiency modules paired with Elementa battery storage in March 2025 for Low Carbon's Sandon Brook solar-plus-storage project in the United Kingdom [18]. Commercial logistics hubs across the Midlands and southern England provide steady rooftop demand.
Key takeaway: In the UK, Contracts for Difference utility solar auctions and co-located solar-plus-storage projects are estimated to support a 9.1% CAGR through 2036.
Australia Solar Panel Market Outlook (2026 to 2036)
In Australia, demand for solar panels is slated to expand at an 8.9% CAGR over the 2026 to 2036 horizon across utility-scale renewable energy zones and the world's highest-penetration residential and commercial rooftop PV market. With more than one in three Australian detached homes already equipped with solar panels, market growth is shifting toward larger 10-to-15-kilowatt residential system replacements, commercial warehouse arrays, and utility solar-plus-battery dispatchable hubs across New South Wales, Queensland, and Victoria. Official registry data from the Australian Clean Energy Regulator in October 2026 confirmed that 2.1 gigawatts of new large-scale renewable generation capacity reached final investment decision between January and September 2026 while Small-scale Renewable Energy Scheme eligibility expanded from 100 kilowatts to 1 megawatt [19]. High ambient outback temperatures make low-temperature-coefficient TOPCon and back-contact modules the preferred specification.
Key takeaway: In Australia, 2.1 GW of committed utility renewable projects and high-wattage rooftop system upgrades are slated to sustain an 8.9% CAGR.
Canada Solar Panel Market Outlook (2026 to 2036)
Sales of solar panels in Canada are anticipated to advance at an 8.8% CAGR between 2026 and 2036, supported by the federal 30% refundable Clean Technology Investment Tax Credit and utility solar procurements across Ontario, Alberta, and Saskatchewan. Canadian solar installations benefit uniquely from high winter snow-albedo reflection, where dual-glass bifacial modules mounted on elevated single-axis trackers capture up to 20% bonus rear-side electricity generation while shedding snow rapidly as panel surfaces warm. Official energy statistics published by Statistics Canada in April 2026 demonstrated this accelerating capacity footprint, reporting that Canadian solar electricity generation surged 37.4% year-over-year in February 2026 even as hydroelectricity and thermal generation declined [20]. Municipal net-metering programs and Indigenous equity-partnered utility solar farms further expand the Canadian project pipeline.
Key takeaway: In Canada, the 30% Clean Technology Investment Tax Credit and high-albedo bifacial snow-belt installations are anticipated to drive an 8.8% CAGR.
Italy Solar Panel Market Outlook (2026 to 2036)
Italian solar panel demand is predicted to rise at an 8.5% CAGR during 2026 to 2036, anchored by the national Parco Agrisolare agro-industrial rooftop subsidy scheme, FER X utility renewable auctions, and elevated industrial wholesale power prices. Since land-use rules restrict standard ground-mounted solar arrays on productive Italian farmland, developers in Puglia, Sicily, Lazio, and Emilia-Romagna are scaling elevated agrivoltaic tracker canopies and factory rooftop arrays. Dispatch records published by Italian transmission system operator Terna SpA in October 2026 confirmed that national photovoltaic electricity production jumped 27.1% year-over-year in September 2026 to 5,316 gigawatt-hours, supplying 48.6% of all Italian renewable electricity generation as 4,834 megawatts of new PV capacity came online in the first nine months of 2026 [21]. European net-zero manufacturing incentives also support domestic Italian high-efficiency heterojunction module assembly.
Key takeaway: In Italy, a 27.1% surge in photovoltaic electricity generation along with agrivoltaic and Parco Agrisolare rooftop incentives are predicted to maintain an 8.5% CAGR.
Full report country CAGRs cover: North America; Latin America; Western Europe; Eastern Europe; East Asia; South Asia and Pacific; Middle East and Africa.
Who are the notable companies in the solar panel market?
JinkoSolar Holding Co., Ltd., LONGi Green Energy Technology Co., Ltd., Trina Solar Co., Ltd., JA Solar Technology Co., Ltd., Canadian Solar Inc., Hanwha Solutions Corporation (Qcells), Tongwei Co., Ltd., Chint New Energy Technology Co., Ltd. (Astronergy), First Solar, Inc., and Risen Energy Co., Ltd. are the notable companies in the solar panel market.
Competitive structure in the global solar panel market spans vertically integrated ingot-to-module n-type silicon leaders, multi-region utility and distributed module manufacturers, and thin-film cadmium telluride and heterojunction technology specialists. JinkoSolar Holding Group, LONGi Green Energy Technology Group, Trina Solar Group, and JA Solar Technology Group anchor global 600W-to-700W+ TOPCon and back-contact shipments. Canadian Solar, Hanwha Solutions Corporation (Qcells), Tongwei Group, and Chint New Energy Technology Group (Astronergy) scale multi-continent utility and C&I module supply, whereas First Solar and Risen Energy Group lead CdTe thin-film and HJT niches.
- Vertically Integrated Global N-Type Silicon Module Leaders: JinkoSolar Holding Group, LONGi Green Energy Technology Group, Trina Solar Group, and JA Solar Technology Group operate 50-to-100-gigawatt wafer, cell, and module platforms.
- Multi-Region Utility and Distributed Module Manufacturers: Canadian Solar, Hanwha Solutions Corporation (Qcells), Tongwei Group, and Chint New Energy Technology Group (Astronergy) combine high-volume TOPCon manufacturing with regional US, European, and Asian plants.
- Thin-Film Cadmium Telluride and Heterojunction Specialists: First Solar and Risen Energy Group engineer non-silicon CdTe thin-film utility modules and ultra-low-carbon heterojunction (HJT) bifacial panels.
Competitive Benchmarking: Solar Panel Market
Table 8: Competitive Benchmarking for the Solar Panel Market (qualitative capability ratings), 2026
| Company | N-Type TOPCon / BC / Thin-Film Efficiency | Vertical Wafer-to-Module Integration | Tariff-Protected Regional Manufacturing | Geographic Reach |
|---|---|---|---|---|
| JinkoSolar Holding Co., Ltd. | High | High | High | 100 GW integrated capacity across China, US (Florida), and Southeast Asia with 420+ GW cumulative shipments |
| LONGi Green Energy Technology Co., Ltd. | High | High | High | Global wafer and Hi-MO back-contact/TOPCon module leader operating across China, US (Ohio), and Asia |
| Trina Solar Co., Ltd. | High | High | High | Global Vertex N 210R TOPCon module and Elementa storage producer serving 170+ countries |
| JA Solar Technology Co., Ltd. | High | High | Medium | Global DeepBlue 4.0 Pro and 5.0 n-type TOPCon manufacturer with multi-gigawatt Asian plants |
| Canadian Solar Inc. | High | High | High | Global CSI Solar TOPBiHiKu modules and e-STORAGE with factories in US, Canada, China, and Thailand |
| Hanwha Solutions Corporation (Qcells) | High | High | High | Largest US crystalline silicon ingot-wafer-cell-module complex in Cartersville and Dalton, Georgia |
| Tongwei Co., Ltd. | High | High | Medium | World's largest high-purity polysilicon and solar cell producer scaling TNC 2.0 TOPCon modules globally |
| Chint New Energy (Astronergy) | High | High | Medium | Global tier-one ASTRO N TOPCon module supplier with 26.7 GW CNNC utility tender wins |
| First Solar, Inc. | High | High | High | Global CdTe thin-film utility leader with vertically integrated factories in US (OH, AL, LA), India, and Malaysia |
| Risen Energy Co., Ltd. | High | Medium | Medium | Global manufacturer of Hyper-ion 210mm heterojunction (HJT) and Titan n-type solar modules |
Evaluation basis: N-Type TOPCon / BC / Thin-Film Efficiency evaluates documented mass-production module efficiency above 22.5% (or verified CdTe utility performance), whereas Vertical Wafer-to-Module Integration rates captive polysilicon, ingot, wafer, and cell self-sufficiency. Tariff-Protected Regional Manufacturing measures active cell and module factories in the USA, India, Southeast Asia, or Europe.
Key Developments in the Solar Panel Market
- LONGi Green Energy Technology Group unveiled its next-generation Hi-MO X12 (660W-690W, >25.54% efficiency) and Hi-MO 9 Prime (680W, 25.17% efficiency) back-contact solar modules at All Energy Australia on November 1, 2026 and signed strategic distribution agreements targeting 2 gigawatts of module deliveries across Oceania [22].
- Hanwha Solutions Corporation (Qcells) announced on July 20, 2026 that it became the first solar manufacturer to achieve both UL 61215 and IEC 61215 certifications from TÜV Rheinland for its commercial-size M10 two-terminal perovskite-silicon tandem solar modules fabricated on its pilot line in Bitterfeld-Wolfen, Germany [23].
- Canadian Solar reported its second quarter 2026 financial results on August 27, 2026, highlighting 3.1 gigawatts of Q2 module shipments, the July 2026 opening of its 2.1-gigawatt Phase I HJT solar cell plant in Jeffersonville, Indiana, and its June 2026 launch of 670-watt TOPCon 3.0 modules at 24.8% efficiency [24].
Key Players in the Solar Panel Market
Vertically Integrated Global N-Type Silicon Module Leaders
- JinkoSolar Holding Group
- LONGi Green Energy Technology Group
- Trina Solar Group
- JA Solar Technology Group
Multi-Region Utility and Distributed Module Manufacturers
- Canadian Solar
- Hanwha Solutions Corporation (Qcells)
- Tongwei Group
- Chint New Energy Technology Group (Astronergy)
Thin-Film Cadmium Telluride and Heterojunction Specialists
- First Solar
- Risen Energy Group
Solar Panel Market - Report Scope
Table 9: Report Scope for the Solar Panel Market (coverage fields and definitions), 2026 to 2036
| Coverage field | Report scope |
|---|---|
| Market breakdown | Cell Technology; Module Architecture; Mounting Configuration; System Voltage; End-User Sector |
| Quantitative Units | USD Billion |
| Market Definition | Includes commercial manufacturer and turnkey module supplier revenue from framed and frameless photovoltaic solar panels (Monocrystalline N-Type TOPCon, P-Type PERC, Heterojunction HJT, Back-Contact IBC/HPBC, Polycrystalline, Cadmium Telluride CdTe, CIGS, and Perovskite-Silicon Tandem modules) shipped for utility-scale, commercial/industrial, residential, floating, and agrivoltaic power generation. Category Scope Note: Excludes standalone string/central inverters, racking/tracker steel structures, battery energy storage containers, and solar thermal water heaters. |
| Regions Covered | North America; Latin America; Western Europe; Eastern Europe; East Asia; South Asia and Pacific; Middle East and Africa |
| Countries Covered | India, Mexico, USA, China, UK, Australia, Canada, Italy, and additional countries in the full report |
| Key Companies Covered | JinkoSolar Holding Co., Ltd., LONGi Green Energy Technology Co., Ltd., Trina Solar Co., Ltd., JA Solar Technology Co., Ltd., Canadian Solar Inc., Hanwha Solutions Corporation (Qcells), Tongwei Co., Ltd., Chint New Energy Technology Co., Ltd. (Astronergy), First Solar, Inc., Risen Energy Co., Ltd. |
| Forecast Period | 2026 to 2036 |
| Approach | Primary and secondary research with top-down GW capacity additions and bottom-up USD/Wdc ASP triangulation. |
Solar Panel Market - Research Methodology
Table 10: Research Methodology for the Solar Panel Market (research methods and approach), 2026 edition
| Method | Approach |
|---|---|
| Primary Research | Structured interviews with utility solar EPC procurement heads, tier-one cell and module R&D directors, independent power producer asset managers, and independent testing labs (PVEL/RETC) to validate n-type efficiency roadmaps and regional USD/Wdc pricing. |
| Secondary Research | Analysis of IEA Global Energy Review 2026, IEA-PVPS Snapshot of Global PV Markets 2026, U.S. DOE Solar Photovoltaic System Cost Benchmarks, U.S. EIA electric capacity releases, India MNRE/PIB records, Terna dispatch data, and corporate SEC/stock filings. |
| Market Sizing and Forecasting | Top-down global and national solar PV capacity additions reconciled against bottom-up DC module shipment gigawatts (620 to 680 GWdc in 2026) and technology-weighted factory-gate and delivered module ASPs from 2026 to 2036. |
| Country Forecasting Model | Econometric national models weight utility renewable auction schedules, corporate data-center PPA pipelines, domestic manufacturing tax credits (US Section 45X, India PLI/ALMM), and distributed rooftop net-billing rules across eight key countries. |
| Operational Benchmark Traceability | System wattage, efficiency, manufacturing capacity, and cost benchmarks in Tables 2, 3, and 4 trace to U.S. DOE, IEA, IEA-PVPS, U.S. EIA, and Government of India PIB official publications. |
| Data Triangulation and Validation | Revenue estimates isolate finished solar photovoltaic modules while strictly excluding raw polysilicon traded to third parties, standalone inverters, mounting trackers, battery packs, and EPC civil construction labor. |
Solar Panel Market by Segments
Solar Panel Market segmented by Cell Technology:
- Monocrystalline Silicon TOPCon and PERC Cells
- Heterojunction (HJT) High-Efficiency Cells
- Polycrystalline Multicrystalline Silicon Cells
- Thin-Film Cadmium Telluride (CdTe), CIGS & Perovskite Tandem Cells
Solar Panel Market segmented by Module Architecture:
- Bifacial Dual-Glass Solar Modules
- Monofacial Standard Backsheet Modules
- Shingled & Half-Cut High-Density Modules
- Building-Integrated Photovoltaic (BIPV) Glazing & Tiles
Solar Panel Market segmented by Mounting Configuration:
- Ground-Mounted Utility-Scale Solar Farms
- Commercial and Industrial (C&I) Rooftop Systems
- Residential Rooftop Solar Installations
- Water-Surface Solar Photovoltaics (FPV)
- Agrivoltaic Elevated Canopies & Solar Carports
Solar Panel Market segmented by System Voltage:
- 1500 Volt Utility Class Modules
- 1000 Volt Distributed Generation Modules
- Sub-1000 Volt Residential String Modules
- Off-Grid DC Microgrid & Telecom Modules
Solar Panel Market segmented by End-User Sector:
- Utility and Independent Power Producers (IPPs)
- Commercial and Industrial (C&I) Enterprises
- Residential Homeowners
- Agricultural, Municipal & Off-Grid Infrastructure
Solar Panel Market by Region
- North America
- United States
- Canada
- Latin America
- Brazil
- Mexico
- Argentina
- Chile
- Western Europe
- Germany
- France
- United Kingdom
- Italy
- Spain
- Benelux
- Nordics
- Eastern Europe
- Poland
- Czech Republic
- Romania
- Hungary
- East Asia
- China
- Japan
- South Korea
- South Asia and Pacific
- India
- ASEAN
- Australia and New Zealand
- Middle East and Africa
- GCC Countries
- South Africa
- Türkiye
- Israel
Research Sources and Bibliography
- [1] International Energy Agency (IEA). (2026, March 15). Global Energy Review 2026: Technology: Solar PV and wind. IEA Flagship Energy Reports.
- [2] JinkoSolar Holding Co., Ltd. (2026, August 26). JinkoSolar Announces Second Quarter 2026 Financial Results. JinkoSolar Investor Relations News Releases.
- [3] IEA Photovoltaic Power Systems Programme (IEA-PVPS). (2026, April 20). Snapshot of Global PV Markets 2026. IEA-PVPS Official Report T1-49:2026 PDF.
- [4] U.S. Department of Energy. (2026, October 30). Solar Photovoltaic System Cost Benchmarks. DOE Office of Clean Energy Manufacturing and Deployment.
- [5] International Renewable Energy Agency (IRENA). (2026, July 18). End-of-life management for a circular economy: Solar PV panels. IRENA Agency Publications.
- [6] JA Solar Technology Co., Ltd. (2025, October 14). JA Delivers First Batch of 650W DeepBlue 5.0 High-Efficiency n-Type Modules. JA Solar Corporate Press Room.
- [7] Office of Scientific and Technical Information (OSTI). (2026, September 2). PV Durability at Scale: Assessing Bifacial and TOPCon Field Performance. U.S. Department of Energy OSTI Technical Repository (NLR/PR-5K00-101394).
- [8] U.S. Energy Information Administration (EIA). (2026, February 20). New U.S. electric generating capacity expected to reach a record high in 2026. U.S. EIA Today in Energy.
- [9] U.S. Energy Information Administration (EIA). (2026, August 7). Battery storage capacity averaged 70% growth over the last three years. U.S. EIA Today in Energy.
- [10] Chint New Energy Technology Co., Ltd. (Astronergy). (2025, June 18). Astronergy wins record 26.7GW solar bid from CNNC. Astronergy Official Corporate News.
- [11] Trina Solar Co., Ltd. (2025, January 9). Trinasolar Sets Fully Passivated Solar Module Efficiency Record of 25.44%. Trina Solar Global Newsroom.
- [12] Solar (MDPI). (2026, September 8). Investigation of Photovoltaic Module Technologies for Module Integration, Performance Losses, Degradation, and Bifacial-Tandem Architectures. MDPI Solar Open-Access Journal, 6(5), 58.
- [13] arXiv (Cornell University). (2026, September 12). Solar Intelligence. arXiv Preprint Server (arXiv:2609.13648v1).
- [14] Press Information Bureau, Government of India. (2026, August 2). India's Solar Growth Enters a New Era. Ministry of New and Renewable Energy PIB.
- [15] International Trade Administration. (2026, February 12). Mexico - Renewable Energy. U.S. Department of Commerce Trade.gov Country Commercial Guides.
- [16] Hanwha Solutions Corporation (Qcells). (2026, June 9). Qcells Begins Solar Cell Manufacturing at America's First and Only Vertically Integrated Solar Factory in Cartersville, Georgia. Qcells North America News Center.
- [17] LONGi Green Energy Technology Co., Ltd. (2026, April 28). LONGi Reports 2025 Revenue Above CNY 70 Billion as Cost Reductions and Efficiency Gains Drive Sharp Loss Narrowing. LONGi Corporate Newsroom.
- [18] Trina Solar Co., Ltd. (2025, March 16). Trinasolar Begins Deliveries for Integrated Solar and Energy Storage Project at Sandon Brook, UK. Trina Solar Global Newsroom.
- [19] Australian Clean Energy Regulator (CER). (2026, October 20). Large-scale renewable energy data. Australian Government Clean Energy Regulator.
- [20] Statistics Canada. (2026, April 29). The Daily - Energy statistics, February 2026. Government of Canada Official Statistical Release.
- [21] Terna S.p.A. (2026, October 15). Monthly Report On the Electricity System September 2026. Terna Rete Elettrica Nazionale Dispatch Reports.
- [22] LONGi Green Energy Technology Co., Ltd. (2026, November 1). LONGi Unveils Two New Modules at All Energy Australia 2026, Signs Strategic Agreements Targeting 2 GW. LONGi Corporate Newsroom.
- [23] Hanwha Solutions Corporation (Qcells). (2026, July 20). Qcells Becomes the First Company to Achieve UL and IEC Certification by TÜV Rheinland on Next Generation Solar Technology. Qcells North America News Center.
- [24] Canadian Solar Inc. (2026, August 27). Canadian Solar Reports Second Quarter 2026 Results. Canadian Solar Investor Relations News Releases.
This bibliography is provided for reader reference and is not exhaustive. The full report contains the complete reference list and detailed citations.
This Report Answers
- How large is the solar panel market in 2026 and what is forecast for 2036?
- How do hyperscale data-center power purchase agreements and utility storage buildouts drive solar panel demand?
- Why do Monocrystalline Silicon TOPCon and PERC Cells lead the cell technology category?
- Why do Bifacial Dual-Glass Solar Modules lead the module architecture category globally?
- How do national growth rates compare across India, Mexico, the USA, China, the UK, Australia, Canada, and Italy?
- Which leading companies manufacture vertically integrated n-type silicon modules versus CdTe thin-film and HJT panels?
- How do import tariffs, grid interconnection queues, and UV-induced degradation affect solar panel deployments?
- What module specifications should utility and commercial developers evaluate when designing 1500-volt tracker plants?
Table of Content
Table of Content
- Key Takeaways
- Market Size and CAGR
- Top Growth Driver
- Fastest Growing Segment
- Leading Region
- Key Companies
- Emerging Opportunities
- Executive Summary
- Global Market Outlook
- Demand-side Trends
- Supply-side Trends
- Technology Roadmap Analysis
- Analysis and Recommendations
- Analyst Perspective (What is happening? Why now? What should investors know?)
- Key Questions Answered
- How large is the market?
- What is the CAGR?
- What are key trends?
- Which region dominates?
- Who are the leaders?
Read More...
- Market Overview
- Market Coverage / Taxonomy
- Market Definition / Scope / Limitations
- Research Methodology
- Chapter Orientation
- Analytical Lens and Working Hypotheses
- Market Structure, Signals, and Trend Drivers
- Benchmarking and Cross-market Comparability
- Market Sizing, Forecasting, and Opportunity Mapping
- Research Design and Evidence Framework
- Desk Research Programme (Secondary Evidence)
- Expert Input and Fieldwork (Primary Evidence)
- Tooling, Models, and Reference Databases
- Data Engineering and Model Build
- Quality Assurance and Audit Trail
- Market Background
- Market Dynamics (Drivers, Restraints, Opportunity, Trends)
- Scenario Forecast (Optimistic, Likely, Conservative)
- Impact Analysis
- AI Impact
- Sustainability Impact
- Regulatory Impact
- Technology Impact
- Consumer / Buyer Analysis
- Purchase Drivers
- Adoption Barriers
- Buyer Journey
- Opportunity Map Analysis
- Product Life Cycle Analysis
- Supply Chain Analysis
- Investment Feasibility Matrix
- Value Chain Analysis
- PESTLE and Porter's Analysis
- Regulatory Landscape
- Regional Parent Market Outlook
- Production and Consumption Statistics
- Import and Export Statistics
- Global Market Analysis and Forecast, 2021 to 2036
- Historical Market Size Value (USD Billion) Analysis, 2021 to 2025
- Current and Future Market Size Value (USD Billion) Projections, 2026 to 2036
- Y-o-Y Growth Trend Analysis
- Absolute $ Opportunity Analysis
- Global Market Pricing Analysis, 2021 to 2036
- Global Market Analysis and Forecast, By Cell Technology, 2021 to 2036
- Introduction / Key Findings
- Historical Market Size Value (USD Billion) Analysis By Cell Technology, 2021 to 2025
- Current and Future Market Size Value (USD Billion) Analysis and Forecast By Cell Technology, 2026 to 2036
- Monocrystalline Silicon TOPCon and PERC Cells
- Heterojunction (HJT) High-Efficiency Cells
- Polycrystalline Multicrystalline Silicon Cells
- Thin-Film Cadmium Telluride (CdTe), CIGS & Perovskite Tandem Cells
- Y-o-Y Growth Trend Analysis By Cell Technology, 2021 to 2025
- Absolute $ Opportunity Analysis By Cell Technology, 2026 to 2036
- Global Market Analysis and Forecast, By Module Architecture, 2021 to 2036
- Introduction / Key Findings
- Historical Market Size Value (USD Billion) Analysis By Module Architecture, 2021 to 2025
- Current and Future Market Size Value (USD Billion) Analysis and Forecast By Module Architecture, 2026 to 2036
- Bifacial Dual-Glass Solar Modules
- Monofacial Standard Backsheet Modules
- Shingled & Half-Cut High-Density Modules
- Building-Integrated Photovoltaic (BIPV) Glazing & Tiles
- Y-o-Y Growth Trend Analysis By Module Architecture, 2021 to 2025
- Absolute $ Opportunity Analysis By Module Architecture, 2026 to 2036
- Global Market Analysis and Forecast, By Mounting Configuration, 2021 to 2036
- Introduction / Key Findings
- Historical Market Size Value (USD Billion) Analysis By Mounting Configuration, 2021 to 2025
- Current and Future Market Size Value (USD Billion) Analysis and Forecast By Mounting Configuration, 2026 to 2036
- Ground-Mounted Utility-Scale Solar Farms
- Commercial and Industrial (C&I) Rooftop Systems
- Residential Rooftop Solar Installations
- Water-Surface Solar Photovoltaics (FPV)
- Agrivoltaic Elevated Canopies & Solar Carports
- Y-o-Y Growth Trend Analysis By Mounting Configuration, 2021 to 2025
- Absolute $ Opportunity Analysis By Mounting Configuration, 2026 to 2036
- Global Market Analysis and Forecast, By System Voltage, 2021 to 2036
- Introduction / Key Findings
- Historical Market Size Value (USD Billion) Analysis By System Voltage, 2021 to 2025
- Current and Future Market Size Value (USD Billion) Analysis and Forecast By System Voltage, 2026 to 2036
- 1500 Volt Utility Class Modules
- 1000 Volt Distributed Generation Modules
- Sub-1000 Volt Residential String Modules
- Off-Grid DC Microgrid & Telecom Modules
- Y-o-Y Growth Trend Analysis By System Voltage, 2021 to 2025
- Absolute $ Opportunity Analysis By System Voltage, 2026 to 2036
- Global Market Analysis and Forecast, By End-User Sector, 2021 to 2036
- Introduction / Key Findings
- Historical Market Size Value (USD Billion) Analysis By End-User Sector, 2021 to 2025
- Current and Future Market Size Value (USD Billion) Analysis and Forecast By End-User Sector, 2026 to 2036
- Utility and Independent Power Producers (IPPs)
- Commercial and Industrial (C&I) Enterprises
- Residential Homeowners
- Agricultural, Municipal & Off-Grid Infrastructure
- Y-o-Y Growth Trend Analysis By End-User Sector, 2021 to 2025
- Absolute $ Opportunity Analysis By End-User Sector, 2026 to 2036
- Global Market Analysis and Forecast, By Region, 2021 to 2036
- Introduction
- Historical Market Size Value (USD Billion) Analysis By Region, 2021 to 2025
- Current Market Size Value (USD Billion) Analysis and Forecast By Region, 2026 to 2036
- North America
- Latin America
- Western Europe
- Eastern Europe
- East Asia
- South Asia and Pacific
- Middle East and Africa
- Market Attractiveness Analysis By Region
- North America Market Analysis and Forecast, By Country, 2021 to 2036
- Historical Market Size Value (USD Billion) Trend Analysis By Market Taxonomy, 2021 to 2025
- Market Size Value (USD Billion) Forecast By Market Taxonomy, 2026 to 2036
- By Country
- United States
- Canada
- By Cell Technology
- By Module Architecture
- By Mounting Configuration
- By System Voltage
- By End-User Sector
- By Country
- Market Attractiveness Analysis
- By Country
- By Cell Technology
- By Module Architecture
- By Mounting Configuration
- By System Voltage
- By End-User Sector
- Key Takeaways
- Latin America Market Analysis and Forecast, By Country
- Historical Market Size Value (USD Billion) Trend Analysis By Market Taxonomy, 2021 to 2025
- Market Size Value (USD Billion) Forecast By Market Taxonomy, 2026 to 2036
- By Country
- Brazil
- Mexico
- Argentina
- Chile
- By Cell Technology
- By Module Architecture
- By Mounting Configuration
- By System Voltage
- By End-User Sector
- By Country
- Market Attractiveness Analysis
- By Country
- By Cell Technology
- By Module Architecture
- By Mounting Configuration
- By System Voltage
- By End-User Sector
- Key Takeaways
- Western Europe Market Analysis and Forecast, By Country
- Historical Market Size Value (USD Billion) Trend Analysis By Market Taxonomy, 2021 to 2025
- Market Size Value (USD Billion) Forecast By Market Taxonomy, 2026 to 2036
- By Country
- Germany
- France
- United Kingdom
- Italy
- Spain
- Benelux
- Nordics
- By Cell Technology
- By Module Architecture
- By Mounting Configuration
- By System Voltage
- By End-User Sector
- By Country
- Market Attractiveness Analysis
- By Country
- By Cell Technology
- By Module Architecture
- By Mounting Configuration
- By System Voltage
- By End-User Sector
- Key Takeaways
- Eastern Europe Market Analysis and Forecast, By Country
- Historical Market Size Value (USD Billion) Trend Analysis By Market Taxonomy, 2021 to 2025
- Market Size Value (USD Billion) Forecast By Market Taxonomy, 2026 to 2036
- By Country
- Poland
- Czech Republic
- Romania
- Hungary
- By Cell Technology
- By Module Architecture
- By Mounting Configuration
- By System Voltage
- By End-User Sector
- By Country
- Market Attractiveness Analysis
- By Country
- By Cell Technology
- By Module Architecture
- By Mounting Configuration
- By System Voltage
- By End-User Sector
- Key Takeaways
- East Asia Market Analysis and Forecast, By Country
- Historical Market Size Value (USD Billion) Trend Analysis By Market Taxonomy, 2021 to 2025
- Market Size Value (USD Billion) Forecast By Market Taxonomy, 2026 to 2036
- By Country
- China
- Japan
- South Korea
- By Cell Technology
- By Module Architecture
- By Mounting Configuration
- By System Voltage
- By End-User Sector
- By Country
- Market Attractiveness Analysis
- By Country
- By Cell Technology
- By Module Architecture
- By Mounting Configuration
- By System Voltage
- By End-User Sector
- Key Takeaways
- South Asia and Pacific Market Analysis and Forecast, By Country
- Historical Market Size Value (USD Billion) Trend Analysis By Market Taxonomy, 2021 to 2025
- Market Size Value (USD Billion) Forecast By Market Taxonomy, 2026 to 2036
- By Country
- India
- ASEAN
- Australia and New Zealand
- By Cell Technology
- By Module Architecture
- By Mounting Configuration
- By System Voltage
- By End-User Sector
- By Country
- Market Attractiveness Analysis
- By Country
- By Cell Technology
- By Module Architecture
- By Mounting Configuration
- By System Voltage
- By End-User Sector
- Key Takeaways
- Middle East and Africa Market Analysis and Forecast, By Country
- Historical Market Size Value (USD Billion) Trend Analysis By Market Taxonomy, 2021 to 2025
- Market Size Value (USD Billion) Forecast By Market Taxonomy, 2026 to 2036
- By Country
- GCC Countries
- South Africa
- Türkiye
- Israel
- By Cell Technology
- By Module Architecture
- By Mounting Configuration
- By System Voltage
- By End-User Sector
- By Country
- Market Attractiveness Analysis
- By Country
- By Cell Technology
- By Module Architecture
- By Mounting Configuration
- By System Voltage
- By End-User Sector
- Key Takeaways
- Key Countries Market Analysis
- United States
- Pricing Analysis
- Market Share Analysis, 2025
- By Cell Technology
- By Module Architecture
- By Mounting Configuration
- By System Voltage
- By End-User Sector
- Canada
- Pricing Analysis
- Market Share Analysis, 2025
- By Cell Technology
- By Module Architecture
- By Mounting Configuration
- By System Voltage
- By End-User Sector
- Mexico
- Pricing Analysis
- Market Share Analysis, 2025
- By Cell Technology
- By Module Architecture
- By Mounting Configuration
- By System Voltage
- By End-User Sector
- Brazil
- Pricing Analysis
- Market Share Analysis, 2025
- By Cell Technology
- By Module Architecture
- By Mounting Configuration
- By System Voltage
- By End-User Sector
- Chile
- Pricing Analysis
- Market Share Analysis, 2025
- By Cell Technology
- By Module Architecture
- By Mounting Configuration
- By System Voltage
- By End-User Sector
- Germany
- Pricing Analysis
- Market Share Analysis, 2025
- By Cell Technology
- By Module Architecture
- By Mounting Configuration
- By System Voltage
- By End-User Sector
- United Kingdom
- Pricing Analysis
- Market Share Analysis, 2025
- By Cell Technology
- By Module Architecture
- By Mounting Configuration
- By System Voltage
- By End-User Sector
- Italy
- Pricing Analysis
- Market Share Analysis, 2025
- By Cell Technology
- By Module Architecture
- By Mounting Configuration
- By System Voltage
- By End-User Sector
- Spain
- Pricing Analysis
- Market Share Analysis, 2025
- By Cell Technology
- By Module Architecture
- By Mounting Configuration
- By System Voltage
- By End-User Sector
- France
- Pricing Analysis
- Market Share Analysis, 2025
- By Cell Technology
- By Module Architecture
- By Mounting Configuration
- By System Voltage
- By End-User Sector
- India
- Pricing Analysis
- Market Share Analysis, 2025
- By Cell Technology
- By Module Architecture
- By Mounting Configuration
- By System Voltage
- By End-User Sector
- ASEAN
- Pricing Analysis
- Market Share Analysis, 2025
- By Cell Technology
- By Module Architecture
- By Mounting Configuration
- By System Voltage
- By End-User Sector
- Australia and New Zealand
- Pricing Analysis
- Market Share Analysis, 2025
- By Cell Technology
- By Module Architecture
- By Mounting Configuration
- By System Voltage
- By End-User Sector
- China
- Pricing Analysis
- Market Share Analysis, 2025
- By Cell Technology
- By Module Architecture
- By Mounting Configuration
- By System Voltage
- By End-User Sector
- Japan
- Pricing Analysis
- Market Share Analysis, 2025
- By Cell Technology
- By Module Architecture
- By Mounting Configuration
- By System Voltage
- By End-User Sector
- South Korea
- Pricing Analysis
- Market Share Analysis, 2025
- By Cell Technology
- By Module Architecture
- By Mounting Configuration
- By System Voltage
- By End-User Sector
- Poland
- Pricing Analysis
- Market Share Analysis, 2025
- By Cell Technology
- By Module Architecture
- By Mounting Configuration
- By System Voltage
- By End-User Sector
- Hungary
- Pricing Analysis
- Market Share Analysis, 2025
- By Cell Technology
- By Module Architecture
- By Mounting Configuration
- By System Voltage
- By End-User Sector
- Türkiye
- Pricing Analysis
- Market Share Analysis, 2025
- By Cell Technology
- By Module Architecture
- By Mounting Configuration
- By System Voltage
- By End-User Sector
- South Africa
- Pricing Analysis
- Market Share Analysis, 2025
- By Cell Technology
- By Module Architecture
- By Mounting Configuration
- By System Voltage
- By End-User Sector
- Australia
- Pricing Analysis
- Market Share Analysis, 2025
- By Cell Technology
- By Module Architecture
- By Mounting Configuration
- By System Voltage
- By End-User Sector
- United States
- Market Structure Analysis
- Competition Dashboard
- Competition Benchmarking
- Market Share Analysis of Top Players
- By Regional
- By Cell Technology
- By Module Architecture
- By Mounting Configuration
- By System Voltage
- By End-User Sector
- Emerging Startups
- Innovation Benchmarking
- Competition Analysis
- Competition Deep Dive
- JinkoSolar Holding Co., Ltd.
- Overview
- Product Portfolio
- Profitability by Market Segments
- Sales Footprint
- Strategy Overview
- Marketing Strategy
- Product Strategy
- Channel Strategy
- LONGi Green Energy Technology Co., Ltd.
- Trina Solar Co., Ltd.
- JA Solar Technology Co., Ltd.
- Canadian Solar Inc.
- Hanwha Solutions Corporation (Qcells)
- Tongwei Co., Ltd.
- Chint New Energy (Astronergy)
- First Solar, Inc.
- Risen Energy Co., Ltd.
- JinkoSolar Holding Group
- LONGi Green Energy Technology Group
- Trina Solar Group
- JA Solar Technology Group
- Tongwei Group
- Chint New Energy Technology Group (Astronergy)
- Risen Energy Group
- JinkoSolar Holding Co., Ltd.
- Case Studies
- Success Stories
- Recent Developments
- Competition Deep Dive
- Assumptions & Acronyms Used
List of Tables
- Table 1: Global Market Value (USD Billion) Forecast by Region, 2021 to 2036
- Table 2: Global Market Value (USD Billion) Forecast by Cell Technology, 2021 to 2036
- Table 3: Global Market Value (USD Billion) Forecast by Module Architecture, 2021 to 2036
- Table 4: Global Market Value (USD Billion) Forecast by Mounting Configuration, 2021 to 2036
- Table 5: Global Market Value (USD Billion) Forecast by System Voltage, 2021 to 2036
- Table 6: Global Market Value (USD Billion) Forecast by End-User Sector, 2021 to 2036
- Table 7: North America Market Value (USD Billion) Forecast by Country, 2021 to 2036
- Table 8: North America Market Value (USD Billion) Forecast by Cell Technology, 2021 to 2036
- Table 9: North America Market Value (USD Billion) Forecast by Module Architecture, 2021 to 2036
- Table 10: North America Market Value (USD Billion) Forecast by Mounting Configuration, 2021 to 2036
- Table 11: North America Market Value (USD Billion) Forecast by System Voltage, 2021 to 2036
- Table 12: North America Market Value (USD Billion) Forecast by End-User Sector, 2021 to 2036
- Table 13: Latin America Market Value (USD Billion) Forecast by Country, 2021 to 2036
- Table 14: Latin America Market Value (USD Billion) Forecast by Cell Technology, 2021 to 2036
- Table 15: Latin America Market Value (USD Billion) Forecast by Module Architecture, 2021 to 2036
- Table 16: Latin America Market Value (USD Billion) Forecast by Mounting Configuration, 2021 to 2036
- Table 17: Latin America Market Value (USD Billion) Forecast by System Voltage, 2021 to 2036
- Table 18: Latin America Market Value (USD Billion) Forecast by End-User Sector, 2021 to 2036
- Table 19: Western Europe Market Value (USD Billion) Forecast by Country, 2021 to 2036
- Table 20: Western Europe Market Value (USD Billion) Forecast by Cell Technology, 2021 to 2036
- Table 21: Western Europe Market Value (USD Billion) Forecast by Module Architecture, 2021 to 2036
- Table 22: Western Europe Market Value (USD Billion) Forecast by Mounting Configuration, 2021 to 2036
- Table 23: Western Europe Market Value (USD Billion) Forecast by System Voltage, 2021 to 2036
- Table 24: Western Europe Market Value (USD Billion) Forecast by End-User Sector, 2021 to 2036
- Table 25: Eastern Europe Market Value (USD Billion) Forecast by Country, 2021 to 2036
- Table 26: Eastern Europe Market Value (USD Billion) Forecast by Cell Technology, 2021 to 2036
- Table 27: Eastern Europe Market Value (USD Billion) Forecast by Module Architecture, 2021 to 2036
- Table 28: Eastern Europe Market Value (USD Billion) Forecast by Mounting Configuration, 2021 to 2036
- Table 29: Eastern Europe Market Value (USD Billion) Forecast by System Voltage, 2021 to 2036
- Table 30: Eastern Europe Market Value (USD Billion) Forecast by End-User Sector, 2021 to 2036
- Table 31: East Asia Market Value (USD Billion) Forecast by Country, 2021 to 2036
- Table 32: East Asia Market Value (USD Billion) Forecast by Cell Technology, 2021 to 2036
- Table 33: East Asia Market Value (USD Billion) Forecast by Module Architecture, 2021 to 2036
- Table 34: East Asia Market Value (USD Billion) Forecast by Mounting Configuration, 2021 to 2036
- Table 35: East Asia Market Value (USD Billion) Forecast by System Voltage, 2021 to 2036
- Table 36: East Asia Market Value (USD Billion) Forecast by End-User Sector, 2021 to 2036
- Table 37: South Asia and Pacific Market Value (USD Billion) Forecast by Country, 2021 to 2036
- Table 38: South Asia and Pacific Market Value (USD Billion) Forecast by Cell Technology, 2021 to 2036
- Table 39: South Asia and Pacific Market Value (USD Billion) Forecast by Module Architecture, 2021 to 2036
- Table 40: South Asia and Pacific Market Value (USD Billion) Forecast by Mounting Configuration, 2021 to 2036
- Table 41: South Asia and Pacific Market Value (USD Billion) Forecast by System Voltage, 2021 to 2036
- Table 42: South Asia and Pacific Market Value (USD Billion) Forecast by End-User Sector, 2021 to 2036
- Table 43: Middle East and Africa Market Value (USD Billion) Forecast by Country, 2021 to 2036
- Table 44: Middle East and Africa Market Value (USD Billion) Forecast by Cell Technology, 2021 to 2036
- Table 45: Middle East and Africa Market Value (USD Billion) Forecast by Module Architecture, 2021 to 2036
- Table 46: Middle East and Africa Market Value (USD Billion) Forecast by Mounting Configuration, 2021 to 2036
- Table 47: Middle East and Africa Market Value (USD Billion) Forecast by System Voltage, 2021 to 2036
- Table 48: Middle East and Africa Market Value (USD Billion) Forecast by End-User Sector, 2021 to 2036
List of Figures
- Figure 1: Global Market Pricing Analysis
- Figure 2: Global Market Value (USD Billion) Forecast 2021-2036
- Figure 3: Global Market Value Share and BPS Analysis by Cell Technology, 2026 and 2036
- Figure 4: Global Market Y-o-Y Growth Comparison by Cell Technology, 2026-2036
- Figure 5: Global Market Attractiveness Analysis by Cell Technology
- Figure 6: Global Market Value Share and BPS Analysis by Module Architecture, 2026 and 2036
- Figure 7: Global Market Y-o-Y Growth Comparison by Module Architecture, 2026-2036
- Figure 8: Global Market Attractiveness Analysis by Module Architecture
- Figure 9: Global Market Value Share and BPS Analysis by Mounting Configuration, 2026 and 2036
- Figure 10: Global Market Y-o-Y Growth Comparison by Mounting Configuration, 2026-2036
- Figure 11: Global Market Attractiveness Analysis by Mounting Configuration
- Figure 12: Global Market Value Share and BPS Analysis by System Voltage, 2026 and 2036
- Figure 13: Global Market Y-o-Y Growth Comparison by System Voltage, 2026-2036
- Figure 14: Global Market Attractiveness Analysis by System Voltage
- Figure 15: Global Market Value Share and BPS Analysis by End-User Sector, 2026 and 2036
- Figure 16: Global Market Y-o-Y Growth Comparison by End-User Sector, 2026-2036
- Figure 17: Global Market Attractiveness Analysis by End-User Sector
- Figure 18: Global Market Value (USD Billion) Share and BPS Analysis by Region, 2026 and 2036
- Figure 19: Global Market Y-o-Y Growth Comparison by Region, 2026-2036
- Figure 20: Global Market Attractiveness Analysis by Region
- Figure 21: North America Market Incremental Dollar Opportunity, 2026-2036
- Figure 22: Latin America Market Incremental Dollar Opportunity, 2026-2036
- Figure 23: Western Europe Market Incremental Dollar Opportunity, 2026-2036
- Figure 24: Eastern Europe Market Incremental Dollar Opportunity, 2026-2036
- Figure 25: East Asia Market Incremental Dollar Opportunity, 2026-2036
- Figure 26: South Asia and Pacific Market Incremental Dollar Opportunity, 2026-2036
- Figure 27: Middle East and Africa Market Incremental Dollar Opportunity, 2026-2036
- Figure 28: North America Market Value Share and BPS Analysis by Country, 2026 and 2036
- Figure 29: North America Market Value Share and BPS Analysis by Cell Technology, 2026 and 2036
- Figure 30: North America Market Y-o-Y Growth Comparison by Cell Technology, 2026-2036
- Figure 31: North America Market Attractiveness Analysis by Cell Technology
- Figure 32: North America Market Value Share and BPS Analysis by Module Architecture, 2026 and 2036
- Figure 33: North America Market Y-o-Y Growth Comparison by Module Architecture, 2026-2036
- Figure 34: North America Market Attractiveness Analysis by Module Architecture
- Figure 35: North America Market Value Share and BPS Analysis by Mounting Configuration, 2026 and 2036
- Figure 36: North America Market Y-o-Y Growth Comparison by Mounting Configuration, 2026-2036
- Figure 37: North America Market Attractiveness Analysis by Mounting Configuration
- Figure 38: North America Market Value Share and BPS Analysis by System Voltage, 2026 and 2036
- Figure 39: North America Market Y-o-Y Growth Comparison by System Voltage, 2026-2036
- Figure 40: North America Market Attractiveness Analysis by System Voltage
- Figure 41: North America Market Value Share and BPS Analysis by End-User Sector, 2026 and 2036
- Figure 42: North America Market Y-o-Y Growth Comparison by End-User Sector, 2026-2036
- Figure 43: North America Market Attractiveness Analysis by End-User Sector
- Figure 44: Latin America Market Value Share and BPS Analysis by Country, 2026 and 2036
- Figure 45: Latin America Market Value Share and BPS Analysis by Cell Technology, 2026 and 2036
- Figure 46: Latin America Market Y-o-Y Growth Comparison by Cell Technology, 2026-2036
- Figure 47: Latin America Market Attractiveness Analysis by Cell Technology
- Figure 48: Latin America Market Value Share and BPS Analysis by Module Architecture, 2026 and 2036
- Figure 49: Latin America Market Y-o-Y Growth Comparison by Module Architecture, 2026-2036
- Figure 50: Latin America Market Attractiveness Analysis by Module Architecture
- Figure 51: Latin America Market Value Share and BPS Analysis by Mounting Configuration, 2026 and 2036
- Figure 52: Latin America Market Y-o-Y Growth Comparison by Mounting Configuration, 2026-2036
- Figure 53: Latin America Market Attractiveness Analysis by Mounting Configuration
- Figure 54: Latin America Market Value Share and BPS Analysis by System Voltage, 2026 and 2036
- Figure 55: Latin America Market Y-o-Y Growth Comparison by System Voltage, 2026-2036
- Figure 56: Latin America Market Attractiveness Analysis by System Voltage
- Figure 57: Latin America Market Value Share and BPS Analysis by End-User Sector, 2026 and 2036
- Figure 58: Latin America Market Y-o-Y Growth Comparison by End-User Sector, 2026-2036
- Figure 59: Latin America Market Attractiveness Analysis by End-User Sector
- Figure 60: Western Europe Market Value Share and BPS Analysis by Country, 2026 and 2036
- Figure 61: Western Europe Market Value Share and BPS Analysis by Cell Technology, 2026 and 2036
- Figure 62: Western Europe Market Y-o-Y Growth Comparison by Cell Technology, 2026-2036
- Figure 63: Western Europe Market Attractiveness Analysis by Cell Technology
- Figure 64: Western Europe Market Value Share and BPS Analysis by Module Architecture, 2026 and 2036
- Figure 65: Western Europe Market Y-o-Y Growth Comparison by Module Architecture, 2026-2036
- Figure 66: Western Europe Market Attractiveness Analysis by Module Architecture
- Figure 67: Western Europe Market Value Share and BPS Analysis by Mounting Configuration, 2026 and 2036
- Figure 68: Western Europe Market Y-o-Y Growth Comparison by Mounting Configuration, 2026-2036
- Figure 69: Western Europe Market Attractiveness Analysis by Mounting Configuration
- Figure 70: Western Europe Market Value Share and BPS Analysis by System Voltage, 2026 and 2036
- Figure 71: Western Europe Market Y-o-Y Growth Comparison by System Voltage, 2026-2036
- Figure 72: Western Europe Market Attractiveness Analysis by System Voltage
- Figure 73: Western Europe Market Value Share and BPS Analysis by End-User Sector, 2026 and 2036
- Figure 74: Western Europe Market Y-o-Y Growth Comparison by End-User Sector, 2026-2036
- Figure 75: Western Europe Market Attractiveness Analysis by End-User Sector
- Figure 76: Eastern Europe Market Value Share and BPS Analysis by Country, 2026 and 2036
- Figure 77: Eastern Europe Market Value Share and BPS Analysis by Cell Technology, 2026 and 2036
- Figure 78: Eastern Europe Market Y-o-Y Growth Comparison by Cell Technology, 2026-2036
- Figure 79: Eastern Europe Market Attractiveness Analysis by Cell Technology
- Figure 80: Eastern Europe Market Value Share and BPS Analysis by Module Architecture, 2026 and 2036
- Figure 81: Eastern Europe Market Y-o-Y Growth Comparison by Module Architecture, 2026-2036
- Figure 82: Eastern Europe Market Attractiveness Analysis by Module Architecture
- Figure 83: Eastern Europe Market Value Share and BPS Analysis by Mounting Configuration, 2026 and 2036
- Figure 84: Eastern Europe Market Y-o-Y Growth Comparison by Mounting Configuration, 2026-2036
- Figure 85: Eastern Europe Market Attractiveness Analysis by Mounting Configuration
- Figure 86: Eastern Europe Market Value Share and BPS Analysis by System Voltage, 2026 and 2036
- Figure 87: Eastern Europe Market Y-o-Y Growth Comparison by System Voltage, 2026-2036
- Figure 88: Eastern Europe Market Attractiveness Analysis by System Voltage
- Figure 89: Eastern Europe Market Value Share and BPS Analysis by End-User Sector, 2026 and 2036
- Figure 90: Eastern Europe Market Y-o-Y Growth Comparison by End-User Sector, 2026-2036
- Figure 91: Eastern Europe Market Attractiveness Analysis by End-User Sector
- Figure 92: East Asia Market Value Share and BPS Analysis by Country, 2026 and 2036
- Figure 93: East Asia Market Value Share and BPS Analysis by Cell Technology, 2026 and 2036
- Figure 94: East Asia Market Y-o-Y Growth Comparison by Cell Technology, 2026-2036
- Figure 95: East Asia Market Attractiveness Analysis by Cell Technology
- Figure 96: East Asia Market Value Share and BPS Analysis by Module Architecture, 2026 and 2036
- Figure 97: East Asia Market Y-o-Y Growth Comparison by Module Architecture, 2026-2036
- Figure 98: East Asia Market Attractiveness Analysis by Module Architecture
- Figure 99: East Asia Market Value Share and BPS Analysis by Mounting Configuration, 2026 and 2036
- Figure 100: East Asia Market Y-o-Y Growth Comparison by Mounting Configuration, 2026-2036
- Figure 101: East Asia Market Attractiveness Analysis by Mounting Configuration
- Figure 102: East Asia Market Value Share and BPS Analysis by System Voltage, 2026 and 2036
- Figure 103: East Asia Market Y-o-Y Growth Comparison by System Voltage, 2026-2036
- Figure 104: East Asia Market Attractiveness Analysis by System Voltage
- Figure 105: East Asia Market Value Share and BPS Analysis by End-User Sector, 2026 and 2036
- Figure 106: East Asia Market Y-o-Y Growth Comparison by End-User Sector, 2026-2036
- Figure 107: East Asia Market Attractiveness Analysis by End-User Sector
- Figure 108: South Asia and Pacific Market Value Share and BPS Analysis by Country, 2026 and 2036
- Figure 109: South Asia and Pacific Market Value Share and BPS Analysis by Cell Technology, 2026 and 2036
- Figure 110: South Asia and Pacific Market Y-o-Y Growth Comparison by Cell Technology, 2026-2036
- Figure 111: South Asia and Pacific Market Attractiveness Analysis by Cell Technology
- Figure 112: South Asia and Pacific Market Value Share and BPS Analysis by Module Architecture, 2026 and 2036
- Figure 113: South Asia and Pacific Market Y-o-Y Growth Comparison by Module Architecture, 2026-2036
- Figure 114: South Asia and Pacific Market Attractiveness Analysis by Module Architecture
- Figure 115: South Asia and Pacific Market Value Share and BPS Analysis by Mounting Configuration, 2026 and 2036
- Figure 116: South Asia and Pacific Market Y-o-Y Growth Comparison by Mounting Configuration, 2026-2036
- Figure 117: South Asia and Pacific Market Attractiveness Analysis by Mounting Configuration
- Figure 118: South Asia and Pacific Market Value Share and BPS Analysis by System Voltage, 2026 and 2036
- Figure 119: South Asia and Pacific Market Y-o-Y Growth Comparison by System Voltage, 2026-2036
- Figure 120: South Asia and Pacific Market Attractiveness Analysis by System Voltage
- Figure 121: South Asia and Pacific Market Value Share and BPS Analysis by End-User Sector, 2026 and 2036
- Figure 122: South Asia and Pacific Market Y-o-Y Growth Comparison by End-User Sector, 2026-2036
- Figure 123: South Asia and Pacific Market Attractiveness Analysis by End-User Sector
- Figure 124: Middle East and Africa Market Value Share and BPS Analysis by Country, 2026 and 2036
- Figure 125: Middle East and Africa Market Value Share and BPS Analysis by Cell Technology, 2026 and 2036
- Figure 126: Middle East and Africa Market Y-o-Y Growth Comparison by Cell Technology, 2026-2036
- Figure 127: Middle East and Africa Market Attractiveness Analysis by Cell Technology
- Figure 128: Middle East and Africa Market Value Share and BPS Analysis by Module Architecture, 2026 and 2036
- Figure 129: Middle East and Africa Market Y-o-Y Growth Comparison by Module Architecture, 2026-2036
- Figure 130: Middle East and Africa Market Attractiveness Analysis by Module Architecture
- Figure 131: Middle East and Africa Market Value Share and BPS Analysis by Mounting Configuration, 2026 and 2036
- Figure 132: Middle East and Africa Market Y-o-Y Growth Comparison by Mounting Configuration, 2026-2036
- Figure 133: Middle East and Africa Market Attractiveness Analysis by Mounting Configuration
- Figure 134: Middle East and Africa Market Value Share and BPS Analysis by System Voltage, 2026 and 2036
- Figure 135: Middle East and Africa Market Y-o-Y Growth Comparison by System Voltage, 2026-2036
- Figure 136: Middle East and Africa Market Attractiveness Analysis by System Voltage
- Figure 137: Middle East and Africa Market Value Share and BPS Analysis by End-User Sector, 2026 and 2036
- Figure 138: Middle East and Africa Market Y-o-Y Growth Comparison by End-User Sector, 2026-2036
- Figure 139: Middle East and Africa Market Attractiveness Analysis by End-User Sector
- Figure 140: Global Market - Tier Structure Analysis
- Figure 141: Global Market - Company Share Analysis
Frequently Asked Questions
How big is the solar panel market in 2026, and what is forecast for 2036?
FMI estimates that the global solar panel market size stood at USD 165.0 billion in 2025 and reached USD 180.0 billion in 2026. Total industry valuation is projected to hit USD 426.1 billion by 2036 as utility power producers, data-center operators, and industrial enterprises scale 600W-to-700W+ n-type module installations.
What is the CAGR for the solar panel market from 2026 to 2036?
The solar panel sector is projected to expand at a 9.0% CAGR over the 2026 to 2036 forecast period, creating an incremental revenue opportunity of USD 246.1 billion across global utility, commercial, and residential photovoltaic deployments.
Which cell technology segment leads the solar panel market?
Monocrystalline Silicon TOPCon and PERC Cells hold an estimated 82.0% share of cell technology demand in 2026 since n-type tunnel oxide passivated contact wafers achieve module efficiencies up to 25.9% with minimal light-induced degradation.
Which module architecture segment leads the solar panel market?
Bifacial Dual-Glass Solar Modules represent 64.0% of the module architecture category in 2026 owing to 5% to 20% rear-side ground-albedo power gain and 30-year double-glass encapsulation durability.
Which country has a notable growth outlook during the assessment period?
India leads national growth projections at an 11.4% CAGR through 2036, driven by 44.61 GW of annual solar additions in FY 2025-26, 172 GW of domestic ALMM module manufacturing capacity, and PM Surya Ghar rooftop incentives.
Who are the key players in the market?
JinkoSolar Holding Group, LONGi Green Energy Technology Group, Trina Solar Group, JA Solar Technology Group, Canadian Solar, Hanwha Solutions Corporation (Qcells), Tongwei Group, Chint New Energy Technology Group (Astronergy), First Solar, and Risen Energy Group lead global supply.
Preview the report firsthand - request a free sample
Get SampleGet the brochure for pricing and purchase details.
Get PDF
