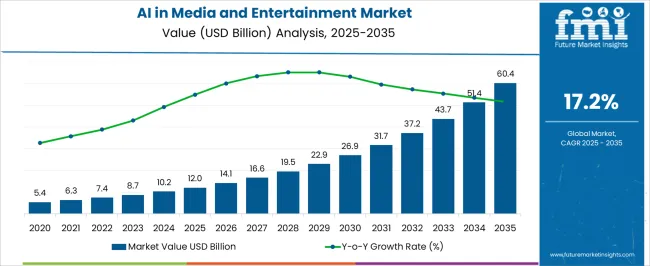
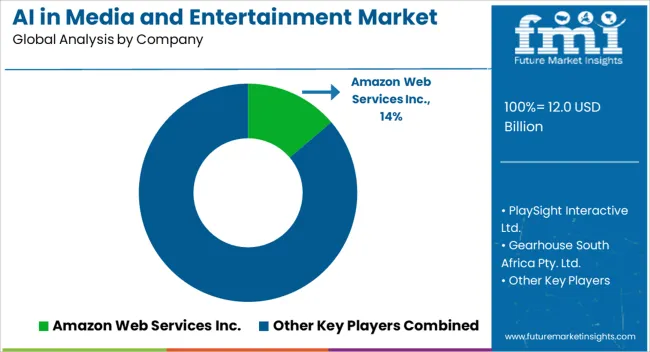
The AI in Media and Entertainment Market is estimated to be valued at USD 12.0 billion in 2025 and is projected to reach USD 60.4 billion by 2035, registering a compound annual growth rate (CAGR) of 17.2% over the forecast period.
| Metric | Value |
|---|---|
| AI in Media and Entertainment Market Estimated Value in (2025 E) | USD 12.0 billion |
| AI in Media and Entertainment Market Forecast Value in (2035 F) | USD 60.4 billion |
| Forecast CAGR (2025 to 2035) | 17.2% |
The AI in media and entertainment market is expanding rapidly, fueled by the surge in digital content consumption and the sector’s shift toward data-driven business models. Industry updates and technology press releases have emphasized the adoption of AI to optimize workflows, reduce operational costs, and enhance customer engagement.
Content providers and streaming platforms are integrating AI tools for automated editing, metadata tagging, and audience analytics, improving efficiency while enabling personalized user experiences. Investor reports from leading technology firms have highlighted strong investments in machine learning algorithms, natural language processing, and computer vision technologies, all of which are being deployed to manage the growing complexity of multimedia content.
Additionally, advertisers and broadcasters are leveraging AI-driven insights to refine targeting and maximize campaign returns. Looking ahead, the market is expected to benefit from deeper integration of generative AI in content creation, advanced personalization engines for user retention, and automated production systems, positioning AI as a transformative force across the media and entertainment value chain.
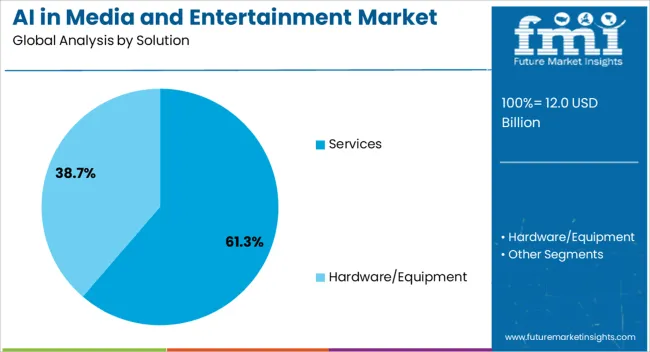
The Services segment is projected to account for 61.3% of the AI in media and entertainment market revenue in 2025, securing its position as the leading solution category. Growth of this segment has been driven by the rising demand for consulting, deployment, and managed services that support AI adoption across content and distribution platforms.
Media companies have relied on service providers to integrate AI systems with existing infrastructure, enabling seamless workflows and minimal disruption. The complexity of deploying advanced AI models for recommendation systems, audience analytics, and automated content curation has increased reliance on third-party expertise.
Managed services have also been favored for ongoing support, updates, and compliance with evolving data privacy regulations. Furthermore, the rapid pace of AI innovation has led companies to seek flexible service arrangements that allow continuous upgrades without major upfront capital commitments. These dynamics have reinforced the Services segment’s leadership, as enterprises prioritize scalability, expertise, and efficiency in their AI adoption journey.
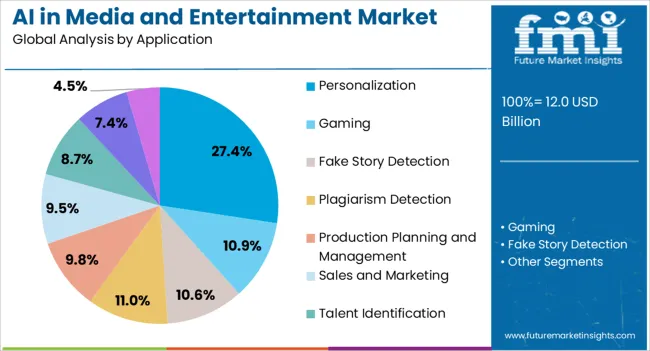
The Personalization segment is projected to contribute 27.4% of the AI in media and entertainment market revenue in 2025, establishing itself as the leading application. This growth has been supported by the increasing demand for customized user experiences in streaming platforms, gaming, publishing, and advertising.
AI algorithms have been utilized to analyze user behavior, preferences, and consumption patterns, allowing content providers to deliver highly relevant recommendations that drive engagement and retention. Industry reports and platform updates have highlighted that personalized experiences directly influence subscriber growth and reduce churn, making personalization a key competitive differentiator.
Advertisers have also embraced AI-driven personalization to tailor campaigns, improving conversion rates and return on investment. The ability of personalization engines to scale across millions of users in real time has made them integral to the digital entertainment ecosystem. With consumer expectations for individualized content rising, the Personalization segment is expected to remain at the forefront of AI applications in media and entertainment.
AI's widespread use in gaming, fake news recognition, plagiarism detection, production planning, and personalization is driving its maturation in the media and entertainment industry. With AI integration, viewer analytics are being enhanced, and the entertainment industry is transforming to gain a competitive edge.
Companies like Storyful, Jukin Media, and Netflix stand to benefit from artificial intelligence (AI) as it improves user experience, streamlines processes, and generates customized content. Through chatbots, speech recognition software, and AI-powered personal assistants like Alexa and Google Assistant, AI is enhancing customer service and enabling hands-free operation while also enriching the entertainment consumer experience.
The application of AI in media and entertainment includes personalized recommendations, efficient automation tools, and enhanced realism in content development, 3D model creation, and music composition. By enhancing Non-Playable Characters (NPCs), improving mechanics, creating realistic behaviors, enhancing player experience, and generating content for a unique gaming experience, AI is elevating the gaming industry.
Online advertisements incorporating AI, such as Google AdSense and AdWords, target individuals based on their browsing history to optimize campaigns and increase effectiveness and conversion rates.
The AI in media and entertainment market has historically developed at a CAGR of 14.6%. However, AI advancements have started progressing at a much better pace, displaying a CAGR of 17.5% from 2025 to 2035.
| Attributes | Details |
|---|---|
| Historical CAGR for 2020 to 2025 | 14.6% |
The entertainment and media industry is facing disruption due to the rapid adoption of connected devices, customer anticipations, and competition from internet video streaming providers and social media. The strikes and protests against AI applications in the entertainment sector are plumbing the progression of the technology.
AI technologies, despite their challenges, hold immense potential to revolutionize the entertainment and media industry. Their application can significantly boost efficiency and profitability. However, their widespread adoption is hindered by factors such as the need for trained personnel, the risk of erroneous data, and the higher costs associated with their complexity.
Cybersecurity threats are becoming a serious concern for user privacy, and data mining is a chance for cybercriminals. The future of the media and entertainment sector could be slowed down by customers’ apprehension with regard to AI gaining entry into their personal information.
The media and entertainment industry is utilizing AI solutions to upgrade its content, personalize customer experiences, and enhance profitability through cutting-edge technology and data-driven insights.
Organizations facing digital transformation require adaptability to achieve success, embracing change and adapting to their environment, allowing the media brands to adapt to meet and exceed expectations.
Through the provision of a modular suite of services, Live Enterprise promotes teamwork and rapid increase in output in business organizations. It enhances decision-making processes on the spot, provides real-time information, and enables people to see data, leading to improved efficiency and agility.
Artificial intelligence enhances analytics by analyzing unstructured data using machine learning and natural language processing. It provides a competitive advantage to organizations through sentiment analysis and dialogue abilities, improving decision-making and customer interactions.
Widespread Demand for the AI-generated Melody Hits the Records
AI-generated music, a unique blend of various tones and genres, is a groundbreaking, innovative approach to music composition that offers influential benefits to the music industry.
Music recommendation systems, such as Shazam and Spotify, utilize user data to build profiles based on artist, tempo, genre, and mood. AI is revolutionizing audio mastering, providing artists with affordable and efficient solutions.
Despite ongoing debates about the superiority of AI-assisted mastering over traditional techniques, automated mastering services like LANDR are undeniably improving audio quality and expediting the production process.
Artificial Intelligence Gains Momentum in Gaming Sector
AI has significantly improved the online gaming industry by automating tasks like animation, character modeling, music composition, and content creation. This has led to cost savings and increased productivity, enhancing the realism of 3D models and original soundtracks.
The gaming industry clutches AI as it enhances game design by improving NPCs, mechanics, and realistic behaviors. It also provides personalized suggestions based on player preferences, thereby dynamically tailoring in-game content and delivering unique gaming experiences.
The gaming industry is embracing adaptive difficulty, a system that uses real-time player behavior analysis to balance challenge and accessibility. AI integration enhances user experience and interfaces, further improving gameplay dynamics.
Rise of AI in the Digital Content Creation on OTT platforms
OTT platforms use AI to create personalized music and video content, advancing user engagement and supporting businesses to develop their user base. The demand for online advertising on OTT platforms, using AI services like Google AdSense and AdWords improves campaign effectiveness and conversion rates.
AI also aids in media regulation by identifying and eliminating objectionable information, ensuring appropriate distribution based on user age and gender, and automating content moderation. Online streaming services use AI to enhance user experience, classify genres, and discover new content by analyzing cast and crew.
Comprehensive assessments of the segments for AI in the media and entertainment industry are provided in the section that follows. While there is a substantial demand for AI software, there is projected to be an uptick in the requirement for content personalization in 2025.
| Attributes | Details |
|---|---|
| Top Solution | Software |
| Revenue share in 2025 | 46% |
With a revenue share of 46%in 2025, the software segment dominated the artificial intelligence in the media and entertainment industry by solution. Growth in the media industry is anticipated to be impacted by the growing usage of software that uses computer-generated visuals and visual effects in movies and commercials.
The integration of sophisticated visual effect structures into the creation of captivating material is made possible by the continuous improvements in AI-based software technology. Film studios and filmmakers increasingly hire qualified agencies for VFX implementation due to a need for more trained professionals in virtual production and AI marketing software.
| Attributes | Details |
|---|---|
| Top Application | Content Personalization |
| Revenue share in 2025 | 28% |
The demand for content personalization is augmented, with an industry share of 28% in 2025. The personalization of content has grown significantly in recent years, with popular streaming platforms like Spotify and Netflix catering to diverse user preferences globally.
Large content libraries are provided by digital platforms, which improve user engagement and retention. AI improves content personalized service by analyzing user behavior and preferences using machine learning algorithms.
By anticipating customer preferences and allowing highly personalized content, AI algorithms are redefining content particularization and increasing user engagement, contentment, and loyalty. Personalization in AI is revolutionizing content creation, enhancing engagement rates, and enhancing marketing campaigns by delivering targeted messages to potential consumers.
<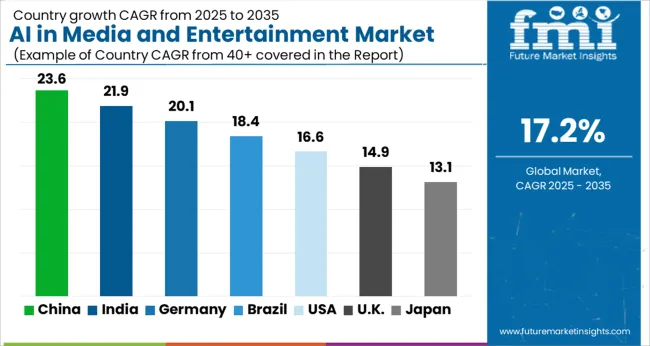 p>Based on the analysis of segments in the AI in media and entertainment market across multiple regions, analysts anticipate significant growth in the media industry in the United States and China. In contrast, sectors in Germany and Japan report a prompt CAGR through 2035. Demand from Australia is striving to hit the roof in the upcoming decade.
| Countries | CAGR from 2025 to 2035 |
|---|---|
| United States | 11.6% |
| Germany | 9% |
| China | 18% |
| Japan | 8.3% |
| Australia | 21% |
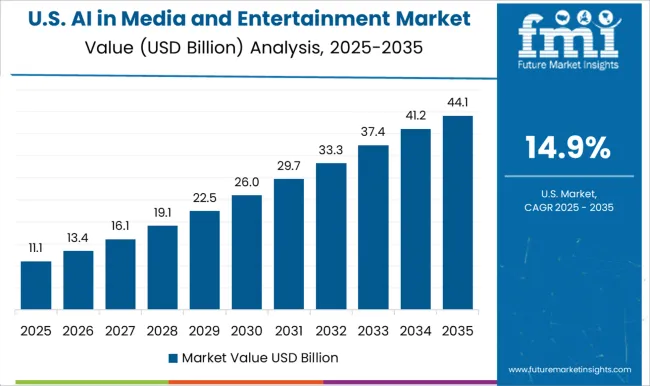
The AI in media and entertainment market in the United States is anticipated to experience a CAGR of 11.6% in the upcoming decade. This is driven by investments in AI-based virtual production software solutions, particularly in voice and speech recognition.
For instance, Sonos Inc. used dialect and accent audio collection from Globalme Localization to enhance its voice recognition engines. As a result, it integrates intelligent home assistants with wireless speakers.
Given large investments in AI projects and other research and development initiatives, the entertainment industry in the United States is projected to provide innovation grounds for industry expansion. For instance, Movies such as Ex Machina, Ready Player One, Alita, Blade Runner 2049, and Her exhibit the influence of AI on flick imagination and raise profound questions about its potential and ethical complexities.
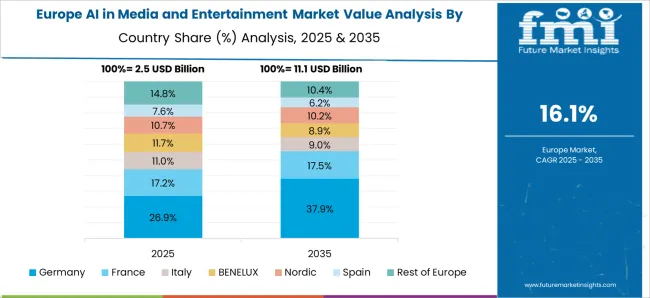
Germany is foreseen to become a significant player in AI software due to numerous media and technology companies and the evolution of next-generation technologies, with a projected 9% CAGR in demand for AI in media, including storytelling and content generation.
For the development of the media industry, German companies are collaborating with different technology companies present in other sectors. For instance, in May 2025, Infosys is anticipated to offer AI technology to Germany-based Handelsblatt Media Group for storytelling and compiling global economic and financial reports.
An 18% CAGR is predicted for the AI in media and entertainment market in China as companies belonging to this country are transforming the OTT strategy with the integration of AI engines for leveraging behavioral and real-time client data for contextualized communication.
China’s online streaming companies like iQIYI, Tencent Video, Youku, and Bilibili offer personalized user experiences based on data accumulation. For instance, China Media Group (CMG) launched its first AI-produced multilingual microdrama, "Chinese Mythology," in March 2025. AI is used to suggest content, resolve buffering and data loss issues, and continuously learn from customer experience to enhance viewer engagement.
Between 2025 and 2035, Australia experienced a remarkable CAGR of 21% in the generative AI in the entertainment sector, and such a trend is anticipated to continue throughout the projected timeframe. Australian government and private organizations have found that strict policies over AI use are lacking, causing concern about the impact of generative AI on misinformation and disinformation.
For instance, research by RMIT University, Washington State University, and QUT Digital Media Research Centre indicates that factors like social media sharing speed and algorithmic bias are beyond control. The Australian AI in media and entertainment market is foreseen to grow in the upcoming decade with the development of rigid AI rules.
Japan’s AI in media and entertainment market is on the brink of revolution with the evolution in AI technology, which is anticipated to register a CAGR of 8.3% from 2025 to 2035.
Several online media platforms in Japan are employing AI technologies to inflate their consumer base. For instance, Tsumugi-nen, a popular virtual YouTuber in Japan, is an AI-generated talent developed by Hayato Akedo and his AI talent agency, Pictoria.
Japan’s entertainment industry is experimenting with AI-related projects, including tea commercials, glamour photography books, and manga storylines. Japan's affinity for futuristic technology and culture is anticipated to lead to a progressive outlook toward AI integration.
Prominent media providers are reliant on partnerships, collaborations, acquisitions, and new software launches to stay afloat in the global landscape. Constant innovations in artificial intelligence to ensure a seamless client-customer relationship are the focus of prominent industry players.
The entertainment industry is abuzz with entrepreneurial activity fueled by the integration of AI. These startups are not just disrupting traditional video processing solutions, they are leading the charge in redefining accessibility in the media business. This is an exciting time where innovation is not confined to standard solutions.
Cloud-based AI solutions are poised to revolutionize the industry by significantly reducing software investment costs. By enhancing the accessibility and user-friendliness of social media platforms, these solutions break down technical barriers, empowering organizations to tackle artificial glitches. Moreover, they enhance user accessibility to social media platforms, further amplifying their impact.
Recent Developments in the AI in Media and Entertainment Sector
The industry is trifurcated into hardware, software, and services when it comes to solution. The hardware category is further segmented into AR/VR devices, AI smart cameras, smart sensors, and other devices.
The software category is further broken down into AI/ML platforms, AI marketing tools, AI-based video analytics tools, and other software. The services category is divided into AI technology consulting, integration and implementation, as well as support and maintenance.
AI in Media and Entertainment is applied for content personalization, subtitle generation, production planning and management, content capture, media analytics, sentiment analysis, others.
The industry is examined across key regions including North America, Latin America, Europe, East Asia, South Asia, Oceania, as well as Middle East and Africa
The global AI in media and entertainment market is estimated to be valued at USD 12.0 billion in 2025.
The market size for the AI in media and entertainment market is projected to reach USD 60.4 billion by 2035.
The AI in media and entertainment market is expected to grow at a 17.2% CAGR between 2025 and 2035.
The key product types in AI in media and entertainment market are services and hardware/equipment.
In terms of application, personalization segment to command 27.4% share in the AI in media and entertainment market in 2025.


Our Research Products

The "Full Research Suite" delivers actionable market intel, deep dives on markets or technologies, so clients act faster, cut risk, and unlock growth.

The Leaderboard benchmarks and ranks top vendors, classifying them as Established Leaders, Leading Challengers, or Disruptors & Challengers.

Locates where complements amplify value and substitutes erode it, forecasting net impact by horizon

We deliver granular, decision-grade intel: market sizing, 5-year forecasts, pricing, adoption, usage, revenue, and operational KPIs—plus competitor tracking, regulation, and value chains—across 60 countries broadly.

Spot the shifts before they hit your P&L. We track inflection points, adoption curves, pricing moves, and ecosystem plays to show where demand is heading, why it is changing, and what to do next across high-growth markets and disruptive tech

Real-time reads of user behavior. We track shifting priorities, perceptions of today’s and next-gen services, and provider experience, then pace how fast tech moves from trial to adoption, blending buyer, consumer, and channel inputs with social signals (#WhySwitch, #UX).

Partner with our analyst team to build a custom report designed around your business priorities. From analysing market trends to assessing competitors or crafting bespoke datasets, we tailor insights to your needs.
Supplier Intelligence
Discovery & Profiling
Capacity & Footprint
Performance & Risk
Compliance & Governance
Commercial Readiness
Who Supplies Whom
Scorecards & Shortlists
Playbooks & Docs
Category Intelligence
Definition & Scope
Demand & Use Cases
Cost Drivers
Market Structure
Supply Chain Map
Trade & Policy
Operating Norms
Deliverables
Buyer Intelligence
Account Basics
Spend & Scope
Procurement Model
Vendor Requirements
Terms & Policies
Entry Strategy
Pain Points & Triggers
Outputs
Pricing Analysis
Benchmarks
Trends
Should-Cost
Indexation
Landed Cost
Commercial Terms
Deliverables
Brand Analysis
Positioning & Value Prop
Share & Presence
Customer Evidence
Go-to-Market
Digital & Reputation
Compliance & Trust
KPIs & Gaps
Outputs
Full Research Suite comprises of:
Market outlook & trends analysis
Interviews & case studies
Strategic recommendations
Vendor profiles & capabilities analysis
5-year forecasts
8 regions and 60+ country-level data splits
Market segment data splits
12 months of continuous data updates
DELIVERED AS:
PDF EXCEL ONLINE
Entertainment Transcription Market
Smart Entertainment Systems Market Trends- Growth to 2035
Family Entertainment Center (FEC) Market Size and Share Forecast Outlook 2025 to 2035
In-flight Entertainment & Connectivity Market
Intermediate Bulk Container (IBC) Market Forecast and Outlook 2025 to 2035
Breaking Down Market Share in Intermediate Bulk Containers
Japan Intermediate Bulk Container Market Insights – Growth & Forecast 2023-2033
Korea Intermediate Bulk Container Market Growth – Trends & Forecast 2023-2033
Western Europe Intermediate Bulk Container Market Growth – Trends & Forecast 2023-2033
Family/Indoor Entertainment Centres Market Report – Forecast 2017-2027
Asia Pacific In-Car Entertainment System Market Size and Share Forecast Outlook 2025 to 2035
Market Share Distribution Among FIBC (Flexible Intermediate Bulk Container) Manufacturers
AI-Powered Embryo Selection Market Analysis - Size, Share, and Forecast Outlook 2025 to 2035
AI Code Assistant Market Size and Share Forecast Outlook 2025 to 2035
AI-Based Data Observability Software Market Size and Share Forecast Outlook 2025 to 2035
Air Fryer Paper Liners Market Size and Share Forecast Outlook 2025 to 2035
Air Struts Market Size and Share Forecast Outlook 2025 to 2035
AI-powered Wealth Management Solution Market Size and Share Forecast Outlook 2025 to 2035
Airless Paint Spray System Market Size and Share Forecast Outlook 2025 to 2035
AI Powered Software Testing Tool Market Size and Share Forecast Outlook 2025 to 2035

Thank you!
You will receive an email from our Business Development Manager. Please be sure to check your SPAM/JUNK folder too.
Chat With
MaRIA