Adaptive Cruise Control and Blind Spot Detection Market Size, Share, and Forecast Outlook 2025 to 2035

The global adaptive cruise control and blind spot detection market is estimated at 6.9 billion in 2025 and is projected to reach 14.9 billion by 2035, reflecting a compound annual growth rate of 7.8% and a multiplying factor of approximately 2.2 over the decade. Market share dynamics are influenced by technological advancement, regulatory frameworks, and consumer demand for enhanced vehicle safety.
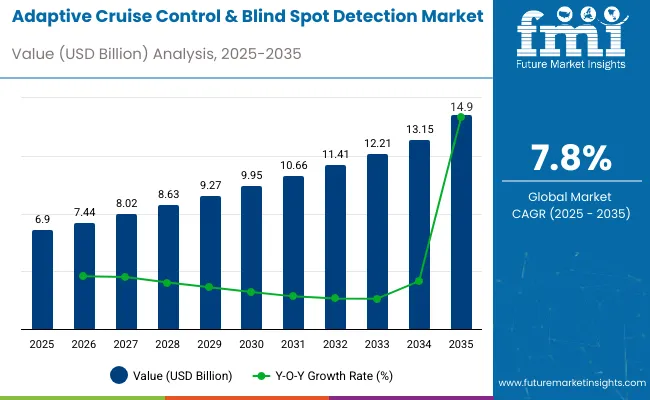
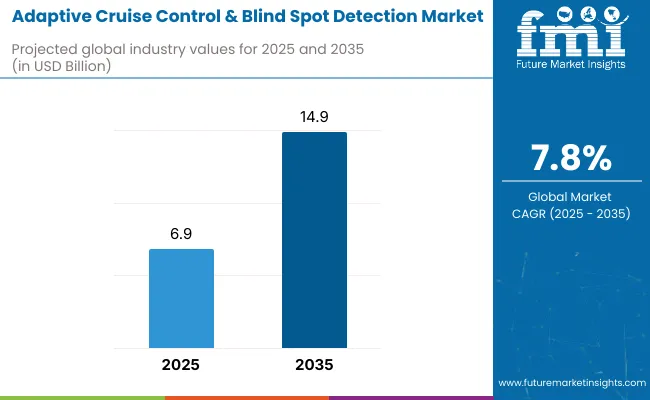
Adaptive Cruise Control And Blind Spot Detection Market Value Analysis

Quick stats of adaptive cruise control and blind spot detection market

  • Adaptive Cruise Control and Blind Spot Detection Market Size (2025): USD 6.9 billion
  • Projected Adaptive Cruise Control and Blind Spot Detection Market Size (2035): USD 14.9 billion
  • Forecast CAGR of Adaptive Cruise Control and Blind Spot Detection Market (2025-2035): 7.8%
  • Leading Segment of Adaptive Cruise Control and Blind Spot Detection Market (2025): Adaptive cruise control (55% share)
  • Key Growth Regions of Adaptive Cruise Control and Blind Spot Detection Market: North America, Europe, Asia Pacific
  • Top Key Players of Adaptive Cruise Control and Blind Spot Detection Market: Continental AG, Delphi Technologies PLC, Robert Bosch GmbH
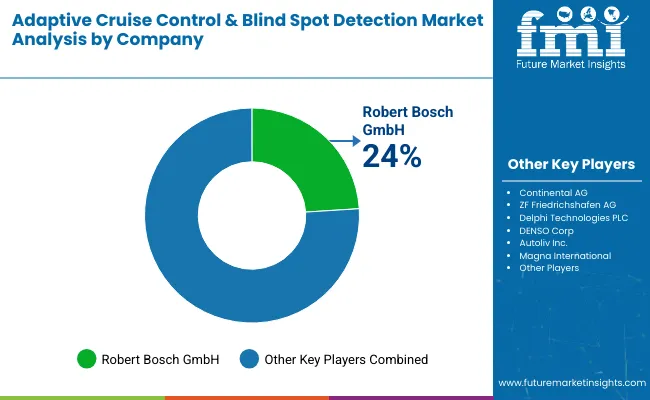
  • Leading Player Share of Adaptive Cruise Control and Blind Spot Detection Market (2025): Robert Bosch GmbH - 24%

Adaptive Cruise Control And Blind Spot Detection Market

Metric Value
Estimated Value in (2025E) USD 6.9 billion
Forecast Value in (2035F) USD 14.9 billion
Forecast CAGR (2025 to 2035) 7.8%

Companies offering integrated systems with superior sensor accuracy, rapid response, and advanced connectivity are positioned to strengthen their presence, while those slower to adopt innovation may experience gradual decline.

Regional developments play a significant role in shaping competitive positions. North America and Europe retain considerable market influence due to early adoption of advanced driver assistance technologies and strict safety regulations. Asia Pacific is expected to record substantial growth driven by rising automotive production and increased awareness of vehicle safety features.

The 7.8% CAGR signals steady market expansion, with individual company performance depending on system integration, strategic partnerships with vehicle manufacturers, and cost efficiency. By 2035, with the market reaching 14.9 billion, firms emphasizing AI-enabled detection, seamless integration, and technological differentiation are expected to consolidate market share, whereas less adaptive players may face incremental erosion, reflecting the sector’s innovation-driven and competitive landscape.

The adaptive cruise control and blind spot detection market is supported by multiple parent sectors. Automotive electronics and advanced driver-assistance systems (ADAS) contribute around 36%, as these features are integrated into modern vehicles for safety and convenience.

Vehicle manufacturing represents roughly 29%, reflecting adoption in both passenger cars and commercial vehicles. Sensor and radar technology providers account for approximately 18%, supplying LIDAR, ultrasonic, and radar modules. Software and connectivity solutions make up about 11%, covering AI algorithms, control units, and vehicle network integration. Aftermarket and regulatory services contribute near 6%, assisting with retrofitting, testing, and compliance certification.

The industry is moving toward enhanced automation, AI-driven detection, and integration with smart vehicle systems. Manufacturers are deploying multi-sensor solutions that combine radar, lidar, and cameras for precise object recognition and collision avoidance. Machine learning algorithms improve adaptive cruise control by predicting traffic patterns and adjusting speed proactively.

Blind spot detection systems are being paired with lane-keeping assistance and automated braking for holistic safety. Automakers are increasingly collaborating with software and sensor technology firms to offer scalable ADAS features across vehicle segments. Energy-efficient, compact modules and predictive diagnostics are becoming standard to reduce system cost while enhancing performance and reliability.

Top Adaptive Cruise Control and Blind Spot Detection Market Dynamics

Growth is driven by increasing adoption of advanced driver-assistance systems (ADAS) in passenger vehicles, commercial trucks, and electric vehicles. ACC and BSD enhance safety and reduce collision risk by maintaining safe distance and alerting drivers to adjacent vehicle presence. Premium and mid-range vehicle segments contribute the majority of revenue, while fleet operators are adopting these technologies in commercial trucks.

Integration with lane keeping, automated braking, and connected vehicle systems increases functionality, while component costs per vehicle range from USD 400 to USD 1,200 depending on sensor type and software complexity.

Driving Force Safety Regulations and Consumer Awareness

Governments are encouraging adoption of ACC and BSD through safety standards and incentives, particularly in Europe, North America, and Asia Pacific. Consumer awareness of collision avoidance and accident reduction drives demand. ACC improves highway driving efficiency, reducing fuel consumption by up to 8% in stop-and-go traffic, while BSD mitigates lane-change accidents.

Electric and hybrid vehicle adoption supports the growth of ACC/BSD systems due to integration with smart propulsion and braking controls. OEMs increasingly standardize these systems to maintain competitiveness, and software upgrades enhance long-term value.

  • ACC can reduce fuel consumption by up to 8% in congested traffic.
  • Fleet adoption in commercial trucks is rising 10-12% annually.
  • Europe and North America account for more than 55% of system deployment.

Growth Avenue Sensor and Software Innovation

Radar, LiDAR, ultrasonic, and camera-based sensors are advancing system accuracy and detection range. Sensor fusion improves reliability under varying weather and lighting conditions. Software algorithms are evolving to provide adaptive responses, emergency braking, and predictive alerts. Modular system design allows OEMs to integrate ACC/BSD with other ADAS features efficiently. Expansion in mid-range vehicle segments and commercial fleets presents opportunities for wider adoption and recurring software updates as a revenue stream.

  • Sensor fusion enhances detection accuracy in challenging conditions.
  • Modular system design accelerates OEM integration and reduces cost.
  • Software updates extend system functionality and lifecycle value.

Emerging Trend Connectivity and Autonomous Integration

ACC and BSD systems are increasingly integrated with connected vehicle platforms and semi-autonomous driving technologies. Data from fleet vehicles is used to improve system performance and predictive maintenance. Adaptive algorithms adjust cruise and braking behavior based on traffic patterns, enhancing safety and reducing wear on brakes.

Integration with vehicle-to-vehicle (V2V) communication supports coordinated driving in congested corridors, while telematics provides operators with real-time diagnostics. Consumer demand for connected features drives investment in cloud-based software and over-the-air updates.

  • V2V integration enhances traffic coordination and accident avoidance.
  • Predictive maintenance reduces unexpected component failures by 12-15%.
  • Cloud-based software enables over-the-air updates for system improvement.

Market Challenge High Costs and Regulatory Complexity

High system costs, ranging from USD 400 to USD 1,200 per vehicle, limit adoption in entry-level models. Integration into existing vehicle electronics, braking, and steering systems increases engineering and calibration time by 5-10%. Different safety standards across regions require multiple system certifications and software variants.

Supply chain constraints for radar, LiDAR, and high-precision cameras can extend lead times by 6-8 weeks. Smaller manufacturers face challenges in meeting regulatory compliance and controlling production costs, creating barriers to market penetration.

  • System costs range from USD 400-1,200 depending on sensor type.
  • Integration complexity adds 5-10% more engineering time per vehicle.
  • Supply constraints for sensors can delay production by 6-8 weeks.

Analyzing Adaptive Cruise Control & Blind Spot Detection Market by Top Investment Segments

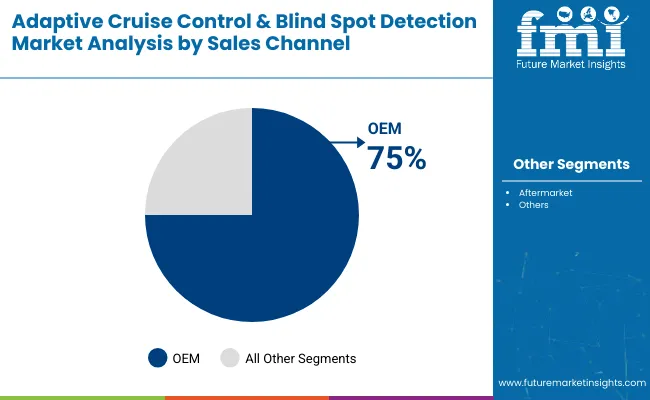
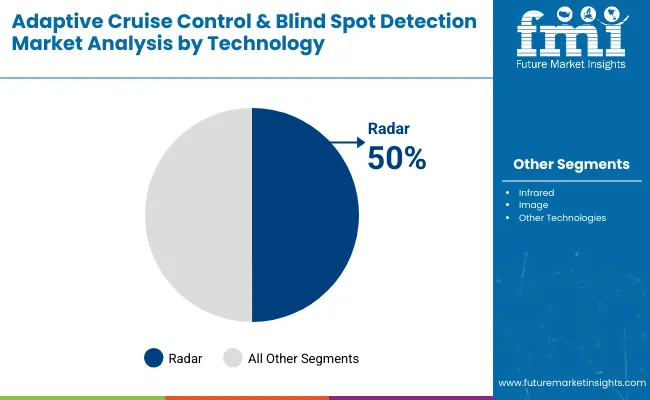
The Adaptive Cruise Control (ACC) & Blind Spot Detection (BSD) market is expanding due to rising demand for advanced driver assistance systems. ACC leads with 55% share, supported by passenger car adoption at 70%. OEM channels dominate with 75% share, reflecting strong integration into new models.

Radar technology accounts for 50%, offering reliability in various weather conditions. Companies such as Bosch, Continental, Denso, and Autoliv drive innovation through radar-based modules and camera-assisted systems. Regulations in Europe, North America, and Asia are accelerating adoption across passenger and commercial vehicles. Growth is supported by consumer demand for improved safety, reduced collision risk, and comfort in long-distance driving.
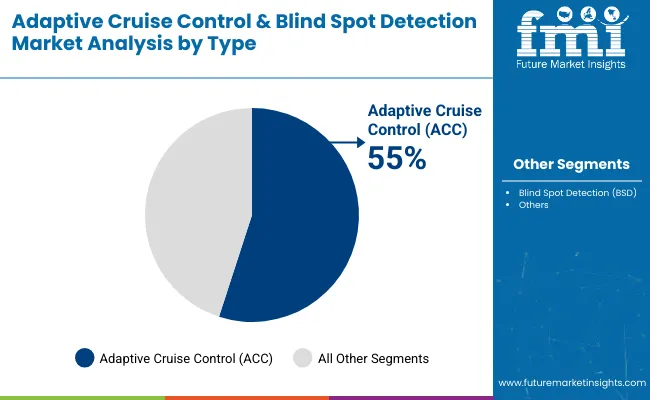
Adaptive cruise control dominates by Type with 55% share

Adaptive Cruise Control And Blind Spot Detection Market By Type

Adaptive Cruise Control accounts for 55% of the market, as automakers equip vehicles with speed and distance management features that enhance highway driving safety. Blind Spot Detection follows with 45%, supporting lane-changing assistance. Leading companies including Bosch, Continental, and ZF Friedrichshafen deliver ACC systems using radar, cameras, and control modules integrated into driver assistance packages. Passenger cars, SUVs, and luxury vehicles show higher ACC integration rates compared to commercial fleets. Expansion of semi-autonomous driving technologies further boosts demand for ACC, particularly in developed markets where driver convenience is a priority.
  • ACC systems are integrated in more than 40% of luxury cars sold in 2024.
  • Typical detection range extends between 30-250 meters.
  • ACC adoption is forecast to grow at over 12% CAGR through 2030.

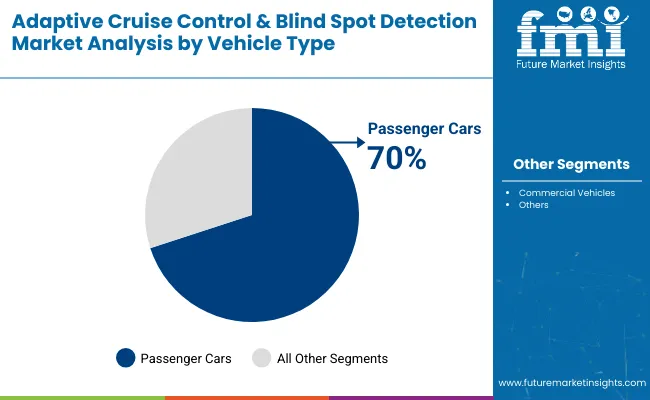
Passenger cars lead by Vehicle Type with 70% share

Adaptive Cruise Control And Blind Spot Detection Market By Vehicle Type

Passenger cars represent 70% of demand, reflecting the rising use of ADAS features in mid-range and premium vehicles. Commercial vehicles hold 30%, driven by fleet safety requirements and government mandates. Carmakers such as Toyota, Hyundai, BMW, and Mercedes-Benz deploy ACC and BSD systems in sedans, SUVs, and electric vehicles, creating higher penetration in advanced markets.

Safety regulations in Europe and Asia Pacific require passenger vehicles to feature collision-prevention systems, which drives rapid adoption. Premium passenger car brands integrate multi-sensor configurations to provide lane-keeping, speed control, and blind spot alerts simultaneously, enhancing driver confidence in congested roads.
  • Average ACC penetration in European passenger cars exceeds 55%.
  • BSD adoption in SUVs grew by 18% between 2023 and 2025.
  • Passenger car models typically feature 3-6 sensors per system.

OEMs dominate Sales Channel with 75% share

Adaptive Cruise Control And Blind Spot Detection Market By Sales Channel

Original Equipment Manufacturers account for 75% of ACC and BSD demand as systems are factory-installed in new vehicles to meet global safety mandates. Aftermarket suppliers cover 25%, mainly serving older vehicles or regional fleets. Companies like Denso, Valeo, and Continental collaborate with automakers for large-scale integration of radar, infrared, and camera-based detection units.

OEM dominance is fueled by rising consumer expectations for safety features as standard equipment, reducing aftermarket reliance in developed markets. Emerging economies also show OEM-led adoption, with compact and mid-range cars increasingly offering ACC and BSD as part of standard or optional safety packages.
  • OEM-installed systems typically increase vehicle cost by USD 800-USD 1500.
  • Aftermarket BSD kits have an average installation time of 2-3 hours.
  • Over 65% of 2025 car models globally are expected to include ACC as standard.

Radar technology dominates by 50% share in 2025

Adaptive Cruise Control And Blind Spot Detection Market By Technology

Radar leads AVAS technology with 50% share, providing reliable detection of surrounding vehicles under multiple weather conditions. Infrared and image-based systems each capture 20%, while other technologies contribute 10%. Radar modules operate effectively in poor visibility, making them widely adopted by automakers.

Bosch, Autoliv, and Continental manufacture compact radar units that integrate with braking and steering control systems, enabling adaptive cruise and blind spot features. Radar systems are particularly important in highway safety, collision avoidance, and long-range detection. Image and infrared sensors complement radar by providing close-range accuracy, but radar continues to dominate due to cost efficiency and proven reliability.
  • Millimeter-wave radar operates in 24 GHz or 77 GHz frequency bands.
  • Average radar module detection angle ranges between 120-150 degrees.
  • Radar integration is projected to expand at 14% CAGR through 2032.

Top Countries Expanding, Producing, and Integrating Adaptive Cruise Control and Blind Spot Detection Market

Adaptive Cruise Control And Blind Spot Detection Market Country Wise Analysis

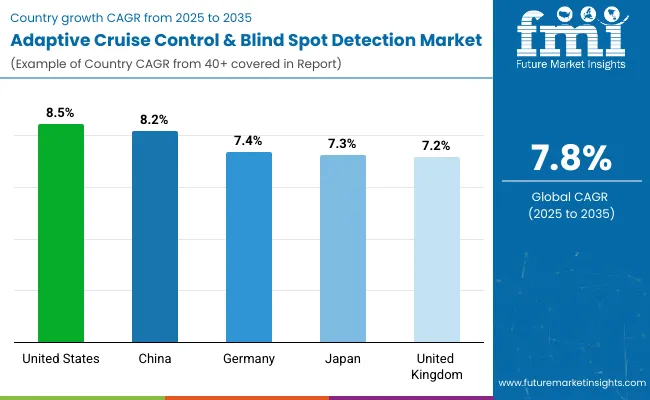
CAGR trends in the adaptive cruise control (ACC) and blind spot detection (BSD) market reflect varying growth across economies. The United States records the highest growth at 8.5%, supported by OECD-driven safety regulations and a strong demand for advanced driver-assistance systems. China follows at 8.2%, with BRICS-led automotive innovation and rising adoption of connected vehicles strengthening expansion.

Germany posts 7.4%, while Japan stands at 7.3%, both aligned with steady integration in technologically advanced but mature automotive markets. The United Kingdom records 7.2%, reflecting consistent demand within OECD frameworks. Overall, BRICS economies such as China are showing faster adoption, while OECD members focus on regulatory compliance, incremental innovation, and enhancing vehicle safety standards across passenger and commercial fleets.

Market Growth for ACC and BSD in the United States

The United States market is projected to grow at a CAGR of 8.5%, supported by rising demand for advanced driver assistance systems across premium and mid-range passenger vehicles. Regulatory frameworks for vehicle safety are pushing automakers to integrate ACC and BSD as standard in new models. Increasing highway traffic and accident rates are strengthening adoption, particularly in states with large commuting populations.

Local manufacturers are investing in radar and camera-based solutions to improve lane monitoring and adaptive braking efficiency. Strong presence of global automotive technology firms ensures continuous innovation. By 2035, ACC and BSD are expected to be integrated into more than 70% of new cars sold in the country.

  • Over 15 million vehicles forecast to be ACC-equipped by 2030
  • Radar-based BSD modules projected to grow at 12% annually
  • Mid-range car integration of ACC forecast to expand 10% per year

Expansion of ACC and BSD Market in China

China, with a CAGR of 8.2%, is witnessing strong uptake of adaptive safety systems due to rapid electrification and government safety mandates. Domestic automakers are heavily investing in integrating ACC and BSD into both low-cost and luxury vehicles.

The presence of large-scale production hubs gives China a cost advantage in component manufacturing. Rising demand for smart mobility solutions in tier 1 and tier 2 cities is further accelerating the market. Partnerships between Chinese automakers and global suppliers are improving system reliability and affordability. By 2035, China is expected to account for one of the largest shares of ACC and BSD-equipped vehicles globally, with exports expanding across Asia.

  • Over 25 million new cars with BSD expected by 2032
  • AI-driven ACC algorithms projected to grow 14% annually
  • Export of ACC modules forecast to rise 9% per year

Future Outlook for ACC and BSD in Germany

Germany is expected to record a CAGR of 7.4%, driven by high adoption rates among premium automakers. Integration of ACC and BSD into advanced driver assistance packages is becoming a competitive differentiator. Demand is supported by European Union safety directives, which require lane monitoring and adaptive braking in new vehicles.

German automakers are focusing on sensor fusion technologies, combining radar, lidar, and camera inputs to enhance performance in varied driving conditions. With one of the highest proportions of premium vehicles in Europe, the country is leading innovation in adaptive highway driving features. By 2035, ACC and BSD adoption is expected to be universal across luxury car segments.

  • Lidar-supported ACC modules forecast to grow at 11% annually
  • BSD integration into luxury cars expected to hit 95% by 2035
  • Exports of German-made driver assistance systems projected to expand 8% yearly

Market Development of ACC and BSD in Japan

Japan is expanding at a CAGR of 7.3%, supported by its established automotive sector and focus on compact vehicle safety. Automakers are embedding ACC and BSD into hybrid and small passenger vehicles to meet rising consumer demand for affordable safety systems. The market is also benefiting from government-backed research programs aimed at autonomous driving technologies, where ACC and BSD play a foundational role.

Integration in commercial fleets, particularly logistics and ride-hailing, is increasing. Local suppliers are developing miniaturized sensors and cost-effective radar modules suitable for smaller vehicles. By 2035, ACC and BSD are projected to be standard in nearly all new vehicles in Japan.

  • Fleet adoption of ACC forecast to rise 13% annually
  • Compact car BSD installation expected to exceed 80% by 2032
  • Domestic R&D investment in ACC projected to grow 9% per year

Growth Outlook for ACC and BSD in the United Kingdom

The United Kingdom market, growing at a CAGR of 7.2%, is supported by regulatory frameworks mandating improved vehicle safety and rising EV adoption. Automakers are integrating ACC and BSD to enhance safety in both city and highway driving. Growth is concentrated in mid-sized passenger vehicles and urban fleets, where accident reduction is a priority.

Partnerships between UK-based engineering firms and European OEMs are driving the development of advanced radar calibration technologies. With increasing consumer preference for semi-autonomous features, adoption is rising in both premium and non-premium vehicle categories. By 2035, ACC and BSD are expected to cover the majority of new cars sold in the UK.
  • Urban fleet BSD integration projected to grow 12% annually
  • Radar calibration services forecast to expand 10% per year
  • ACC adoption in mid-sized cars expected to exceed 70% by 2030

Leading Adaptive Cruise Control & Blind Spot Detection Manufacturers, Suppliers, DistributorsLeading Player : Robert Bosch GmbH - 24% market share

Adaptive Cruise Control And Blind Spot Detection Market By Company

The adaptive cruise control and blind spot detection industry has been shaped by established automotive component suppliers that focus on enhancing vehicle safety systems through continuous product development. Continental AG, Robert Bosch GmbH, and ZF Friedrichshafen AGare among the strongest players, frequently investing in advanced driver assistance systems (ADAS) portfolios.

For example, Bosch has focused on integrating radar and camera-based solutions to create seamless safety packages for both passenger and commercial vehicles. Similarly, Continental has emphasized sensor fusion technologies to deliver higher detection accuracy across diverse road conditions.

Alongside the market leaders, companies such as DENSO Corp, Delphi Technologies, and Autoliv Inc. are working to strengthen their positions by aligning adaptive cruise control with braking and steering systems. WABCO Vehicle Control Services and Bendix Commercial Vehicle Systems, operating under Knorr-Bremse, are tailoring these technologies for heavy-duty trucks and buses.

Magna International has introduced scalable driver assistance platforms, while Mando-Hella Electronics Corp. continues to focus on supplying cost-efficient radar modules to emerging markets. The competition is marked by collaborative ventures, targeted R&D efforts, and new product launches aimed at improving safety, reducing accidents, and supporting global adoption of advanced safety features in vehicles.

Recent Industry News Mitsubishi Motors Europe BV introduced the new-generation ASX to the European market, featuring a central screen connected to smartphones and advanced driver assistance programs such as MI-PILOT, which combines Adaptive Cruise Control and Lane Centering Assist for enhanced safety.

The model is produced at Renault’s Valladolid plant in Spain and offered through Mitsubishi dealerships in select European markets. Nanjing Chuhang Technology began mass production of the Zero Sports Car, equipped with 77GHz radar and optical vision systems, while Nissan Australia unveiled the fourth-generation X-TRAIL with advanced safety features.

Report Scope

Report Attributes Details
Market Size (2025) USD 6.9 billion
Projected Market Size (2035) USD 14.9 billion
CAGR (2025 to 2035) 7.8%
Base Year for Estimation 2024
Historical Period 2020 to 2024
Projection Period 2025 to 2035
Quantitative Units USD billion for value
Type Segments Analyzed Adaptive Cruise Control (ACC), Blind Spot Detection (BSD)
Vehicle Type Segments Analyzed Passenger Cars, Commercial Vehicles
Sales Channel Segments Analyzed OEM, Aftermarket
Technology Segments Analyzed Infrared, Radar, Image, Other Technologies
Regions Covered North America, Latin America, Western Europe, Eastern Europe, Asia Pacific, Middle East and Africa
Countries Covered United States, Canada, Mexico, Brazil, Argentina, Germany, United Kingdom, France, Italy, Spain, Netherlands, Sweden, Poland, China, Japan, India, South Korea, Thailand, Vietnam, Australia, New Zealand, United Arab Emirates, Saudi Arabia, South Africa, Turkey, Egypt
Leading Players Continental AG, Delphi Technologies PLC, DENSO Corp, Autoliv Inc., Magna International, WABCO Vehicle Control Services, Robert Bosch GmbH, ZF Friedrichshafen AG, Bendix Commercial Vehicle Systems LLC (Knorr- Bremse AG), Mando-Hella Electronics Corp.
Additional Attributes Dollar sales by technology and vehicle type, demand dynamics across passenger cars and commercial fleets, regional adoption trends across North America, Europe, and Asia-Pacific, innovation in radar and image-based detection, AI integration for adaptive response, environmental impact of efficient driving systems, and emerging use in autonomous and connected vehicles

Adaptive Cruise Control and Blind Spot Detection Market Analyzed by Key Investment Segments 

By Type

  • Adaptive Cruise Control (ACC) 
  • Blind Spot Detection (BSD)

By Vehicle Type

  • Passenger Cars
  • Commercial Vehicles

By Sales Channel

  • OEM
  • Aftermarket
  • Technology
  • Infrared
  • Radar
  • Image
  • Other Technologies

By Region

  • North America
  • Latin America
  • Western Europe
  • Eastern Europe
  • Asia Pacific
  • The Middle East and Africa

Table of Content

  1. Executive Summary
    • Global Market Outlook
    • Demand-side Trends
    • Supply-side Trends
    • Technology Roadmap Analysis
    • Analysis and Recommendations
  2. Market Overview
    • Market Coverage / Taxonomy
    • Market Definition / Scope / Limitations
  3. Market Background
    • Market Dynamics
      • Drivers
      • Restraints
      • Opportunity
      • Trends
    • Scenario Forecast
      • Demand in Optimistic Scenario
      • Demand in Likely Scenario
      • Demand in Conservative Scenario
    • Opportunity Map Analysis
    • Product Life Cycle Analysis
    • Supply Chain Analysis
      • Supply Side Participants and their Roles
        • Producers
        • Mid-Level Participants (Traders/ Agents/ Brokers)
        • Wholesalers and Distributors
      • Value Added and Value Created at Node in the Supply Chain
      • List of Raw Material Suppliers
      • List of Existing and Potential Buyer’s
    • Investment Feasibility Matrix
    • Value Chain Analysis
      • Profit Margin Analysis
      • Wholesalers and Distributors
      • Retailers
    • PESTLE and Porter’s Analysis
    • Regulatory Landscape
      • By Key Regions
      • By Key Countries
    • Regional Parent Market Outlook
    • Production and Consumption Statistics
    • Import and Export Statistics
  4. Global Market Analysis 2020 to 2024 and Forecast, 2025 to 2035
    • Historical Market Size Value (USD Billion) & Volume (Thousand Units) Analysis, 2020 to 2024
    • Current and Future Market Size Value (USD Billion) & Volume (Thousand Units) Projections, 2025 to 2035
      • Y-o-Y Growth Trend Analysis
      • Absolute $ Opportunity Analysis
  5. Global Market Pricing Analysis 2020 to 2024 and Forecast 2025 to 2035
  6. Global Market Analysis 2020 to 2024 and Forecast 2025 to 2035, By Type
    • Introduction / Key Findings
    • Historical Market Size Value (USD Billion) & Volume (Thousand Units) Analysis By Type, 2020 to 2024
    • Current and Future Market Size Value (USD Billion) & Volume (Thousand Units) Analysis and Forecast By Type, 2025 to 2035
      • Adaptive Cruise Control (ACC)
      • Blind Spot Detection (BSD)
    • Y-o-Y Growth Trend Analysis By Type, 2020 to 2024
    • Absolute $ Opportunity Analysis By Type, 2025 to 2035
  7. Global Market Analysis 2020 to 2024 and Forecast 2025 to 2035, By Vehicle Type
    • Introduction / Key Findings
    • Historical Market Size Value (USD Billion) & Volume (Thousand Units) Analysis By Vehicle Type, 2020 to 2024
    • Current and Future Market Size Value (USD Billion) & Volume (Thousand Units) Analysis and Forecast By Vehicle Type, 2025 to 2035
      • Passenger Cars
      • Commercial Vehicles
    • Y-o-Y Growth Trend Analysis By Vehicle Type, 2020 to 2024
    • Absolute $ Opportunity Analysis By Vehicle Type, 2025 to 2035
  8. Global Market Analysis 2020 to 2024 and Forecast 2025 to 2035, By Sales Channel
    • Introduction / Key Findings
    • Historical Market Size Value (USD Billion) & Volume (Thousand Units) Analysis By Sales Channel, 2020 to 2024
    • Current and Future Market Size Value (USD Billion) & Volume (Thousand Units) Analysis and Forecast By Sales Channel, 2025 to 2035
      • OEM
      • Aftermarket
    • Y-o-Y Growth Trend Analysis By Sales Channel, 2020 to 2024
    • Absolute $ Opportunity Analysis By Sales Channel, 2025 to 2035
  9. Global Market Analysis 2020 to 2024 and Forecast 2025 to 2035, By Technology
    • Introduction / Key Findings
    • Historical Market Size Value (USD Billion) & Volume (Thousand Units) Analysis By Technology, 2020 to 2024
    • Current and Future Market Size Value (USD Billion) & Volume (Thousand Units) Analysis and Forecast By Technology, 2025 to 2035
      • Radar
      • Infrared
      • Image
      • Other Technologies
    • Y-o-Y Growth Trend Analysis By Technology, 2020 to 2024
    • Absolute $ Opportunity Analysis By Technology, 2025 to 2035
  10. Global Market Analysis 2020 to 2024 and Forecast 2025 to 2035, By Region
    • Introduction
    • Historical Market Size Value (USD Billion) & Volume (Thousand Units) Analysis By Region, 2020 to 2024
    • Current Market Size Value (USD Billion) & Volume (Thousand Units) Analysis and Forecast By Region, 2025 to 2035
      • North America
      • Latin America
      • Western Europe
      • Eastern Europe
      • East Asia
      • South Asia & Pacific
      • Middle East and Africa
    • Market Attractiveness Analysis By Region
  11. North America Market Analysis 2020 to 2024 and Forecast 2025 to 2035, By Country
    • Historical Market Size Value (USD Billion) & Volume (Thousand Units) Trend Analysis By Market Taxonomy, 2020 to 2024
    • Market Size Value (USD Billion) & Volume (Thousand Units) Forecast By Market Taxonomy, 2025 to 2035
      • By Country
        • USA
        • Canada
        • Mexico
      • By Type
      • By Vehicle Type
      • By Sales Channel
      • By Technology
    • Market Attractiveness Analysis
      • By Country
      • By Type
      • By Vehicle Type
      • By Sales Channel
      • By Technology
    • Key Takeaways
  12. Latin America Market Analysis 2020 to 2024 and Forecast 2025 to 2035, By Country
    • Historical Market Size Value (USD Billion) & Volume (Thousand Units) Trend Analysis By Market Taxonomy, 2020 to 2024
    • Market Size Value (USD Billion) & Volume (Thousand Units) Forecast By Market Taxonomy, 2025 to 2035
      • By Country
        • Brazil
        • Argentina
        • Rest of LATAM
      • By Type
      • By Vehicle Type
      • By Sales Channel
      • By Technology
    • Market Attractiveness Analysis
      • By Country
      • By Type
      • By Vehicle Type
      • By Sales Channel
      • By Technology
    • Key Takeaways
  13. Western Europe Market Analysis 2020 to 2024 and Forecast 2025 to 2035, By Country
    • Historical Market Size Value (USD Billion) & Volume (Thousand Units) Trend Analysis By Market Taxonomy, 2020 to 2024
    • Market Size Value (USD Billion) & Volume (Thousand Units) Forecast By Market Taxonomy, 2025 to 2035
      • By Country
        • Germany
        • Italy
        • France
        • UK
        • Spain
        • BENELUX
        • Nordic
        • Rest of W.Europe
      • By Type
      • By Vehicle Type
      • By Sales Channel
      • By Technology
    • Market Attractiveness Analysis
      • By Country
      • By Type
      • By Vehicle Type
      • By Sales Channel
      • By Technology
    • Key Takeaways
  14. Eastern Europe Market Analysis 2020 to 2024 and Forecast 2025 to 2035, By Country
    • Historical Market Size Value (USD Billion) & Volume (Thousand Units) Trend Analysis By Market Taxonomy, 2020 to 2024
    • Market Size Value (USD Billion) & Volume (Thousand Units) Forecast By Market Taxonomy, 2025 to 2035
      • By Country
        • Russia
        • Hungary
        • Poland
        • Balkan & Baltics
        • Rest of E. Europe
      • By Type
      • By Vehicle Type
      • By Sales Channel
      • By Technology
    • Market Attractiveness Analysis
      • By Country
      • By Type
      • By Vehicle Type
      • By Sales Channel
      • By Technology
    • Key Takeaways
  15. East Asia Market Analysis 2020 to 2024 and Forecast 2025 to 2035, By Country
    • Historical Market Size Value (USD Billion) & Volume (Thousand Units) Trend Analysis By Market Taxonomy, 2020 to 2024
    • Market Size Value (USD Billion) & Volume (Thousand Units) Forecast By Market Taxonomy, 2025 to 2035
      • By Country
        • China
        • Japan
        • South Korea
      • By Type
      • By Vehicle Type
      • By Sales Channel
      • By Technology
    • Market Attractiveness Analysis
      • By Country
      • By Type
      • By Vehicle Type
      • By Sales Channel
      • By Technology
    • Key Takeaways
  16. South Asia & Pacific Market Analysis 2020 to 2024 and Forecast 2025 to 2035, By Country
    • Historical Market Size Value (USD Billion) & Volume (Thousand Units) Trend Analysis By Market Taxonomy, 2020 to 2024
    • Market Size Value (USD Billion) & Volume (Thousand Units) Forecast By Market Taxonomy, 2025 to 2035
      • By Country
        • India
        • Australia & New Zealand
        • ASEAN
        • Rest of SAP
      • By Type
      • By Vehicle Type
      • By Sales Channel
      • By Technology
    • Market Attractiveness Analysis
      • By Country
      • By Type
      • By Vehicle Type
      • By Sales Channel
      • By Technology
    • Key Takeaways
  17. Middle East and Africa Market Analysis 2020 to 2024 and Forecast 2025 to 2035, By Country
    • Historical Market Size Value (USD Billion) & Volume (Thousand Units) Trend Analysis By Market Taxonomy, 2020 to 2024
    • Market Size Value (USD Billion) & Volume (Thousand Units) Forecast By Market Taxonomy, 2025 to 2035
      • By Country
        • GCC Countries
        • Northern Africa
        • South Africa
        • Turkiye
        • Rest of MEA
      • By Type
      • By Vehicle Type
      • By Sales Channel
      • By Technology
    • Market Attractiveness Analysis
      • By Country
      • By Type
      • By Vehicle Type
      • By Sales Channel
      • By Technology
    • Key Takeaways
  18. Key Countries Market Analysis
    • USA
      • Pricing Analysis
      • Market Share Analysis, 2024
        • By Type
        • By Vehicle Type
        • By Sales Channel
        • By Technology
    • Canada
      • Pricing Analysis
      • Market Share Analysis, 2024
        • By Type
        • By Vehicle Type
        • By Sales Channel
        • By Technology
    • Brazil
      • Pricing Analysis
      • Market Share Analysis, 2024
        • By Type
        • By Vehicle Type
        • By Sales Channel
        • By Technology
    • Mexico
      • Pricing Analysis
      • Market Share Analysis, 2024
        • By Type
        • By Vehicle Type
        • By Sales Channel
        • By Technology
    • Argentina
      • Pricing Analysis
      • Market Share Analysis, 2024
        • By Type
        • By Vehicle Type
        • By Sales Channel
        • By Technology
  19. Market Structure Analysis
    • Competition Dashboard
    • Competition Benchmarking
    • Market Share Analysis of Top Players
      • By Regional
      • By Type
      • By Vehicle Type
      • By Sales Channel
      • By Technology
  20. Competition Analysis
    • Competition Deep Dive
      • Robert Bosch GmbH
        • Overview
        • Product Portfolio
        • Profitability by Market Segments (Product/Age /Sales Channel/Region)
        • Sales Footprint
        • Strategy Overview
          • Marketing Strategy
          • Product Strategy
          • Channel Strategy
      • Continental AG
        • Overview
        • Product Portfolio
        • Profitability by Market Segments (Product/Age /Sales Channel/Region)
        • Sales Footprint
        • Strategy Overview
          • Marketing Strategy
          • Product Strategy
          • Channel Strategy
      • ZF Friedrichshafen AG
        • Overview
        • Product Portfolio
        • Profitability by Market Segments (Product/Age /Sales Channel/Region)
        • Sales Footprint
        • Strategy Overview
          • Marketing Strategy
          • Product Strategy
          • Channel Strategy
      • Delphi Technologies PLC
        • Overview
        • Product Portfolio
        • Profitability by Market Segments (Product/Age /Sales Channel/Region)
        • Sales Footprint
        • Strategy Overview
          • Marketing Strategy
          • Product Strategy
          • Channel Strategy
      • DENSO Corp
        • Overview
        • Product Portfolio
        • Profitability by Market Segments (Product/Age /Sales Channel/Region)
        • Sales Footprint
        • Strategy Overview
          • Marketing Strategy
          • Product Strategy
          • Channel Strategy
      • Autoliv Inc.
        • Overview
        • Product Portfolio
        • Profitability by Market Segments (Product/Age /Sales Channel/Region)
        • Sales Footprint
        • Strategy Overview
          • Marketing Strategy
          • Product Strategy
          • Channel Strategy
      • Magna International
        • Overview
        • Product Portfolio
        • Profitability by Market Segments (Product/Age /Sales Channel/Region)
        • Sales Footprint
        • Strategy Overview
          • Marketing Strategy
          • Product Strategy
          • Channel Strategy
      • WABCO Vehicle Control Services
        • Overview
        • Product Portfolio
        • Profitability by Market Segments (Product/Age /Sales Channel/Region)
        • Sales Footprint
        • Strategy Overview
          • Marketing Strategy
          • Product Strategy
          • Channel Strategy
      • Bendix Commercial Vehicle Systems LLC (Knorr-Bremse AG)
        • Overview
        • Product Portfolio
        • Profitability by Market Segments (Product/Age /Sales Channel/Region)
        • Sales Footprint
        • Strategy Overview
          • Marketing Strategy
          • Product Strategy
          • Channel Strategy
      • Mando-Hella Electronics Corp.
        • Overview
        • Product Portfolio
        • Profitability by Market Segments (Product/Age /Sales Channel/Region)
        • Sales Footprint
        • Strategy Overview
          • Marketing Strategy
          • Product Strategy
          • Channel Strategy
  21. Assumptions & Acronyms Used
  22. Research Methodology

List of Tables

  • Table 1: Global Market Value (USD Billion) Forecast by Region, 2020-2035
  • Table 2: Global Market Volume (Thousand Units) Forecast by Region, 2020-2035
  • Table 3: Global Market Value (USD Billion) Forecast by Type, 2020-2035
  • Table 4: Global Market Volume (Thousand Units) Forecast by Type, 2020-2035
  • Table 5: Global Market Value (USD Billion) Forecast by Vehicle Type, 2020-2035
  • Table 6: Global Market Volume (Thousand Units) Forecast by Vehicle Type, 2020-2035
  • Table 7: Global Market Value (USD Billion) Forecast by Sales Channel, 2020-2035
  • Table 8: Global Market Volume (Thousand Units) Forecast by Sales Channel, 2020-2035
  • Table 9: Global Market Value (USD Billion) Forecast by Technology, 2020-2035
  • Table 10: Global Market Volume (Thousand Units) Forecast by Technology, 2020-2035
  • Table 11: North America Market Value (USD Billion) Forecast by Country, 2020-2035
  • Table 12: North America Market Volume (Thousand Units) Forecast by Country, 2020-2035
  • Table 13: North America Market Value (USD Billion) Forecast by Type, 2020-2035
  • Table 14: North America Market Volume (Thousand Units) Forecast by Type, 2020-2035
  • Table 15: North America Market Value (USD Billion) Forecast by Vehicle Type, 2020-2035
  • Table 16: North America Market Volume (Thousand Units) Forecast by Vehicle Type, 2020-2035
  • Table 17: North America Market Value (USD Billion) Forecast by Sales Channel, 2020-2035
  • Table 18: North America Market Volume (Thousand Units) Forecast by Sales Channel, 2020-2035
  • Table 19: North America Market Value (USD Billion) Forecast by Technology, 2020-2035
  • Table 20: North America Market Volume (Thousand Units) Forecast by Technology, 2020-2035
  • Table 21: Latin America Market Value (USD Billion) Forecast by Country, 2020-2035
  • Table 22: Latin America Market Volume (Thousand Units) Forecast by Country, 2020-2035
  • Table 23: Latin America Market Value (USD Billion) Forecast by Type, 2020-2035
  • Table 24: Latin America Market Volume (Thousand Units) Forecast by Type, 2020-2035
  • Table 25: Latin America Market Value (USD Billion) Forecast by Vehicle Type, 2020-2035
  • Table 26: Latin America Market Volume (Thousand Units) Forecast by Vehicle Type, 2020-2035
  • Table 27: Latin America Market Value (USD Billion) Forecast by Sales Channel, 2020-2035
  • Table 28: Latin America Market Volume (Thousand Units) Forecast by Sales Channel, 2020-2035
  • Table 29: Latin America Market Value (USD Billion) Forecast by Technology, 2020-2035
  • Table 30: Latin America Market Volume (Thousand Units) Forecast by Technology, 2020-2035
  • Table 31: Western Europe Market Value (USD Billion) Forecast by Country, 2020-2035
  • Table 32: Western Europe Market Volume (Thousand Units) Forecast by Country, 2020-2035
  • Table 33: Western Europe Market Value (USD Billion) Forecast by Type, 2020-2035
  • Table 34: Western Europe Market Volume (Thousand Units) Forecast by Type, 2020-2035
  • Table 35: Western Europe Market Value (USD Billion) Forecast by Vehicle Type, 2020-2035
  • Table 36: Western Europe Market Volume (Thousand Units) Forecast by Vehicle Type, 2020-2035
  • Table 37: Western Europe Market Value (USD Billion) Forecast by Sales Channel, 2020-2035
  • Table 38: Western Europe Market Volume (Thousand Units) Forecast by Sales Channel, 2020-2035
  • Table 39: Western Europe Market Value (USD Billion) Forecast by Technology, 2020-2035
  • Table 40: Western Europe Market Volume (Thousand Units) Forecast by Technology, 2020-2035
  • Table 41: Eastern Europe Market Value (USD Billion) Forecast by Country, 2020-2035
  • Table 42: Eastern Europe Market Volume (Thousand Units) Forecast by Country, 2020-2035
  • Table 43: Eastern Europe Market Value (USD Billion) Forecast by Type, 2020-2035
  • Table 44: Eastern Europe Market Volume (Thousand Units) Forecast by Type, 2020-2035
  • Table 45: Eastern Europe Market Value (USD Billion) Forecast by Vehicle Type, 2020-2035
  • Table 46: Eastern Europe Market Volume (Thousand Units) Forecast by Vehicle Type, 2020-2035
  • Table 47: Eastern Europe Market Value (USD Billion) Forecast by Sales Channel, 2020-2035
  • Table 48: Eastern Europe Market Volume (Thousand Units) Forecast by Sales Channel, 2020-2035
  • Table 49: Eastern Europe Market Value (USD Billion) Forecast by Technology, 2020-2035
  • Table 50: Eastern Europe Market Volume (Thousand Units) Forecast by Technology, 2020-2035
  • Table 51: East Asia Market Value (USD Billion) Forecast by Country, 2020-2035
  • Table 52: East Asia Market Volume (Thousand Units) Forecast by Country, 2020-2035
  • Table 53: East Asia Market Value (USD Billion) Forecast by Type, 2020-2035
  • Table 54: East Asia Market Volume (Thousand Units) Forecast by Type, 2020-2035
  • Table 55: East Asia Market Value (USD Billion) Forecast by Vehicle Type, 2020-2035
  • Table 56: East Asia Market Volume (Thousand Units) Forecast by Vehicle Type, 2020-2035
  • Table 57: East Asia Market Value (USD Billion) Forecast by Sales Channel, 2020-2035
  • Table 58: East Asia Market Volume (Thousand Units) Forecast by Sales Channel, 2020-2035
  • Table 59: East Asia Market Value (USD Billion) Forecast by Technology, 2020-2035
  • Table 60: East Asia Market Volume (Thousand Units) Forecast by Technology, 2020-2035
  • Table 61: South Asia & Pacific Market Value (USD Billion) Forecast by Country, 2020-2035
  • Table 62: South Asia & Pacific Market Volume (Thousand Units) Forecast by Country, 2020-2035
  • Table 63: South Asia & Pacific Market Value (USD Billion) Forecast by Type, 2020-2035
  • Table 64: South Asia & Pacific Market Volume (Thousand Units) Forecast by Type, 2020-2035
  • Table 65: South Asia & Pacific Market Value (USD Billion) Forecast by Vehicle Type, 2020-2035
  • Table 66: South Asia & Pacific Market Volume (Thousand Units) Forecast by Vehicle Type, 2020-2035
  • Table 67: South Asia & Pacific Market Value (USD Billion) Forecast by Sales Channel, 2020-2035
  • Table 68: South Asia & Pacific Market Volume (Thousand Units) Forecast by Sales Channel, 2020-2035
  • Table 69: South Asia & Pacific Market Value (USD Billion) Forecast by Technology, 2020-2035
  • Table 70: South Asia & Pacific Market Volume (Thousand Units) Forecast by Technology, 2020-2035
  • Table 71: Middle East and Africa Market Value (USD Billion) Forecast by Country, 2020-2035
  • Table 72: Middle East and Africa Market Volume (Thousand Units) Forecast by Country, 2020-2035
  • Table 73: Middle East and Africa Market Value (USD Billion) Forecast by Type, 2020-2035
  • Table 74: Middle East and Africa Market Volume (Thousand Units) Forecast by Type, 2020-2035
  • Table 75: Middle East and Africa Market Value (USD Billion) Forecast by Vehicle Type, 2020-2035
  • Table 76: Middle East and Africa Market Volume (Thousand Units) Forecast by Vehicle Type, 2020-2035
  • Table 77: Middle East and Africa Market Value (USD Billion) Forecast by Sales Channel, 2020-2035
  • Table 78: Middle East and Africa Market Volume (Thousand Units) Forecast by Sales Channel, 2020-2035
  • Table 79: Middle East and Africa Market Value (USD Billion) Forecast by Technology, 2020-2035
  • Table 80: Middle East and Africa Market Volume (Thousand Units) Forecast by Technology, 2020-2035

List of Figures

  • Figure 1: Global Market Volume (Thousand Units) Forecast 2020-2035
  • Figure 2: Global Market Pricing Analysis
  • Figure 3: Global Market Value (USD Billion) Forecast 2020-2035
  • Figure 4: Global Market Value Share and BPS Analysis by Type, 2025 and 2035
  • Figure 5: Global Market Y-o-Y Growth Comparison by Type, 2025-2035
  • Figure 6: Global Market Attractiveness Analysis by Type
  • Figure 7: Global Market Value Share and BPS Analysis by Vehicle Type, 2025 and 2035
  • Figure 8: Global Market Y-o-Y Growth Comparison by Vehicle Type, 2025-2035
  • Figure 9: Global Market Attractiveness Analysis by Vehicle Type
  • Figure 10: Global Market Value Share and BPS Analysis by Sales Channel, 2025 and 2035
  • Figure 11: Global Market Y-o-Y Growth Comparison by Sales Channel, 2025-2035
  • Figure 12: Global Market Attractiveness Analysis by Sales Channel
  • Figure 13: Global Market Value Share and BPS Analysis by Technology, 2025 and 2035
  • Figure 14: Global Market Y-o-Y Growth Comparison by Technology, 2025-2035
  • Figure 15: Global Market Attractiveness Analysis by Technology
  • Figure 16: Global Market Value (USD Billion) Share and BPS Analysis by Region, 2025 and 2035
  • Figure 17: Global Market Y-o-Y Growth Comparison by Region, 2025-2035
  • Figure 18: Global Market Attractiveness Analysis by Region
  • Figure 19: North America Market Incremental $ Opportunity, 2025-2035
  • Figure 20: Latin America Market Incremental $ Opportunity, 2025-2035
  • Figure 21: Western Europe Market Incremental $ Opportunity, 2025-2035
  • Figure 22: Eastern Europe Market Incremental $ Opportunity, 2025-2035
  • Figure 23: East Asia Market Incremental $ Opportunity, 2025-2035
  • Figure 24: South Asia & Pacific Market Incremental $ Opportunity, 2025-2035
  • Figure 25: Middle East and Africa Market Incremental $ Opportunity, 2025-2035
  • Figure 26: North America Market Value Share and BPS Analysis by Country, 2025 and 2035
  • Figure 27: North America Market Value Share and BPS Analysis by Type, 2025 and 2035
  • Figure 28: North America Market Y-o-Y Growth Comparison by Type, 2025-2035
  • Figure 29: North America Market Attractiveness Analysis by Type
  • Figure 30: North America Market Value Share and BPS Analysis by Vehicle Type, 2025 and 2035
  • Figure 31: North America Market Y-o-Y Growth Comparison by Vehicle Type, 2025-2035
  • Figure 32: North America Market Attractiveness Analysis by Vehicle Type
  • Figure 33: North America Market Value Share and BPS Analysis by Sales Channel, 2025 and 2035
  • Figure 34: North America Market Y-o-Y Growth Comparison by Sales Channel, 2025-2035
  • Figure 35: North America Market Attractiveness Analysis by Sales Channel
  • Figure 36: North America Market Value Share and BPS Analysis by Technology, 2025 and 2035
  • Figure 37: North America Market Y-o-Y Growth Comparison by Technology, 2025-2035
  • Figure 38: North America Market Attractiveness Analysis by Technology
  • Figure 39: Latin America Market Value Share and BPS Analysis by Country, 2025 and 2035
  • Figure 40: Latin America Market Value Share and BPS Analysis by Type, 2025 and 2035
  • Figure 41: Latin America Market Y-o-Y Growth Comparison by Type, 2025-2035
  • Figure 42: Latin America Market Attractiveness Analysis by Type
  • Figure 43: Latin America Market Value Share and BPS Analysis by Vehicle Type, 2025 and 2035
  • Figure 44: Latin America Market Y-o-Y Growth Comparison by Vehicle Type, 2025-2035
  • Figure 45: Latin America Market Attractiveness Analysis by Vehicle Type
  • Figure 46: Latin America Market Value Share and BPS Analysis by Sales Channel, 2025 and 2035
  • Figure 47: Latin America Market Y-o-Y Growth Comparison by Sales Channel, 2025-2035
  • Figure 48: Latin America Market Attractiveness Analysis by Sales Channel
  • Figure 49: Latin America Market Value Share and BPS Analysis by Technology, 2025 and 2035
  • Figure 50: Latin America Market Y-o-Y Growth Comparison by Technology, 2025-2035
  • Figure 51: Latin America Market Attractiveness Analysis by Technology
  • Figure 52: Western Europe Market Value Share and BPS Analysis by Country, 2025 and 2035
  • Figure 53: Western Europe Market Value Share and BPS Analysis by Type, 2025 and 2035
  • Figure 54: Western Europe Market Y-o-Y Growth Comparison by Type, 2025-2035
  • Figure 55: Western Europe Market Attractiveness Analysis by Type
  • Figure 56: Western Europe Market Value Share and BPS Analysis by Vehicle Type, 2025 and 2035
  • Figure 57: Western Europe Market Y-o-Y Growth Comparison by Vehicle Type, 2025-2035
  • Figure 58: Western Europe Market Attractiveness Analysis by Vehicle Type
  • Figure 59: Western Europe Market Value Share and BPS Analysis by Sales Channel, 2025 and 2035
  • Figure 60: Western Europe Market Y-o-Y Growth Comparison by Sales Channel, 2025-2035
  • Figure 61: Western Europe Market Attractiveness Analysis by Sales Channel
  • Figure 62: Western Europe Market Value Share and BPS Analysis by Technology, 2025 and 2035
  • Figure 63: Western Europe Market Y-o-Y Growth Comparison by Technology, 2025-2035
  • Figure 64: Western Europe Market Attractiveness Analysis by Technology
  • Figure 65: Eastern Europe Market Value Share and BPS Analysis by Country, 2025 and 2035
  • Figure 66: Eastern Europe Market Value Share and BPS Analysis by Type, 2025 and 2035
  • Figure 67: Eastern Europe Market Y-o-Y Growth Comparison by Type, 2025-2035
  • Figure 68: Eastern Europe Market Attractiveness Analysis by Type
  • Figure 69: Eastern Europe Market Value Share and BPS Analysis by Vehicle Type, 2025 and 2035
  • Figure 70: Eastern Europe Market Y-o-Y Growth Comparison by Vehicle Type, 2025-2035
  • Figure 71: Eastern Europe Market Attractiveness Analysis by Vehicle Type
  • Figure 72: Eastern Europe Market Value Share and BPS Analysis by Sales Channel, 2025 and 2035
  • Figure 73: Eastern Europe Market Y-o-Y Growth Comparison by Sales Channel, 2025-2035
  • Figure 74: Eastern Europe Market Attractiveness Analysis by Sales Channel
  • Figure 75: Eastern Europe Market Value Share and BPS Analysis by Technology, 2025 and 2035
  • Figure 76: Eastern Europe Market Y-o-Y Growth Comparison by Technology, 2025-2035
  • Figure 77: Eastern Europe Market Attractiveness Analysis by Technology
  • Figure 78: East Asia Market Value Share and BPS Analysis by Country, 2025 and 2035
  • Figure 79: East Asia Market Value Share and BPS Analysis by Type, 2025 and 2035
  • Figure 80: East Asia Market Y-o-Y Growth Comparison by Type, 2025-2035
  • Figure 81: East Asia Market Attractiveness Analysis by Type
  • Figure 82: East Asia Market Value Share and BPS Analysis by Vehicle Type, 2025 and 2035
  • Figure 83: East Asia Market Y-o-Y Growth Comparison by Vehicle Type, 2025-2035
  • Figure 84: East Asia Market Attractiveness Analysis by Vehicle Type
  • Figure 85: East Asia Market Value Share and BPS Analysis by Sales Channel, 2025 and 2035
  • Figure 86: East Asia Market Y-o-Y Growth Comparison by Sales Channel, 2025-2035
  • Figure 87: East Asia Market Attractiveness Analysis by Sales Channel
  • Figure 88: East Asia Market Value Share and BPS Analysis by Technology, 2025 and 2035
  • Figure 89: East Asia Market Y-o-Y Growth Comparison by Technology, 2025-2035
  • Figure 90: East Asia Market Attractiveness Analysis by Technology
  • Figure 91: South Asia & Pacific Market Value Share and BPS Analysis by Country, 2025 and 2035
  • Figure 92: South Asia & Pacific Market Value Share and BPS Analysis by Type, 2025 and 2035
  • Figure 93: South Asia & Pacific Market Y-o-Y Growth Comparison by Type, 2025-2035
  • Figure 94: South Asia & Pacific Market Attractiveness Analysis by Type
  • Figure 95: South Asia & Pacific Market Value Share and BPS Analysis by Vehicle Type, 2025 and 2035
  • Figure 96: South Asia & Pacific Market Y-o-Y Growth Comparison by Vehicle Type, 2025-2035
  • Figure 97: South Asia & Pacific Market Attractiveness Analysis by Vehicle Type
  • Figure 98: South Asia & Pacific Market Value Share and BPS Analysis by Sales Channel, 2025 and 2035
  • Figure 99: South Asia & Pacific Market Y-o-Y Growth Comparison by Sales Channel, 2025-2035
  • Figure 100: South Asia & Pacific Market Attractiveness Analysis by Sales Channel
  • Figure 101: South Asia & Pacific Market Value Share and BPS Analysis by Technology, 2025 and 2035
  • Figure 102: South Asia & Pacific Market Y-o-Y Growth Comparison by Technology, 2025-2035
  • Figure 103: South Asia & Pacific Market Attractiveness Analysis by Technology
  • Figure 104: Middle East and Africa Market Value Share and BPS Analysis by Country, 2025 and 2035
  • Figure 105: Middle East and Africa Market Value Share and BPS Analysis by Type, 2025 and 2035
  • Figure 106: Middle East and Africa Market Y-o-Y Growth Comparison by Type, 2025-2035
  • Figure 107: Middle East and Africa Market Attractiveness Analysis by Type
  • Figure 108: Middle East and Africa Market Value Share and BPS Analysis by Vehicle Type, 2025 and 2035
  • Figure 109: Middle East and Africa Market Y-o-Y Growth Comparison by Vehicle Type, 2025-2035
  • Figure 110: Middle East and Africa Market Attractiveness Analysis by Vehicle Type
  • Figure 111: Middle East and Africa Market Value Share and BPS Analysis by Sales Channel, 2025 and 2035
  • Figure 112: Middle East and Africa Market Y-o-Y Growth Comparison by Sales Channel, 2025-2035
  • Figure 113: Middle East and Africa Market Attractiveness Analysis by Sales Channel
  • Figure 114: Middle East and Africa Market Value Share and BPS Analysis by Technology, 2025 and 2035
  • Figure 115: Middle East and Africa Market Y-o-Y Growth Comparison by Technology, 2025-2035
  • Figure 116: Middle East and Africa Market Attractiveness Analysis by Technology
  • Figure 117: Global Market - Tier Structure Analysis
  • Figure 118: Global Market - Company Share Analysis

Frequently Asked Questions

What is the projected size of the adaptive cruise control and blind spot detection market by 2035?

The market is projected to reach USD 14.9 billion by 2035.

What CAGR is expected for the adaptive cruise control and blind spot detection market between 2025 and 2035?

The market is forecasted to grow at a CAGR of 7.8% during 2025 to 2035.

Which type segment leads the market in 2025?

Adaptive cruise control accounts for 55% share in 2025.

Which vehicle type contributes the highest share in 2025?

Passenger cars represent 70% of the market in 2025.

Who is the leading player in the adaptive cruise control and blind spot detection market and what is its share?

Robert Bosch GmbH is the leading player with a 24% share in 2025.

Explore Similar Insights

Future Market Insights

Adaptive Cruise Control and Blind Spot Detection Market

Chat With

MaRIA

Hi There, I am MaRIA, Your Market Research Intelligence Assistant. How may I help you?