Air Freight Forwarding System Market Size, Share, and Forecast Outlook 2025 to 2035

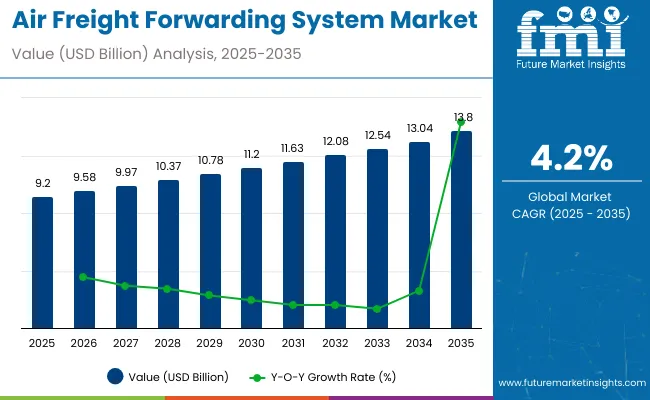
The air freight forwarding system market is valued at USD 9.2 billion in 2025 and is expected to touch USD 13.8 billion by 2035, growing at a CAGR of 4.2%.
Quick stats of Air Freight Forwarding System Market

  • Air Freight Forwarding System Market Size (2025): USD 9.2 billion
  • Projected Air Freight Forwarding System Market Size (2035): USD 13.8 billion
  • Forecast CAGR of Air Freight Forwarding System Market (2025 to 2035): 4.2%
  • Leading Segment of Air Freight Forwarding System Market (2025): Transportation Management System (TMS)
  • Key Growth Regions of Air Freight Forwarding System Market: North America, Europe, Asia Pacific
  • Top Key Players of the Market: DHL Global Forwarding, Nippon Express, C.H. Robinson Worldwide

Air Freight Forwarding System Market

Metric Value
Industry Size (2025E) USD 9.2 billion
Industry Value (2035F) USD 13.8 billion
CAGR (2025 to 2035) 4.2%

Saturation point analysis indicates that market growth will gradually decelerate as key regions reach higher levels of system adoption and process efficiency. In mature markets such as North America and Europe, air freight forwarding processes are already well established, with advanced logistics platforms, integrated IT systems, and optimized operational workflows. In these regions, further growth will primarily come from upgrades, digitalization, and incremental efficiency improvements rather than large-scale expansion.

Emerging regions, particularly Asia Pacific and the Middle East, continue to offer growth opportunities as expanding trade volumes and increased integration with global supply chains drive adoption of advanced forwarding systems. Short-term fluctuations in demand are influenced by global trade cycles, fuel costs, and regulatory changes, which can temporarily affect system utilization. Technological advancements, including AI-enabled route optimization, real-time shipment tracking, and automated documentation, allow companies to push capacity limits and sustain growth even in approaching saturation scenarios. Understanding saturation points helps service providers identify when markets are nearing maturity and focus on system enhancements, process automation, and value-added services, ensuring long-term market expansion and competitiveness across diverse regions.

The air freight forwarding system market is influenced by several interconnected sectors. Logistics and freight forwarding companies account for around 38%, managing shipment planning, customs clearance, and transportation coordination. Airline operators and cargo carriers contribute roughly 30%, providing fleet capacity, cargo handling, and route networks. Airport infrastructure and ground support services represent approximately 17%, covering warehousing, loading, and cargo management systems. Software and digital platform providers make up close to 10%, enabling automated booking, tracking, and shipment optimization. E-commerce and retail shippers comprise the remaining 5%, driving demand for express air freight and time-sensitive logistics solutions.

The market is advancing with the adoption of AI, automation, and digital freight platforms. Global air freight forwarding volumes reached over 60 million tons in 2024, marking a 5-6% increase compared to the previous year. AI-driven route optimization and predictive analytics are reducing delivery delays by 10-12%, improving overall efficiency. Cloud-based platforms for booking and tracking are increasingly deployed, supporting a 15% year-on-year growth in digital adoption. E-commerce shipments now represent nearly 28% of total air forwarding transactions, driving demand for faster processing and real-time monitoring. Strategic partnerships between forwarders, carriers, and technology providers are enhancing network scalability and operational resilience.

Top Air Freight Forwarding System Market Dynamics

Growth is driven by increasing cross-border trade, rising e-commerce shipments, and demand for streamlined logistics operations. Asia Pacific accounts for roughly 38% of market share, followed by North America at 27% and Europe at 22%. Digital freight forwarding platforms, automated documentation, and real-time shipment tracking are becoming standard across freight operators. Integration with warehouse management and supply chain visibility systems enhances efficiency. Emerging regions in Latin America and Africa are adopting air freight forwarding solutions to improve connectivity, reduce delays, and support growing trade volumes.

Driving Force Digitalization and Efficiency

Air freight forwarding systems are gaining traction as shippers and logistics providers increasingly adopt digital platforms for automation and operational efficiency. Automated documentation, AI-powered route optimization, and cloud-based platforms reduce manual errors and streamline customs clearance. Real-time shipment tracking improves transparency, enhances customer experience, and enables predictive analytics for better capacity planning. Airlines and freight forwarders are integrating digital solutions with ERP and warehouse management systems to optimize supply chains. In my opinion, digital air freight forwarding is becoming indispensable for global logistics, enabling faster, more reliable shipments while minimizing operational complexity and costs.

  • AI-powered route optimization improves operational efficiency and delivery timelines
  • Automated documentation reduces manual errors and accelerates customs clearance
  • Integration with ERP and warehouse systems enhances supply chain visibility

Growth Opportunity E-Commerce and Specialized Cargo

The rise of e-commerce and high-value shipments is creating strong growth opportunities for air freight forwarding systems. Platforms are being tailored for express delivery, perishable goods, and pharmaceuticals that require time-sensitive handling. Dedicated digital solutions for cold chain and high-value logistics are increasing adoption across Asia Pacific, Europe, and North America. Small and medium enterprises are also leveraging digital forwarding solutions to compete in global trade. In my view, carriers and forwarders investing in specialized software and technology-enabled operations will capture larger market share, particularly in fast-growing sectors like e-commerce, life sciences, and electronics.

  • Platforms designed for perishable goods and pharmaceuticals enhance reliability
  • Express delivery demand drives adoption of time-sensitive forwarding systems
  • SMEs leverage digital solutions to access global logistics networks

Emerging Trend Integration of AI and IoT

AI and IoT integration is transforming air freight forwarding by enabling predictive analytics, real-time monitoring, and dynamic route planning. AI algorithms forecast demand, optimize load capacity, and enhance shipment prioritization. IoT devices track cargo conditions, monitor temperature-sensitive shipments, and provide visibility across the supply chain. Cloud-based platforms allow seamless communication between shippers, carriers, and forwarders, improving operational efficiency and reducing delays. In my view, adoption of AI and IoT in air freight forwarding is critical for competitiveness, offering actionable insights that drive faster delivery, minimize disruptions, and optimize resource utilization.

  • AI predicts demand, optimizes load capacity, and prioritizes shipments
  • IoT devices provide real-time cargo tracking and condition monitoring
  • Cloud-based platforms improve communication and operational efficiency

Market Challenge High Costs and Regulatory Complexity

High implementation costs and regulatory requirements are major challenges in the air freight forwarding system market. Initial investment in digital platforms, IoT devices, and AI analytics is significant, particularly for SMEs. Compliance with customs, safety, and international trade regulations varies across regions, adding complexity to operations. Limited digital infrastructure in emerging markets can restrict adoption and create bottlenecks. In my opinion, forwarders must balance technology investment with regulatory compliance and workforce training to realize the full benefits of digital forwarding systems. Without addressing these challenges, growth may be slower despite rising global trade and logistics demand.

  • High implementation costs limit adoption for small and medium enterprises
  • Regulatory variations increase operational complexity across regions
  • Limited digital infrastructure can restrict deployment and efficiency

Analyzing Air Freight Forwarding System Market by Top Investment Segments

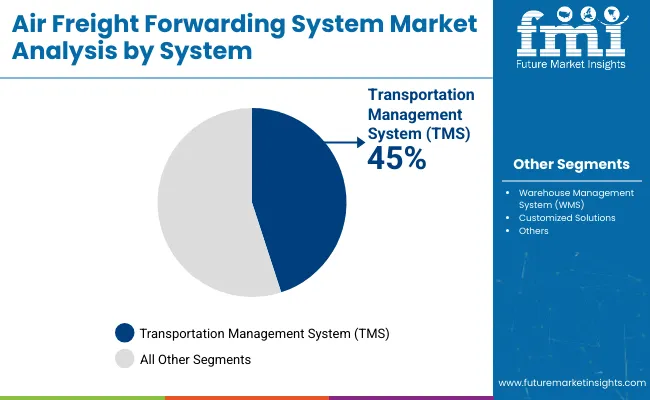
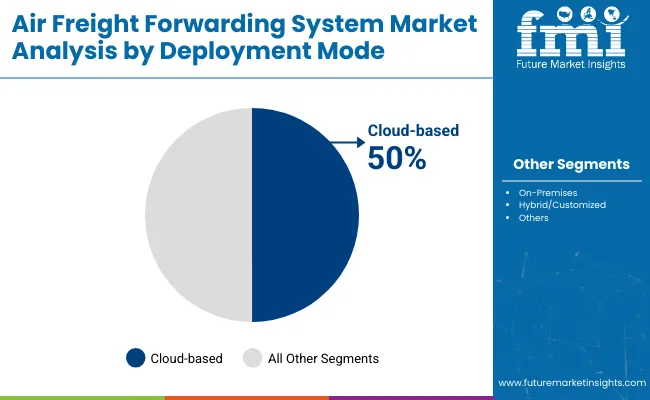
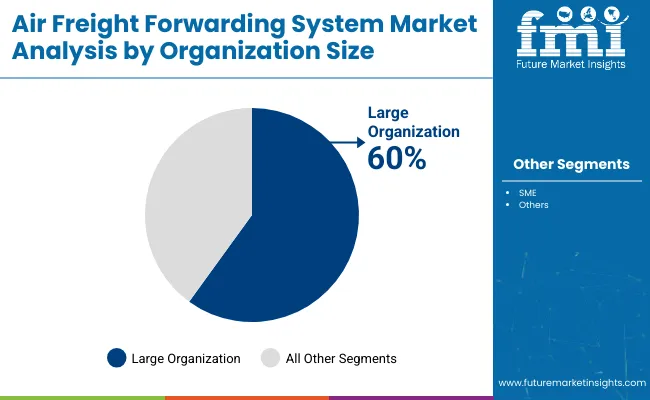
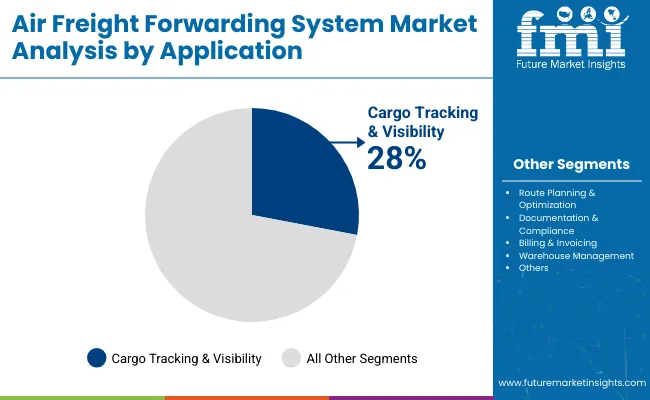
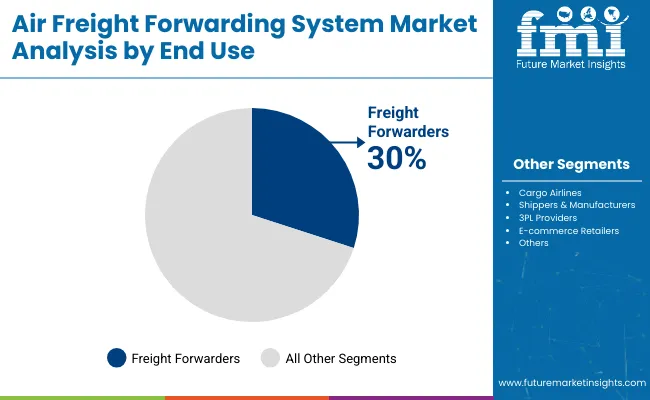
The Air Freight Forwarding System Market in 2025 is driven by global logistics digitization, real-time visibility requirements, and e-commerce expansion. Transportation Management Systems (TMS) dominate with 45% share, while Warehouse Management Systems (WMS) hold 30%, and customized solutions account for 25%. Cloud-based deployment leads with 50% share, followed by on-premises at 30%, and hybrid/customized at 20%. Large organizations hold 60% of adoption, SMEs 40%. Cargo tracking and visibility dominate applications with 28%, and freight forwarders are the leading end users at 30%.
Transportation Management, Warehouse Management, And Customized Solutions Lead System Segment

Air Freight Forwarding System Market By System

Transportation Management Systems (TMS) capture 45% of market share, optimizing shipment planning, route allocation, and fleet management. Warehouse Management Systems (WMS) hold 30%, enabling inventory tracking, stock optimization, and seamless cargo handling. Customized solutions account for 25%, tailored to unique operational needs of large carriers or regional logistics providers. Leading vendors include SAP, Oracle, Descartes, and CargoWise, integrating predictive analytics, AI-driven route optimization, and compliance management. TMS adoption is highest among global freight forwarders and cargo airlines, WMS is critical for e-commerce retailers and 3PL providers, and customized solutions cater to specialized cargo or regional regulatory requirements. System selection impacts operational efficiency, cost reduction, and end-to-end shipment visibility.
  • SAP provides 40% of TMS solutions to global freight operators
  • Oracle supplies 35% of WMS platforms for warehouse optimization
  • Descartes delivers 25% of customized forwarding solutions globally

Cloud, On-Premises, And Hybrid Deployment Modes Drive Adoption

Air Freight Forwarding System Market By Deployment

Cloud-based deployment dominates with 50% share, offering scalable, real-time access to logistics data, predictive analytics, and remote management. On-premises solutions hold 30%, preferred by organizations with strict data security and compliance needs. Hybrid or customized deployments contribute 20%, combining cloud flexibility with localized control. Providers such as CargoWise, SAP, and Oracle support multiple deployment models, enabling freight forwarders, cargo airlines, and e-commerce logistics firms to optimize operations. Cloud adoption is driven by cost efficiency, software updates, and cross-regional visibility. On-premises is favored in highly regulated regions or for sensitive cargo, while hybrid solutions offer the best of both approaches for mid-to-large organizations.
  • CargoWise provides 45% of cloud-based freight forwarding solutions globally
  • SAP delivers 35% of on-premises systems for regulated logistics environments
  • Oracle supports 25% of hybrid/customized deployments for multinational operators

Large and SME Organizations Shape Market Demand

Air Freight Forwarding System Market By Organization

Large organizations account for 60% of market adoption, leveraging TMS, WMS, and customized platforms for complex logistics networks, multi-country operations, and high-volume cargo management. SMEs represent 40%, increasingly adopting cloud-based solutions for affordability, scalability, and real-time operational control. Key adopters include global freight forwarders, cargo airlines, and 3PL providers. Large organizations benefit from advanced analytics, integration with ERP systems, and AI-driven route optimization. SMEs rely on intuitive interfaces, modular deployment, and cost-effective software subscriptions. Market growth is underpinned by the need for operational efficiency, risk mitigation, and digital transformation across organizations of all sizes.
  • DHL and Kuehne + Nagel represent 40% of large organization adoption globally
  • DB Schenker and UPS serve 35% of SME logistics customers
  • FedEx integrates 25% of mid-size operators into TMS and WMS platforms

Cargo Tracking, Route Optimization, And Documentation Drive Applications

Air Freight Forwarding System Market By Application

Cargo tracking and visibility dominate with 28% share, providing real-time shipment status and predictive alerts. Route planning and optimization follow with 22%, minimizing transit times and operational costs. Documentation and compliance account for 18%, ensuring customs adherence and regulatory reporting. Billing and invoicing and warehouse management hold 12% each, while other applications account for 8%. Providers like Descartes, SAP, and Oracle integrate AI, IoT, and cloud connectivity for end-to-end monitoring. Adoption is strongest among freight forwarders, cargo airlines, and e-commerce retailers. Application effectiveness directly impacts operational efficiency, risk mitigation, and customer satisfaction.
  • Descartes provides 40% of cargo tracking and visibility tools for global operators
  • SAP supplies 35% of route planning and optimization platforms
  • Oracle delivers 25% of documentation and compliance management solutions

Freight Forwarders, Airlines, And Manufacturers Lead End-User Segment

Air Freight Forwarding System Market By End Use

Freight forwarders lead with 30% share, leveraging TMS, WMS, and cloud solutions for global and regional operations. Cargo airlines account for 25%, integrating forwarding systems for operational coordination. Shippers and manufacturers hold 20%, using platforms for inventory visibility and shipping efficiency. 3PL providers contribute 15%, while e-commerce retailers represent 10%. Key providers including SAP, Oracle, Descartes, and CargoWise serve these users with integrated software solutions supporting tracking, billing, and regulatory compliance. End-user segmentation demonstrates the centrality of forwarders and carriers in driving system adoption, with SMEs and manufacturers gradually adopting technology for operational efficiency and scalability.
  • DHL and Kuehne + Nagel represent 40% of freight forwarder adoption globally
  • FedEx and Emirates SkyCargo provide 35% of airline integration solutions
  • Amazon and Walmart implement 25% of platform adoption for manufacturing and e-commerce

Top Countries Expanding, Operating, and Advancing in the Air Freight Forwarding System Market

Air Freight Forwarding System Market By Country

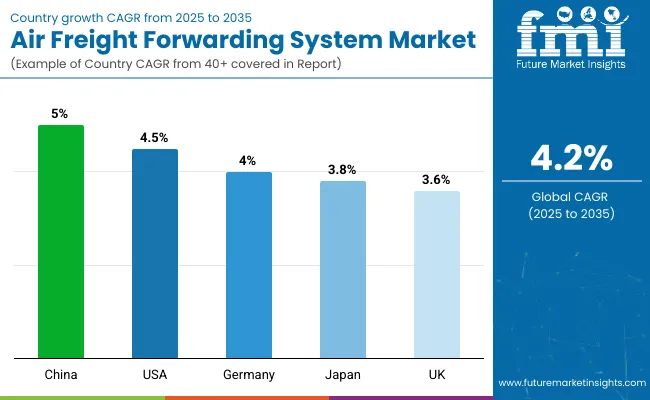
China dominates the air freight forwarding system market with a CAGR of 5.0% from 2025 to 2035, +19% above the global average of 4.2%. This outperformance reflects BRICS-driven growth in e-commerce exports, cross-border trade volumes, and large-scale investment in digital logistics infrastructure. The United States follows at 4.5%, +7% over the global benchmark, benefiting from OECD-supported innovations in automated cargo management, real-time tracking, and integration of AI-enabled supply chain solutions.

Germany posts 4.0%, −5% below the global CAGR, reflecting a mature market where incremental technological adoption drives steady improvements. Japan records 3.8%, −10% under the global rate, constrained by limited expansion capacity despite advanced operational efficiency. The United Kingdom stands at 3.6%, −14% below the global average, with growth moderated by modest investment in digital freight solutions and network scalability. Data indicates BRICS economies are accelerating adoption through scale and trade demand, while OECD nations emphasize efficiency, compliance, and precision-driven technological integration to maintain steady market performance.

Air Freight Forwarding System Market Outlook in China

The air freight forwarding system market in China is projected to grow at a CAGR of 5.0%, driven by the expansion of e-commerce, industrial exports, and logistics digitization. Shanghai Pudong handled over 3.5 million tonnes of cargo in 2024, while Shenzhen and Guangzhou airports processed approximately 2.8 million and 2.1 million tonnes, respectively. Forwarders like SF Express and China Cargo Airlines integrate AI-based scheduling and automated cargo tracking to reduce turnaround times. Cold chain forwarding for pharmaceuticals and perishable goods increased by 12% in volume last year. E-commerce exports of electronics and industrial components from Guangdong and Jiangsu provinces dominate the market.

  • AI-based scheduling improves load planning and reduces average delivery time by 15%
  • Cold chain forwarding volume grew by 12% annually, supporting pharmaceuticals and perishables
  • Major hubs handle over 8 million tonnes of cargo collectively, strengthening operational capacity

Air Freight Forwarding System Market Growth in the United States

The United States market is projected to grow at a CAGR of 4.5%, with Memphis, Louisville, and Chicago airports collectively handling over 10 million tonnes of cargo annually. FedEx Express, UPS Airlines, and Expeditors deploy predictive analytics for route optimization and real-time tracking. Freight forwarding for industrial machinery, high-value electronics, and automotive parts represents over 55% of volume handled. Investment in warehouse automation has reduced cargo dwell time by up to 20%. E-commerce shipments, particularly same-day and next-day deliveries, account for roughly 30% of air forwarding volume.

  • Predictive analytics optimize cargo routing, reducing fuel and operational costs by 10-12%
  • E-commerce shipments comprise approximately 30% of annual air forwarding volume
  • Automation in terminals reduces cargo dwell time by up to 20%

Air Freight Forwarding System Market Expansion in Germany

The market in Germany is expected to expand at a CAGR of 4.0%, anchored by Frankfurt and Munich as leading hubs. Frankfurt Airport handled 2.2 million tonnes, while Munich processed 1.5 million tonnes in the last fiscal year. Lufthansa Cargo, DHL, and DB Schenker dominate forwarding services, transporting automotive parts, industrial machinery, and pharmaceuticals. Just-in-time supply chains in automotive production contribute significantly to air forwarding volume. Investments in automated sorting and warehouse management reduce processing time by 18%. Intra-European freight accounts for nearly 60% of forwarding operations, while intercontinental exports, especially to North America and Asia, drive high-value cargo traffic.

  • Frankfurt and Munich airports together handle 3.7 million tonnes of cargo annually
  • Automated sorting and warehouse systems reduce processing time by 18%
  • Intercontinental freight for high-value goods supports nearly 40% of total volume

Air Freight Forwarding System Market Trends in Japan

The air freight forwarding market in Japan is projected to grow at a CAGR of 3.8%, with Tokyo Narita, Haneda, and Kansai airports processing approximately 1.2 million, 0.9 million, and 0.6 million tonnes, respectively. ANA Cargo and Nippon Cargo Airlines focus on electronics, automotive parts, and precision machinery exports. Cold chain forwarding volumes for pharmaceuticals and perishables grew by 10% last year. AI-assisted shipment scheduling improves aircraft utilization by roughly 8%. Export demand to North America and Europe sustains growth, while warehouse automation has improved processing efficiency by 15%.

  • Narita, Haneda, and Kansai airports collectively process over 2.7 million tonnes of cargo
  • Cold chain logistics increased volume by 10% for perishable and pharmaceutical goods
  • AI-assisted scheduling enhances aircraft utilization by approximately 8%

Air Freight Forwarding System Market Prospects in the United Kingdom

The United Kingdom market is expected to grow at a CAGR of 3.6%, with London Heathrow and East Midlands airports handling around 1.1 million and 0.7 million tonnes of cargo annually. DHL, Virgin Atlantic Cargo, and IAG Cargo lead operations, transporting high-value electronics, pharmaceuticals, and fashion goods. Warehouse automation, including robotic sorting and automated cold storage, has improved processing speed by 12%. E-commerce shipments account for 25-30% of air freight volume. Predictive analytics tools reduce routing inefficiencies by nearly 10%, while infrastructure modernization enhances handling capacity and minimizes delays.
  • Heathrow and East Midlands handle 1.8 million tonnes collectively, supporting logistics capacity
  • Robotic sorting and automated cold storage improve cargo processing speed by 12%
  • Predictive analytics reduce routing inefficiencies by nearly 10%

Leading Air Freight Forwarding System Manufacturers, Suppliers, Distributors

Air Freight Forwarding System Market By Company

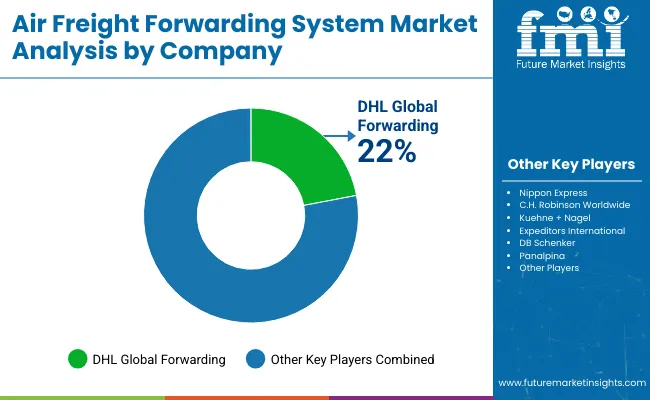
Air freight forwarding companies compete by providing efficient routing, flexible solutions, and reliable delivery across global trade lanes. Nippon Express and C.H. Robinson Worldwide optimize international supply chains, leveraging technology for shipment tracking, customs management, and multi-modal integration. DHL Global Forwarding and Kuehne + Nagel offer end-to-end logistics solutions combining air, sea, and ground transport, ensuring seamless movement of high-value cargo. Expeditors International and DB Schenker focus on time-sensitive shipments and specialized handling for electronics, perishables, and industrial goods.

Panalpina and UPS Supply Chain Solutions enhance operational efficiency through predictive analytics, warehouse management systems, and automated freight scheduling. Agility Logistics and FedEx Logistics provide temperature-controlled transport, rapid customs clearance, and tailored solutions for pharmaceuticals, e-commerce, and oversized cargo. Fleet expansion, digital freight platforms, and strategic partnerships drive competitive advantage, reducing transit times while improving capacity utilization and cargo security.

Marketing strategies rely on product brochures, digital catalogs, and interactive portals showcasing service offerings, transit routes, and cargo handling processes. Brochures highlight operational efficiency, global network coverage, and risk mitigation, allowing businesses to select solutions aligned with specific supply chain requirements. Digital presentations often include transit timelines, route comparisons, and handling protocols to simplify decision-making. Each carrier positions itself as a reliable partner for global air freight, emphasizing speed, safety, and service quality over promotional rhetoric.

Leading Players

  • DHL Global Forwarding
  • Nippon Express
  • C.H. Robinson Worldwide
  • Kuehne + Nagel
  • Expeditors International
  • DB Schenker
  • Panalpina
  • UPS Supply Chain Solutions
  • Agility Logistics
  • FedEx Logistics

Report Scope

Report Attributes Details
Market Size (2025) USD 9.2 billion
Projected Market Size (2035) USD 13.8 billion
CAGR (2025 to 2035) 4.2%
Base Year for Estimation 2024
Historical Period 2020 to 2024
Projection Period 2025 to 2035
Quantitative Units USD billion for value
System Segments Transportation Management System (TMS), Warehouse Management System (WMS), Customized Solutions
Deployment Mode Segments Cloud-based (TMS, WMS, Customized Solutions), On-Premises (TMS, WMS, Customized Solutions)
Organization Size Segments SME, Large Organization
Application Segments Cargo Tracking & Visibility, Route Planning & Optimization, Documentation & Compliance, Billing & Invoicing, Warehouse Management, Others
End-Use Segments Freight Forwarders, Cargo Airlines, Shippers & Manufacturers, 3PL Providers, E-commerce Retailers
Regions Covered North America, Latin America, Western Europe, Eastern Europe, Asia Pacific, Middle East & Africa
Countries Covered United States, Canada, Brazil, Mexico, Germany, United Kingdom, France, Italy, China, Japan, India, UAE, Saudi Arabia, South Africa, Australia
Leading Players DHL Global Forwarding, Nippon Express, C.H. Robinson Worldwide, Kuehne + Nagel, Expeditors International, DB Schenker, Panalpina, UPS Supply Chain Solutions, Agility Logistics, FedEx Logistics
Additional Attributes Dollar sales by system type and deployment mode, demand dynamics across freight forwarders, cargo airlines, and e-commerce, regional adoption trends, innovation in TMS/WMS integration, cloud solutions, route optimization, and warehouse automation

Air Freight Forwarding System Market Analyzed by Key Investment Segments

By System:

  • Transportation management system (TMS)
  • Warehouse management system (WMS)
  • Customized solutions

By Deployment Mode:

  • Cloud-based
  • Transportation management system (TMS)
  • Warehouse management system (WMS)
  • Customized solutions
  • On-Premises
  • Transportation management system (TMS)
  • Warehouse management system (WMS)
  • Customized solutions

By Organization Size:

  • SME
  • Large organization

By Application:

  • Cargo tracking & visibility
  • Route planning & optimization
  • Documentation & compliance
  • Billing & invoicing
  • Warehouse management
  • Others

By End Use:

  • Freight forwarders
  • Cargo airlines
  • Shippers & manufacturers
  • 3PL (Third-Party Logistics) providers
  • E-commerce retailers

By Region:

  • North America
  • Latin America
  • Western Europe
  • Eastern Europe
  • Asia Pacific
  • The Middle East and Africa

Table of Content

  1. Executive Summary
    • Global Market Outlook
    • Demand-side Trends
    • Supply-side Trends
    • Technology Roadmap Analysis
    • Analysis and Recommendations
  2. Market Overview
    • Market Coverage / Taxonomy
    • Market Definition / Scope / Limitations
  3. Market Background
    • Market Dynamics
      • Drivers
      • Restraints
      • Opportunity
      • Trends
    • Scenario Forecast
      • Demand in Optimistic Scenario
      • Demand in Likely Scenario
      • Demand in Conservative Scenario
    • Opportunity Map Analysis
    • Product Life Cycle Analysis
    • Supply Chain Analysis
      • Supply Side Participants and their Roles
        • Producers
        • Mid-Level Participants (Traders/ Agents/ Brokers)
        • Wholesalers and Distributors
      • Value Added and Value Created at Node in the Supply Chain
      • List of Raw Material Suppliers
      • List of Existing and Potential Buyer’s
    • Investment Feasibility Matrix
    • Value Chain Analysis
      • Profit Margin Analysis
      • Wholesalers and Distributors
      • Retailers
    • PESTLE and Porter’s Analysis
    • Regulatory Landscape
      • By Key Regions
      • By Key Countries
    • Regional Parent Market Outlook
    • Production and Consumption Statistics
    • Import and Export Statistics
  4. Global Market Analysis 2020 to 2024 and Forecast, 2025 to 2035
    • Historical Market Size Value (USD Billion) & Volume (Thousand Units) Analysis, 2020 to 2024
    • Current and Future Market Size Value (USD Billion) & Volume (Thousand Units) Projections, 2025 to 2035
      • Y-o-Y Growth Trend Analysis
      • Absolute $ Opportunity Analysis
  5. Global Market Pricing Analysis 2020 to 2024 and Forecast 2025 to 2035
  6. Global Market Analysis 2020 to 2024 and Forecast 2025 to 2035, By System
    • Introduction / Key Findings
    • Historical Market Size Value (USD Billion) & Volume (Thousand Units) Analysis By System, 2020 to 2024
    • Current and Future Market Size Value (USD Billion) & Volume (Thousand Units) Analysis and Forecast By System, 2025 to 2035
      • Transportation Management System (TMS)
      • Warehouse Management System (WMS)
      • Customized Solutions
    • Y-o-Y Growth Trend Analysis By System, 2020 to 2024
    • Absolute $ Opportunity Analysis By System, 2025 to 2035
  7. Global Market Analysis 2020 to 2024 and Forecast 2025 to 2035, By Deployment Mode
    • Introduction / Key Findings
    • Historical Market Size Value (USD Billion) & Volume (Thousand Units) Analysis By Deployment Mode, 2020 to 2024
    • Current and Future Market Size Value (USD Billion) & Volume (Thousand Units) Analysis and Forecast By Deployment Mode, 2025 to 2035
      • Cloud-based
      • On-Premises
      • Hybrid/Customized
    • Y-o-Y Growth Trend Analysis By Deployment Mode, 2020 to 2024
    • Absolute $ Opportunity Analysis By Deployment Mode, 2025 to 2035
  8. Global Market Analysis 2020 to 2024 and Forecast 2025 to 2035, By Organization Size
    • Introduction / Key Findings
    • Historical Market Size Value (USD Billion) & Volume (Thousand Units) Analysis By Organization Size, 2020 to 2024
    • Current and Future Market Size Value (USD Billion) & Volume (Thousand Units) Analysis and Forecast By Organization Size, 2025 to 2035
      • Large Organization
      • SME
    • Y-o-Y Growth Trend Analysis By Organization Size, 2020 to 2024
    • Absolute $ Opportunity Analysis By Organization Size, 2025 to 2035
  9. Global Market Analysis 2020 to 2024 and Forecast 2025 to 2035, By Application
    • Introduction / Key Findings
    • Historical Market Size Value (USD Billion) & Volume (Thousand Units) Analysis By Application, 2020 to 2024
    • Current and Future Market Size Value (USD Billion) & Volume (Thousand Units) Analysis and Forecast By Application, 2025 to 2035
      • Cargo Tracking & Visibility
      • Route Planning & Optimization
      • Documentation & Compliance
      • Billing & Invoicing
      • Warehouse Management
      • Others
    • Y-o-Y Growth Trend Analysis By Application, 2020 to 2024
    • Absolute $ Opportunity Analysis By Application, 2025 to 2035
  10. Global Market Analysis 2020 to 2024 and Forecast 2025 to 2035, By End Use
    • Introduction / Key Findings
    • Historical Market Size Value (USD Billion) & Volume (Thousand Units) Analysis By End Use, 2020 to 2024
    • Current and Future Market Size Value (USD Billion) & Volume (Thousand Units) Analysis and Forecast By End Use, 2025 to 2035
      • Freight Forwarders
      • Cargo Airlines
      • Shippers & Manufacturers
      • 3PL Providers
      • E-commerce Retailers
    • Y-o-Y Growth Trend Analysis By End Use, 2020 to 2024
    • Absolute $ Opportunity Analysis By End Use, 2025 to 2035
  11. Global Market Analysis 2020 to 2024 and Forecast 2025 to 2035, By Region
    • Introduction
    • Historical Market Size Value (USD Billion) & Volume (Thousand Units) Analysis By Region, 2020 to 2024
    • Current Market Size Value (USD Billion) & Volume (Thousand Units) Analysis and Forecast By Region, 2025 to 2035
      • North America
      • Latin America
      • Western Europe
      • Eastern Europe
      • East Asia
      • South Asia & Pacific
      • Middle East and Africa
    • Market Attractiveness Analysis By Region
  12. North America Market Analysis 2020 to 2024 and Forecast 2025 to 2035, By Country
    • Historical Market Size Value (USD Billion) & Volume (Thousand Units) Trend Analysis By Market Taxonomy, 2020 to 2024
    • Market Size Value (USD Billion) & Volume (Thousand Units) Forecast By Market Taxonomy, 2025 to 2035
      • By Country
        • USA
        • Canada
        • Mexico
      • By System
      • By Deployment Mode
      • By Organization Size
      • By Application
      • By End Use
    • Market Attractiveness Analysis
      • By Country
      • By System
      • By Deployment Mode
      • By Organization Size
      • By Application
      • By End Use
    • Key Takeaways
  13. Latin America Market Analysis 2020 to 2024 and Forecast 2025 to 2035, By Country
    • Historical Market Size Value (USD Billion) & Volume (Thousand Units) Trend Analysis By Market Taxonomy, 2020 to 2024
    • Market Size Value (USD Billion) & Volume (Thousand Units) Forecast By Market Taxonomy, 2025 to 2035
      • By Country
        • Brazil
        • Argentina
        • Rest of LATAM
      • By System
      • By Deployment Mode
      • By Organization Size
      • By Application
      • By End Use
    • Market Attractiveness Analysis
      • By Country
      • By System
      • By Deployment Mode
      • By Organization Size
      • By Application
      • By End Use
    • Key Takeaways
  14. Western Europe Market Analysis 2020 to 2024 and Forecast 2025 to 2035, By Country
    • Historical Market Size Value (USD Billion) & Volume (Thousand Units) Trend Analysis By Market Taxonomy, 2020 to 2024
    • Market Size Value (USD Billion) & Volume (Thousand Units) Forecast By Market Taxonomy, 2025 to 2035
      • By Country
        • Germany
        • Italy
        • France
        • UK
        • Spain
        • BENELUX
        • Nordic
        • Rest of W.Europe
      • By System
      • By Deployment Mode
      • By Organization Size
      • By Application
      • By End Use
    • Market Attractiveness Analysis
      • By Country
      • By System
      • By Deployment Mode
      • By Organization Size
      • By Application
      • By End Use
    • Key Takeaways
  15. Eastern Europe Market Analysis 2020 to 2024 and Forecast 2025 to 2035, By Country
    • Historical Market Size Value (USD Billion) & Volume (Thousand Units) Trend Analysis By Market Taxonomy, 2020 to 2024
    • Market Size Value (USD Billion) & Volume (Thousand Units) Forecast By Market Taxonomy, 2025 to 2035
      • By Country
        • Russia
        • Hungary
        • Poland
        • Balkan & Baltics
        • Rest of E. Europe
      • By System
      • By Deployment Mode
      • By Organization Size
      • By Application
      • By End Use
    • Market Attractiveness Analysis
      • By Country
      • By System
      • By Deployment Mode
      • By Organization Size
      • By Application
      • By End Use
    • Key Takeaways
  16. East Asia Market Analysis 2020 to 2024 and Forecast 2025 to 2035, By Country
    • Historical Market Size Value (USD Billion) & Volume (Thousand Units) Trend Analysis By Market Taxonomy, 2020 to 2024
    • Market Size Value (USD Billion) & Volume (Thousand Units) Forecast By Market Taxonomy, 2025 to 2035
      • By Country
        • China
        • Japan
        • South Korea
      • By System
      • By Deployment Mode
      • By Organization Size
      • By Application
      • By End Use
    • Market Attractiveness Analysis
      • By Country
      • By System
      • By Deployment Mode
      • By Organization Size
      • By Application
      • By End Use
    • Key Takeaways
  17. South Asia & Pacific Market Analysis 2020 to 2024 and Forecast 2025 to 2035, By Country
    • Historical Market Size Value (USD Billion) & Volume (Thousand Units) Trend Analysis By Market Taxonomy, 2020 to 2024
    • Market Size Value (USD Billion) & Volume (Thousand Units) Forecast By Market Taxonomy, 2025 to 2035
      • By Country
        • India
        • Australia & New Zealand
        • ASEAN
        • Rest of SAP
      • By System
      • By Deployment Mode
      • By Organization Size
      • By Application
      • By End Use
    • Market Attractiveness Analysis
      • By Country
      • By System
      • By Deployment Mode
      • By Organization Size
      • By Application
      • By End Use
    • Key Takeaways
  18. Middle East and Africa Market Analysis 2020 to 2024 and Forecast 2025 to 2035, By Country
    • Historical Market Size Value (USD Billion) & Volume (Thousand Units) Trend Analysis By Market Taxonomy, 2020 to 2024
    • Market Size Value (USD Billion) & Volume (Thousand Units) Forecast By Market Taxonomy, 2025 to 2035
      • By Country
        • GCC Countries
        • Northern Africa
        • South Africa
        • Turkiye
        • Rest of MEA
      • By System
      • By Deployment Mode
      • By Organization Size
      • By Application
      • By End Use
    • Market Attractiveness Analysis
      • By Country
      • By System
      • By Deployment Mode
      • By Organization Size
      • By Application
      • By End Use
    • Key Takeaways
  19. Key Countries Market Analysis
    • USA
      • Pricing Analysis
      • Market Share Analysis, 2024
        • By System
        • By Deployment Mode
        • By Organization Size
        • By Application
        • By End Use
    • Canada
      • Pricing Analysis
      • Market Share Analysis, 2024
        • By System
        • By Deployment Mode
        • By Organization Size
        • By Application
        • By End Use
    • Brazil
      • Pricing Analysis
      • Market Share Analysis, 2024
        • By System
        • By Deployment Mode
        • By Organization Size
        • By Application
        • By End Use
    • Mexico
      • Pricing Analysis
      • Market Share Analysis, 2024
        • By System
        • By Deployment Mode
        • By Organization Size
        • By Application
        • By End Use
    • Argentina
      • Pricing Analysis
      • Market Share Analysis, 2024
        • By System
        • By Deployment Mode
        • By Organization Size
        • By Application
        • By End Use
  20. Market Structure Analysis
    • Competition Dashboard
    • Competition Benchmarking
    • Market Share Analysis of Top Players
      • By Regional
      • By System
      • By Deployment Mode
      • By Organization Size
      • By Application
      • By End Use
  21. Competition Analysis
    • Competition Deep Dive
      • DHL Global Forwarding
        • Overview
        • Product Portfolio
        • Profitability by Market Segments (Product/Age /Sales Channel/Region)
        • Sales Footprint
        • Strategy Overview
          • Marketing Strategy
          • Product Strategy
          • Channel Strategy
      • Nippon Express
        • Overview
        • Product Portfolio
        • Profitability by Market Segments (Product/Age /Sales Channel/Region)
        • Sales Footprint
        • Strategy Overview
          • Marketing Strategy
          • Product Strategy
          • Channel Strategy
      • C.H. Robinson Worldwide
        • Overview
        • Product Portfolio
        • Profitability by Market Segments (Product/Age /Sales Channel/Region)
        • Sales Footprint
        • Strategy Overview
          • Marketing Strategy
          • Product Strategy
          • Channel Strategy
      • Kuehne + Nagel
        • Overview
        • Product Portfolio
        • Profitability by Market Segments (Product/Age /Sales Channel/Region)
        • Sales Footprint
        • Strategy Overview
          • Marketing Strategy
          • Product Strategy
          • Channel Strategy
      • Expeditors International
        • Overview
        • Product Portfolio
        • Profitability by Market Segments (Product/Age /Sales Channel/Region)
        • Sales Footprint
        • Strategy Overview
          • Marketing Strategy
          • Product Strategy
          • Channel Strategy
      • DB Schenker
        • Overview
        • Product Portfolio
        • Profitability by Market Segments (Product/Age /Sales Channel/Region)
        • Sales Footprint
        • Strategy Overview
          • Marketing Strategy
          • Product Strategy
          • Channel Strategy
      • Panalpina
        • Overview
        • Product Portfolio
        • Profitability by Market Segments (Product/Age /Sales Channel/Region)
        • Sales Footprint
        • Strategy Overview
          • Marketing Strategy
          • Product Strategy
          • Channel Strategy
      • UPS Supply Chain Solutions
        • Overview
        • Product Portfolio
        • Profitability by Market Segments (Product/Age /Sales Channel/Region)
        • Sales Footprint
        • Strategy Overview
          • Marketing Strategy
          • Product Strategy
          • Channel Strategy
      • Agility Logistics
        • Overview
        • Product Portfolio
        • Profitability by Market Segments (Product/Age /Sales Channel/Region)
        • Sales Footprint
        • Strategy Overview
          • Marketing Strategy
          • Product Strategy
          • Channel Strategy
      • FedEx Logistics
        • Overview
        • Product Portfolio
        • Profitability by Market Segments (Product/Age /Sales Channel/Region)
        • Sales Footprint
        • Strategy Overview
          • Marketing Strategy
          • Product Strategy
          • Channel Strategy
  22. Assumptions & Acronyms Used
  23. Research Methodology

List of Tables

  • Table 1: Global Market Value (USD Billion) Forecast by Region, 2020-2035
  • Table 2: Global Market Volume (Thousand Units) Forecast by Region, 2020-2035
  • Table 3: Global Market Value (USD Billion) Forecast by System, 2020-2035
  • Table 4: Global Market Volume (Thousand Units) Forecast by System, 2020-2035
  • Table 5: Global Market Value (USD Billion) Forecast by Deployment Mode, 2020-2035
  • Table 6: Global Market Volume (Thousand Units) Forecast by Deployment Mode, 2020-2035
  • Table 7: Global Market Value (USD Billion) Forecast by Organization Size, 2020-2035
  • Table 8: Global Market Volume (Thousand Units) Forecast by Organization Size, 2020-2035
  • Table 9: Global Market Value (USD Billion) Forecast by Application, 2020-2035
  • Table 10: Global Market Volume (Thousand Units) Forecast by Application, 2020-2035
  • Table 11: Global Market Value (USD Billion) Forecast by End Use, 2020-2035
  • Table 12: Global Market Volume (Thousand Units) Forecast by End Use, 2020-2035
  • Table 13: North America Market Value (USD Billion) Forecast by Country, 2020-2035
  • Table 14: North America Market Volume (Thousand Units) Forecast by Country, 2020-2035
  • Table 15: North America Market Value (USD Billion) Forecast by System, 2020-2035
  • Table 16: North America Market Volume (Thousand Units) Forecast by System, 2020-2035
  • Table 17: North America Market Value (USD Billion) Forecast by Deployment Mode, 2020-2035
  • Table 18: North America Market Volume (Thousand Units) Forecast by Deployment Mode, 2020-2035
  • Table 19: North America Market Value (USD Billion) Forecast by Organization Size, 2020-2035
  • Table 20: North America Market Volume (Thousand Units) Forecast by Organization Size, 2020-2035
  • Table 21: North America Market Value (USD Billion) Forecast by Application, 2020-2035
  • Table 22: North America Market Volume (Thousand Units) Forecast by Application, 2020-2035
  • Table 23: North America Market Value (USD Billion) Forecast by End Use, 2020-2035
  • Table 24: North America Market Volume (Thousand Units) Forecast by End Use, 2020-2035
  • Table 25: Latin America Market Value (USD Billion) Forecast by Country, 2020-2035
  • Table 26: Latin America Market Volume (Thousand Units) Forecast by Country, 2020-2035
  • Table 27: Latin America Market Value (USD Billion) Forecast by System, 2020-2035
  • Table 28: Latin America Market Volume (Thousand Units) Forecast by System, 2020-2035
  • Table 29: Latin America Market Value (USD Billion) Forecast by Deployment Mode, 2020-2035
  • Table 30: Latin America Market Volume (Thousand Units) Forecast by Deployment Mode, 2020-2035
  • Table 31: Latin America Market Value (USD Billion) Forecast by Organization Size, 2020-2035
  • Table 32: Latin America Market Volume (Thousand Units) Forecast by Organization Size, 2020-2035
  • Table 33: Latin America Market Value (USD Billion) Forecast by Application, 2020-2035
  • Table 34: Latin America Market Volume (Thousand Units) Forecast by Application, 2020-2035
  • Table 35: Latin America Market Value (USD Billion) Forecast by End Use, 2020-2035
  • Table 36: Latin America Market Volume (Thousand Units) Forecast by End Use, 2020-2035
  • Table 37: Western Europe Market Value (USD Billion) Forecast by Country, 2020-2035
  • Table 38: Western Europe Market Volume (Thousand Units) Forecast by Country, 2020-2035
  • Table 39: Western Europe Market Value (USD Billion) Forecast by System, 2020-2035
  • Table 40: Western Europe Market Volume (Thousand Units) Forecast by System, 2020-2035
  • Table 41: Western Europe Market Value (USD Billion) Forecast by Deployment Mode, 2020-2035
  • Table 42: Western Europe Market Volume (Thousand Units) Forecast by Deployment Mode, 2020-2035
  • Table 43: Western Europe Market Value (USD Billion) Forecast by Organization Size, 2020-2035
  • Table 44: Western Europe Market Volume (Thousand Units) Forecast by Organization Size, 2020-2035
  • Table 45: Western Europe Market Value (USD Billion) Forecast by Application, 2020-2035
  • Table 46: Western Europe Market Volume (Thousand Units) Forecast by Application, 2020-2035
  • Table 47: Western Europe Market Value (USD Billion) Forecast by End Use, 2020-2035
  • Table 48: Western Europe Market Volume (Thousand Units) Forecast by End Use, 2020-2035
  • Table 49: Eastern Europe Market Value (USD Billion) Forecast by Country, 2020-2035
  • Table 50: Eastern Europe Market Volume (Thousand Units) Forecast by Country, 2020-2035
  • Table 51: Eastern Europe Market Value (USD Billion) Forecast by System, 2020-2035
  • Table 52: Eastern Europe Market Volume (Thousand Units) Forecast by System, 2020-2035
  • Table 53: Eastern Europe Market Value (USD Billion) Forecast by Deployment Mode, 2020-2035
  • Table 54: Eastern Europe Market Volume (Thousand Units) Forecast by Deployment Mode, 2020-2035
  • Table 55: Eastern Europe Market Value (USD Billion) Forecast by Organization Size, 2020-2035
  • Table 56: Eastern Europe Market Volume (Thousand Units) Forecast by Organization Size, 2020-2035
  • Table 57: Eastern Europe Market Value (USD Billion) Forecast by Application, 2020-2035
  • Table 58: Eastern Europe Market Volume (Thousand Units) Forecast by Application, 2020-2035
  • Table 59: Eastern Europe Market Value (USD Billion) Forecast by End Use, 2020-2035
  • Table 60: Eastern Europe Market Volume (Thousand Units) Forecast by End Use, 2020-2035
  • Table 61: East Asia Market Value (USD Billion) Forecast by Country, 2020-2035
  • Table 62: East Asia Market Volume (Thousand Units) Forecast by Country, 2020-2035
  • Table 63: East Asia Market Value (USD Billion) Forecast by System, 2020-2035
  • Table 64: East Asia Market Volume (Thousand Units) Forecast by System, 2020-2035
  • Table 65: East Asia Market Value (USD Billion) Forecast by Deployment Mode, 2020-2035
  • Table 66: East Asia Market Volume (Thousand Units) Forecast by Deployment Mode, 2020-2035
  • Table 67: East Asia Market Value (USD Billion) Forecast by Organization Size, 2020-2035
  • Table 68: East Asia Market Volume (Thousand Units) Forecast by Organization Size, 2020-2035
  • Table 69: East Asia Market Value (USD Billion) Forecast by Application, 2020-2035
  • Table 70: East Asia Market Volume (Thousand Units) Forecast by Application, 2020-2035
  • Table 71: East Asia Market Value (USD Billion) Forecast by End Use, 2020-2035
  • Table 72: East Asia Market Volume (Thousand Units) Forecast by End Use, 2020-2035
  • Table 73: South Asia & Pacific Market Value (USD Billion) Forecast by Country, 2020-2035
  • Table 74: South Asia & Pacific Market Volume (Thousand Units) Forecast by Country, 2020-2035
  • Table 75: South Asia & Pacific Market Value (USD Billion) Forecast by System, 2020-2035
  • Table 76: South Asia & Pacific Market Volume (Thousand Units) Forecast by System, 2020-2035
  • Table 77: South Asia & Pacific Market Value (USD Billion) Forecast by Deployment Mode, 2020-2035
  • Table 78: South Asia & Pacific Market Volume (Thousand Units) Forecast by Deployment Mode, 2020-2035
  • Table 79: South Asia & Pacific Market Value (USD Billion) Forecast by Organization Size, 2020-2035
  • Table 80: South Asia & Pacific Market Volume (Thousand Units) Forecast by Organization Size, 2020-2035
  • Table 81: South Asia & Pacific Market Value (USD Billion) Forecast by Application, 2020-2035
  • Table 82: South Asia & Pacific Market Volume (Thousand Units) Forecast by Application, 2020-2035
  • Table 83: South Asia & Pacific Market Value (USD Billion) Forecast by End Use, 2020-2035
  • Table 84: South Asia & Pacific Market Volume (Thousand Units) Forecast by End Use, 2020-2035
  • Table 85: Middle East and Africa Market Value (USD Billion) Forecast by Country, 2020-2035
  • Table 86: Middle East and Africa Market Volume (Thousand Units) Forecast by Country, 2020-2035
  • Table 87: Middle East and Africa Market Value (USD Billion) Forecast by System, 2020-2035
  • Table 88: Middle East and Africa Market Volume (Thousand Units) Forecast by System, 2020-2035
  • Table 89: Middle East and Africa Market Value (USD Billion) Forecast by Deployment Mode, 2020-2035
  • Table 90: Middle East and Africa Market Volume (Thousand Units) Forecast by Deployment Mode, 2020-2035
  • Table 91: Middle East and Africa Market Value (USD Billion) Forecast by Organization Size, 2020-2035
  • Table 92: Middle East and Africa Market Volume (Thousand Units) Forecast by Organization Size, 2020-2035
  • Table 93: Middle East and Africa Market Value (USD Billion) Forecast by Application, 2020-2035
  • Table 94: Middle East and Africa Market Volume (Thousand Units) Forecast by Application, 2020-2035
  • Table 95: Middle East and Africa Market Value (USD Billion) Forecast by End Use, 2020-2035
  • Table 96: Middle East and Africa Market Volume (Thousand Units) Forecast by End Use, 2020-2035

List of Figures

  • Figure 1: Global Market Volume (Thousand Units) Forecast 2020-2035
  • Figure 2: Global Market Pricing Analysis
  • Figure 3: Global Market Value (USD Billion) Forecast 2020-2035
  • Figure 4: Global Market Value Share and BPS Analysis by System, 2025 and 2035
  • Figure 5: Global Market Y-o-Y Growth Comparison by System, 2025-2035
  • Figure 6: Global Market Attractiveness Analysis by System
  • Figure 7: Global Market Value Share and BPS Analysis by Deployment Mode, 2025 and 2035
  • Figure 8: Global Market Y-o-Y Growth Comparison by Deployment Mode, 2025-2035
  • Figure 9: Global Market Attractiveness Analysis by Deployment Mode
  • Figure 10: Global Market Value Share and BPS Analysis by Organization Size, 2025 and 2035
  • Figure 11: Global Market Y-o-Y Growth Comparison by Organization Size, 2025-2035
  • Figure 12: Global Market Attractiveness Analysis by Organization Size
  • Figure 13: Global Market Value Share and BPS Analysis by Application, 2025 and 2035
  • Figure 14: Global Market Y-o-Y Growth Comparison by Application, 2025-2035
  • Figure 15: Global Market Attractiveness Analysis by Application
  • Figure 16: Global Market Value Share and BPS Analysis by End Use, 2025 and 2035
  • Figure 17: Global Market Y-o-Y Growth Comparison by End Use, 2025-2035
  • Figure 18: Global Market Attractiveness Analysis by End Use
  • Figure 19: Global Market Value (USD Billion) Share and BPS Analysis by Region, 2025 and 2035
  • Figure 20: Global Market Y-o-Y Growth Comparison by Region, 2025-2035
  • Figure 21: Global Market Attractiveness Analysis by Region
  • Figure 22: North America Market Incremental $ Opportunity, 2025-2035
  • Figure 23: Latin America Market Incremental $ Opportunity, 2025-2035
  • Figure 24: Western Europe Market Incremental $ Opportunity, 2025-2035
  • Figure 25: Eastern Europe Market Incremental $ Opportunity, 2025-2035
  • Figure 26: East Asia Market Incremental $ Opportunity, 2025-2035
  • Figure 27: South Asia & Pacific Market Incremental $ Opportunity, 2025-2035
  • Figure 28: Middle East and Africa Market Incremental $ Opportunity, 2025-2035
  • Figure 29: North America Market Value Share and BPS Analysis by Country, 2025 and 2035
  • Figure 30: North America Market Value Share and BPS Analysis by System, 2025 and 2035
  • Figure 31: North America Market Y-o-Y Growth Comparison by System, 2025-2035
  • Figure 32: North America Market Attractiveness Analysis by System
  • Figure 33: North America Market Value Share and BPS Analysis by Deployment Mode, 2025 and 2035
  • Figure 34: North America Market Y-o-Y Growth Comparison by Deployment Mode, 2025-2035
  • Figure 35: North America Market Attractiveness Analysis by Deployment Mode
  • Figure 36: North America Market Value Share and BPS Analysis by Organization Size, 2025 and 2035
  • Figure 37: North America Market Y-o-Y Growth Comparison by Organization Size, 2025-2035
  • Figure 38: North America Market Attractiveness Analysis by Organization Size
  • Figure 39: North America Market Value Share and BPS Analysis by Application, 2025 and 2035
  • Figure 40: North America Market Y-o-Y Growth Comparison by Application, 2025-2035
  • Figure 41: North America Market Attractiveness Analysis by Application
  • Figure 42: North America Market Value Share and BPS Analysis by End Use, 2025 and 2035
  • Figure 43: North America Market Y-o-Y Growth Comparison by End Use, 2025-2035
  • Figure 44: North America Market Attractiveness Analysis by End Use
  • Figure 45: Latin America Market Value Share and BPS Analysis by Country, 2025 and 2035
  • Figure 46: Latin America Market Value Share and BPS Analysis by System, 2025 and 2035
  • Figure 47: Latin America Market Y-o-Y Growth Comparison by System, 2025-2035
  • Figure 48: Latin America Market Attractiveness Analysis by System
  • Figure 49: Latin America Market Value Share and BPS Analysis by Deployment Mode, 2025 and 2035
  • Figure 50: Latin America Market Y-o-Y Growth Comparison by Deployment Mode, 2025-2035
  • Figure 51: Latin America Market Attractiveness Analysis by Deployment Mode
  • Figure 52: Latin America Market Value Share and BPS Analysis by Organization Size, 2025 and 2035
  • Figure 53: Latin America Market Y-o-Y Growth Comparison by Organization Size, 2025-2035
  • Figure 54: Latin America Market Attractiveness Analysis by Organization Size
  • Figure 55: Latin America Market Value Share and BPS Analysis by Application, 2025 and 2035
  • Figure 56: Latin America Market Y-o-Y Growth Comparison by Application, 2025-2035
  • Figure 57: Latin America Market Attractiveness Analysis by Application
  • Figure 58: Latin America Market Value Share and BPS Analysis by End Use, 2025 and 2035
  • Figure 59: Latin America Market Y-o-Y Growth Comparison by End Use, 2025-2035
  • Figure 60: Latin America Market Attractiveness Analysis by End Use
  • Figure 61: Western Europe Market Value Share and BPS Analysis by Country, 2025 and 2035
  • Figure 62: Western Europe Market Value Share and BPS Analysis by System, 2025 and 2035
  • Figure 63: Western Europe Market Y-o-Y Growth Comparison by System, 2025-2035
  • Figure 64: Western Europe Market Attractiveness Analysis by System
  • Figure 65: Western Europe Market Value Share and BPS Analysis by Deployment Mode, 2025 and 2035
  • Figure 66: Western Europe Market Y-o-Y Growth Comparison by Deployment Mode, 2025-2035
  • Figure 67: Western Europe Market Attractiveness Analysis by Deployment Mode
  • Figure 68: Western Europe Market Value Share and BPS Analysis by Organization Size, 2025 and 2035
  • Figure 69: Western Europe Market Y-o-Y Growth Comparison by Organization Size, 2025-2035
  • Figure 70: Western Europe Market Attractiveness Analysis by Organization Size
  • Figure 71: Western Europe Market Value Share and BPS Analysis by Application, 2025 and 2035
  • Figure 72: Western Europe Market Y-o-Y Growth Comparison by Application, 2025-2035
  • Figure 73: Western Europe Market Attractiveness Analysis by Application
  • Figure 74: Western Europe Market Value Share and BPS Analysis by End Use, 2025 and 2035
  • Figure 75: Western Europe Market Y-o-Y Growth Comparison by End Use, 2025-2035
  • Figure 76: Western Europe Market Attractiveness Analysis by End Use
  • Figure 77: Eastern Europe Market Value Share and BPS Analysis by Country, 2025 and 2035
  • Figure 78: Eastern Europe Market Value Share and BPS Analysis by System, 2025 and 2035
  • Figure 79: Eastern Europe Market Y-o-Y Growth Comparison by System, 2025-2035
  • Figure 80: Eastern Europe Market Attractiveness Analysis by System
  • Figure 81: Eastern Europe Market Value Share and BPS Analysis by Deployment Mode, 2025 and 2035
  • Figure 82: Eastern Europe Market Y-o-Y Growth Comparison by Deployment Mode, 2025-2035
  • Figure 83: Eastern Europe Market Attractiveness Analysis by Deployment Mode
  • Figure 84: Eastern Europe Market Value Share and BPS Analysis by Organization Size, 2025 and 2035
  • Figure 85: Eastern Europe Market Y-o-Y Growth Comparison by Organization Size, 2025-2035
  • Figure 86: Eastern Europe Market Attractiveness Analysis by Organization Size
  • Figure 87: Eastern Europe Market Value Share and BPS Analysis by Application, 2025 and 2035
  • Figure 88: Eastern Europe Market Y-o-Y Growth Comparison by Application, 2025-2035
  • Figure 89: Eastern Europe Market Attractiveness Analysis by Application
  • Figure 90: Eastern Europe Market Value Share and BPS Analysis by End Use, 2025 and 2035
  • Figure 91: Eastern Europe Market Y-o-Y Growth Comparison by End Use, 2025-2035
  • Figure 92: Eastern Europe Market Attractiveness Analysis by End Use
  • Figure 93: East Asia Market Value Share and BPS Analysis by Country, 2025 and 2035
  • Figure 94: East Asia Market Value Share and BPS Analysis by System, 2025 and 2035
  • Figure 95: East Asia Market Y-o-Y Growth Comparison by System, 2025-2035
  • Figure 96: East Asia Market Attractiveness Analysis by System
  • Figure 97: East Asia Market Value Share and BPS Analysis by Deployment Mode, 2025 and 2035
  • Figure 98: East Asia Market Y-o-Y Growth Comparison by Deployment Mode, 2025-2035
  • Figure 99: East Asia Market Attractiveness Analysis by Deployment Mode
  • Figure 100: East Asia Market Value Share and BPS Analysis by Organization Size, 2025 and 2035
  • Figure 101: East Asia Market Y-o-Y Growth Comparison by Organization Size, 2025-2035
  • Figure 102: East Asia Market Attractiveness Analysis by Organization Size
  • Figure 103: East Asia Market Value Share and BPS Analysis by Application, 2025 and 2035
  • Figure 104: East Asia Market Y-o-Y Growth Comparison by Application, 2025-2035
  • Figure 105: East Asia Market Attractiveness Analysis by Application
  • Figure 106: East Asia Market Value Share and BPS Analysis by End Use, 2025 and 2035
  • Figure 107: East Asia Market Y-o-Y Growth Comparison by End Use, 2025-2035
  • Figure 108: East Asia Market Attractiveness Analysis by End Use
  • Figure 109: South Asia & Pacific Market Value Share and BPS Analysis by Country, 2025 and 2035
  • Figure 110: South Asia & Pacific Market Value Share and BPS Analysis by System, 2025 and 2035
  • Figure 111: South Asia & Pacific Market Y-o-Y Growth Comparison by System, 2025-2035
  • Figure 112: South Asia & Pacific Market Attractiveness Analysis by System
  • Figure 113: South Asia & Pacific Market Value Share and BPS Analysis by Deployment Mode, 2025 and 2035
  • Figure 114: South Asia & Pacific Market Y-o-Y Growth Comparison by Deployment Mode, 2025-2035
  • Figure 115: South Asia & Pacific Market Attractiveness Analysis by Deployment Mode
  • Figure 116: South Asia & Pacific Market Value Share and BPS Analysis by Organization Size, 2025 and 2035
  • Figure 117: South Asia & Pacific Market Y-o-Y Growth Comparison by Organization Size, 2025-2035
  • Figure 118: South Asia & Pacific Market Attractiveness Analysis by Organization Size
  • Figure 119: South Asia & Pacific Market Value Share and BPS Analysis by Application, 2025 and 2035
  • Figure 120: South Asia & Pacific Market Y-o-Y Growth Comparison by Application, 2025-2035
  • Figure 121: South Asia & Pacific Market Attractiveness Analysis by Application
  • Figure 122: South Asia & Pacific Market Value Share and BPS Analysis by End Use, 2025 and 2035
  • Figure 123: South Asia & Pacific Market Y-o-Y Growth Comparison by End Use, 2025-2035
  • Figure 124: South Asia & Pacific Market Attractiveness Analysis by End Use
  • Figure 125: Middle East and Africa Market Value Share and BPS Analysis by Country, 2025 and 2035
  • Figure 126: Middle East and Africa Market Value Share and BPS Analysis by System, 2025 and 2035
  • Figure 127: Middle East and Africa Market Y-o-Y Growth Comparison by System, 2025-2035
  • Figure 128: Middle East and Africa Market Attractiveness Analysis by System
  • Figure 129: Middle East and Africa Market Value Share and BPS Analysis by Deployment Mode, 2025 and 2035
  • Figure 130: Middle East and Africa Market Y-o-Y Growth Comparison by Deployment Mode, 2025-2035
  • Figure 131: Middle East and Africa Market Attractiveness Analysis by Deployment Mode
  • Figure 132: Middle East and Africa Market Value Share and BPS Analysis by Organization Size, 2025 and 2035
  • Figure 133: Middle East and Africa Market Y-o-Y Growth Comparison by Organization Size, 2025-2035
  • Figure 134: Middle East and Africa Market Attractiveness Analysis by Organization Size
  • Figure 135: Middle East and Africa Market Value Share and BPS Analysis by Application, 2025 and 2035
  • Figure 136: Middle East and Africa Market Y-o-Y Growth Comparison by Application, 2025-2035
  • Figure 137: Middle East and Africa Market Attractiveness Analysis by Application
  • Figure 138: Middle East and Africa Market Value Share and BPS Analysis by End Use, 2025 and 2035
  • Figure 139: Middle East and Africa Market Y-o-Y Growth Comparison by End Use, 2025-2035
  • Figure 140: Middle East and Africa Market Attractiveness Analysis by End Use
  • Figure 141: Global Market - Tier Structure Analysis
  • Figure 142: Global Market - Company Share Analysis

Frequently Asked Questions

What is the market size of the air freight forwarding system market in 2025?

The market size is valued at USD 9.2 billion in 2025.

How much will the air freight forwarding system market reach by 2035?

It is projected to reach USD 13.8 billion by 2035.

What is the forecast CAGR for the air freight forwarding system market from 2025 to 2035?

The market is expected to grow at a CAGR of 4.2% during 2025-2035.

Which system type holds the largest share in the air freight forwarding system market?

Transportation Management System (TMS) holds the largest share with 45% in 2025.

Who is the leading player in the air freight forwarding system market?

DHL Global Forwarding is the leading player with 22% share.

Explore Similar Insights

Future Market Insights

Air Freight Forwarding System Market