The ammonia cracking membrane reactor market is anticipated to grow from an estimated USD 257.7 million in 2025 to USD 1,663.1 million by 2035, representing a robust CAGR of 20.5%. This indicates strong industry momentum driven by global energy transition trends, demand for clean hydrogen production, and advances in membrane reactor technology. Over the decade, the market value is set to increase by USD 1,405.4 million, reflecting accelerated adoption in industrial hydrogen generation and ammonia decomposition processes. The CAGR figure highlights the exceptionally rapid growth expected in this sector, positioning it as one of the fastest-growing segments in advanced chemical engineering markets.
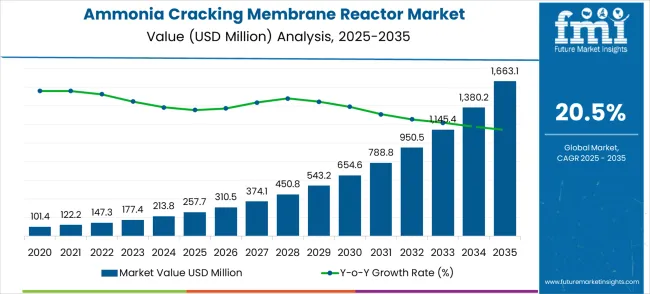
Year-on-year (YoY) analysis shows substantial growth acceleration in the early years. From USD 257.7 million in 2025, the market grows to USD 310.5 million in 2026, representing a 20.6% YoY increase, followed by USD 374.1 million in 2027, a 20.5% growth from the previous year. Growth continues to be strong, with annual increases exceeding 20% until 2028, when the market reaches USD 450.8 million. This period reflects strong expansion due to the scaling of pilot projects, investments in green ammonia infrastructure, and increasing regulatory support for clean energy technologies.
| Metric | Value |
|---|---|
| Estimated Value in (2025E) | USD 257.7 million |
| Forecast Value in (2035F) | USD 1,663.1 million |
| Forecast CAGR (2025 to 2035) | 20.5% |
Mid-period growth shows slight variation but remains high, with the market expanding to USD 543.2 million in 2029 and USD 654.6 million in 2030, corresponding to 20.6% and 20.5% YoY growth rates respectively. This consistency indicates low volatility and strong market stability, driven by steady technology adoption and industrial-scale implementation. Years such as 2033 to 2035 show slightly higher increments, with the market surging to USD 1,380.2 million in 2034 and ultimately USD 1,663.1 million in 2035. This reflects an acceleration phase where large-scale commercial adoption and advancements in reactor efficiency boost growth rates.
The average YoY growth rate across the decade stands at approximately 20.5%, matching the CAGR and reinforcing the steady, high-growth character of this market. Despite some minor annual fluctuations, the growth remains consistently above 20% throughout, demonstrating resilience against economic or supply chain variability. The market exhibits a strong upward trend with no periods of stagnation or decline. This reflects a combination of strong demand drivers, including the hydrogen economy and technological breakthroughs, which collectively ensure that the market will experience high growth through 2035.
Market expansion is being supported by the exponential growth of hydrogen economy initiatives and the corresponding demand for efficient hydrogen production technologies that can help maritime fuel applications, industrial hydrogen generation, and renewable energy storage systems. Modern energy operators are increasingly focused on ammonia-based solutions that provide safe hydrogen storage and transportation while enabling on-demand hydrogen production for various applications. Ammonia cracking membrane reactors' proven ability to deliver high-purity hydrogen, operational efficiency, and system integration makes them essential technologies for clean energy transition.
The growing focus on maritime decarbonization and international shipping emission reduction is driving demand for ammonia fuel systems that can support zero-emission vessel operations and comply with environmental regulations. Energy preference for technologies that combine ammonia storage advantages with hydrogen utilization benefits is creating opportunities for innovative membrane reactor implementations. The rising influence of government hydrogen strategies and clean energy investment programs is also contributing to increased adoption of ammonia cracking reactors that can provide scalable hydrogen production and support renewable energy integration.
The ammonia cracking membrane reactor market represents a pivotal technology enabling the hydrogen economy transition, with the market projected to expand from USD 257.7 million in 2025 to USD 1,663.1 million by 2035 at a robust 20.5% CAGR, a 6.5X growth trajectory. This expansion is driven by the convergence of maritime decarbonization mandates, hydrogen economy acceleration, and the critical need for safe, efficient hydrogen storage and transportation solutions using ammonia as a carrier.
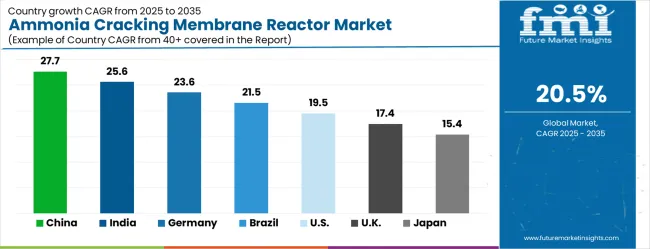
The technology addresses fundamental challenges in hydrogen logistics-ammonia can be stored and transported at much lower pressures than hydrogen gas, then cracked on demand to produce high-purity hydrogen for fuel cells and industrial applications. Maritime applications lead adoption due to International Maritime Organization emissions regulations and the shipping industry's urgent need for zero-carbon fuels. Geographic opportunities are particularly strong in China (27.7% CAGR) and India (25.6% CAGR), where massive hydrogen economy investments and renewable energy expansion create ideal market conditions.
Pathway A - Maritime Decarbonization Leadership. International shipping faces mandatory emission reductions, creating urgent demand for ammonia fuel systems with onboard cracking capabilities. Providers developing marine-grade reactors with proven reliability, safety certifications, and integration with ship power systems will capture this dominant application segment. Expected revenue pool: USD 600-900 million.
Pathway B - Metal Membrane Technology Advancement. Metal membranes offer superior hydrogen selectivity, high-temperature stability, and durability essential for industrial applications. Companies developing next-generation metal membrane materials with enhanced permeability, extended lifespans, and reduced manufacturing costs will command technology leadership and premium pricing. Opportunity: USD 500-750 million.
Pathway C - Integrated Ammonia-to-Hydrogen Systems. Complete solutions combining ammonia storage, cracking reactors, and hydrogen purification systems offer turnkey capabilities for end users. Integrated systems with optimized heat management, automated controls, and modular scalability address operational complexity while maximizing efficiency. Revenue uplift: USD 400-600 million.
Pathway D - Geographic Expansion in High-Growth Markets. China's hydrogen economy investments and India's renewable energy expansion create substantial opportunities for reactor deployment across industrial facilities, ports, and transportation hubs. Strategic partnerships with local energy companies and government relationships enable market penetration. Pool: USD 700-1,000 million.
Pathway E - Automotive and Transportation Applications. Heavy-duty vehicles, buses, and trains require hydrogen fuel systems where ammonia cracking enables practical hydrogen storage and distribution. Developing compact, fast-response reactors for mobile applications opens new market segments beyond maritime use. Expected upside: USD 300-500 million.
Pathway F - Industrial Hydrogen Generation Plants. Large-scale industrial facilities require continuous hydrogen supply for chemical processes, steel production, and refining operations. Centralized ammonia cracking systems offering economies of scale, grid integration, and renewable energy coupling serve this growing demand. USD 400-650 million.
Pathway G - Advanced Membrane Materials and Non-Metal Technologies. Ceramic and polymeric membranes offer potential cost advantages and specific performance characteristics for niche applications. Companies developing breakthrough non-metal membrane technologies with competitive performance profiles can capture specialized market segments. Pool: USD 200-350 million.
Pathway H - Renewable Energy Integration and Grid Services. Ammonia cracking systems coupled with renewable energy sources enable load balancing, energy storage, and grid stabilization services. Multi-revenue stream models combining hydrogen production with grid services create additional value propositions for energy operators. Expected revenue: USD 250-400 million.
The market is segmented by membrane technology and application. By membrane technology, the market is divided into metal membrane technology and non-metal membrane technology. Based on application, the market is categorized into ships, automobiles, hydrogen generation plants, and others.
The metal membrane technology segment is projected to account 70.0% share for the market in 2025, reaffirming its position as the leading membrane technology category. Metal membrane systems increasingly attract energy operators for their superior hydrogen selectivity characteristics, high-temperature stability, and suitability for industrial-scale ammonia cracking applications. Metal membranes' durability and proven performance directly address the operational and reliability requirements for commercial hydrogen production systems across various energy applications.
This technology segment forms the foundation of ammonia cracking adoption, as it represents the membrane category with the greatest appeal for large-scale hydrogen production requiring consistent performance and long-term operational stability. Energy investments in reliable hydrogen production technologies and industrial-scale deployment strategies continue to strengthen adoption among metal membrane reactor users. With operators prioritizing proven performance and operational reliability, metal membrane technology aligns with both efficiency requirements and durability standards, making it the central component of ammonia cracking membrane reactor market growth strategies.
Ships are projected to accounts for 43.0% share in application segment of ammonia cracking membrane reactor demand in 2025, underscoring their critical role in driving market growth and technology adoption. Maritime applications prefer ammonia cracking systems for their fuel flexibility, emission reduction capabilities, and ability to support long-distance shipping operations while meeting environmental regulations. Positioned as essential decarbonization technology for international shipping, ammonia cracking reactors offer both operational advantages and environmental compliance benefits for maritime fuel applications.
The segment is supported by continuous expansion in maritime decarbonization requirements and the growing recognition of ammonia fuel benefits that enable zero-emission shipping and regulatory compliance. Reactor manufacturers are investing in marine-specific solutions to support vessel fuel systems and maritime operational requirements. As the shipping industry becomes more environmentally regulated and carbon-neutral focused, ships will continue to dominate ammonia cracking reactor utilization while supporting market expansion and maritime decarbonization initiatives.
The market is advancing rapidly due to accelerating hydrogen economy development and increasing demand for clean fuel technologies that support maritime decarbonization. The market faces challenges, including high technology development costs, technical complexities associated with membrane durability and selectivity, and infrastructure requirements for ammonia supply chain development. Innovation in membrane materials and reactor design continues to influence market development and commercial deployment patterns.
The expanding maritime decarbonization initiatives and advancing hydrogen economy strategies are enabling ammonia cracking reactors to support revolutionary fuel applications where conventional marine fuels cannot meet environmental regulations and emission reduction requirements. Hydrogen economy development provides enhanced market opportunities while allowing clean fuel solutions across various transportation and industrial applications. Organizations are increasingly recognizing the competitive advantages of ammonia-based hydrogen production for green energy transition and carbon neutrality goals.
Modern ammonia cracking membrane reactor providers are incorporating advanced membrane materials and system optimization technologies to enhance reactor appeal and address operator concerns about efficiency, durability, and operational costs. These technological enhancements improve reactor value while enabling new market segments, including integrated energy systems and renewable energy-coupled hydrogen production requiring enhanced performance and reliability capabilities. Advanced technology integration also allows ammonia cracking systems to differentiate from conventional hydrogen production methods while supporting scalable clean energy applications and industrial integration.
| Country | CAGR (2025-2035) |
|---|---|
| China | 27.7% |
| India | 25.6% |
| Germany | 23.6% |
| Brazil | 21.5% |
| U.S. | 19.5% |
| U.K. | 17.4% |
| Japan | 15.4% |
The market is experiencing extraordinary growth globally, with China leading at a 27.7% CAGR through 2035, driven by massive hydrogen economy investments, comprehensive maritime decarbonization programs, and extensive government support for clean energy technology development. India follows closely at 25.6%, supported by expanding renewable energy initiatives, increasing focus on hydrogen production capabilities, and growing investments in clean fuel technology development. Germany shows exceptional growth at 23.6%, prioritizing advanced engineering capabilities and comprehensive hydrogen strategy implementation. Brazil records 21.5%, focusing on green energy development and maritime industry modernization initiatives. The United States shows 19.5% growth, prioritizing clean energy technology leadership and comprehensive hydrogen infrastructure development. The United Kingdom demonstrates 17.4% growth, supported by maritime decarbonization leadership and advanced energy technology programs. Japan shows 15.4% growth, focusing precision technology development and clean energy integration.
The report covers an in-depth analysis of 40+ countries; top-performing countries are highlighted below.
China is projected to exhibit exceptional growth with a CAGR of 27.7% through 2035, driven by massive government investments in hydrogen economy development and advancing clean energy technology programs requiring comprehensive ammonia-based fuel systems. The country's leadership in renewable energy infrastructure and strong commitment to carbon neutrality goals are creating unprecedented demand for sophisticated ammonia cracking technologies. Major domestic and international energy technology companies are establishing comprehensive reactor development and manufacturing capabilities to serve both domestic hydrogen markets and global clean energy export opportunities.
India is expanding at a CAGR of 25.6%, supported by the rapidly developing renewable energy sector, expanding hydrogen production initiatives, and increasing government focus on clean fuel technology development. The country's growing industrial base and strong emphasis on energy independence are driving requirements for innovative hydrogen production solutions. International energy technology companies and domestic manufacturers are establishing comprehensive development and production capabilities to address the growing demand for ammonia-based energy systems.
Germany is projected to grow at a CAGR of 23.6% through 2035, emphasizing advanced engineering capabilities and comprehensive hydrogen strategy implementation within Europe's leading clean energy technology hub. The country's established chemical engineering industry and commitment to energy transition are driving sophisticated membrane reactor requirements. German energy companies and technology developers consistently demand high-precision reactor systems that meet stringent efficiency standards and provide superior integration capabilities with renewable energy infrastructure.
Brazil is expanding at a CAGR of 21.5% through 2035, focusing on green energy development and maritime industry modernization initiatives across Latin America's largest energy market. Brazilian organizations value innovative clean energy solutions, operational reliability, and proven performance characteristics, positioning ammonia cracking membrane reactors as essential components for future hydrogen economy applications. The country's expanding renewable energy capacity and increasing focus on energy diversification are creating steady demand for advanced hydrogen production technologies.
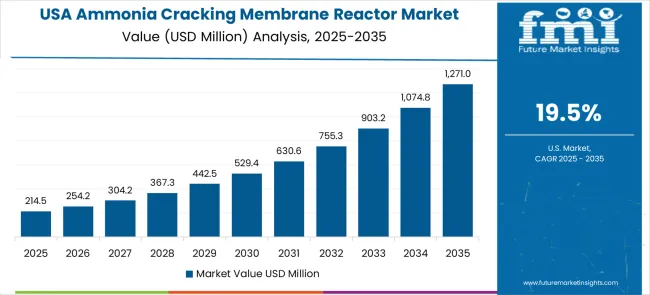
The United States is projected to grow at a CAGR of 19.5% through 2035, driven by clean energy technology leadership, comprehensive hydrogen infrastructure development programs, and established regulatory frameworks supporting emerging energy technologies. American companies prioritize technological innovation, operational efficiency, and regulatory compliance, making ammonia cracking membrane reactors a strategic choice for hydrogen production applications. The market benefits from established energy infrastructure and sophisticated technology requirements.
The United Kingdom is expanding at a CAGR of 17.4% through 2035, supported by maritime decarbonization leadership, established energy technology expertise, and growing commitment to net-zero emissions goals and clean fuel development. British organizations value regulatory compliance, technological sophistication, and operational reliability, positioning ammonia cracking membrane reactors as essential technology for future maritime and industrial applications.
Japan is projected to grow at a CAGR of 15.4% through 2035, prioritizing precision technology development, advanced quality control standards, and comprehensive clean energy integration aligned with Japanese industrial excellence. Japanese organizations prioritize technological precision, operational reliability, and long-term performance, making ammonia cracking membrane reactors a strategic choice for advanced hydrogen production applications. The market is supported by sophisticated industrial infrastructure and established chemical engineering expertise.
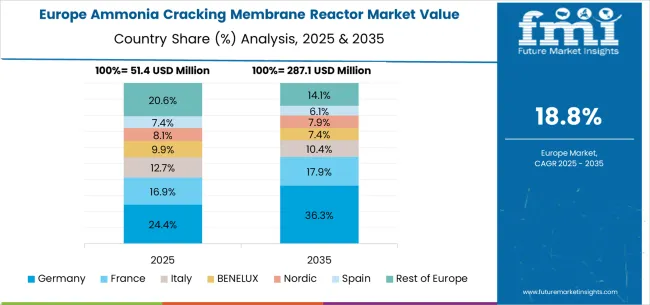
The ammonia cracking membrane reactor market in Europe is projected to grow from USD 67.3 million in 2025 to USD 456.8 million by 2035, registering a CAGR of 21.3% over the forecast period. Germany is expected to maintain its leadership position with a 34.6% market share in 2025, projected to reach 35.9% by 2035, supported by its advanced chemical engineering capabilities and comprehensive hydrogen strategy implementation, including major initiatives in Hamburg, Bremen, and other industrial centers.
The United Kingdom follows with a 23.7% share in 2025, projected to reach 24.2% by 2035, driven by comprehensive maritime decarbonization leadership and advanced clean energy technology development programs in major shipping and industrial centers. France holds an 18.4% share in 2025, expected to reach 18.8% by 2035 due to expanding hydrogen economy initiatives and clean fuel technology development programs. Italy commands a 12.1% share, while Spain accounts for 7.8% in 2025. The Rest of Europe region is anticipated to gain momentum, expanding its collective share from 3.4% to 3.7% by 2035, attributed to increasing ammonia cracking adoption in Nordic countries and emerging Eastern European markets implementing clean energy technology development programs.
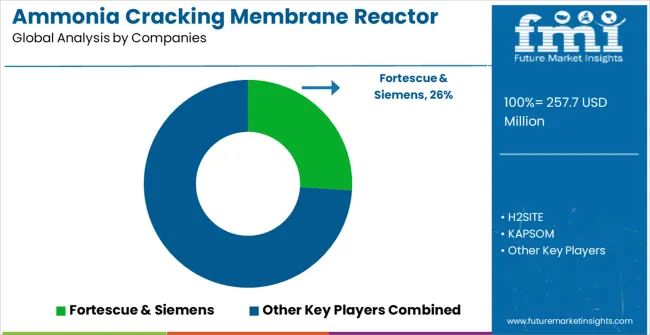
The market is characterized by competition among established energy technology companies, specialized membrane technology providers, and emerging clean fuel technology developers. Companies are investing in advanced membrane material development, reactor system optimization, hydrogen purity enhancement, and comprehensive ammonia-to-hydrogen solutions to deliver efficient, reliable, and commercially viable ammonia cracking systems. Innovation in membrane selectivity, temperature resistance, and integrated system design is central to strengthening market position and technology leadership.
Fortescue & Siemens lead the market through a strategic partnership, offering comprehensive ammonia cracking solutions with a focus on large-scale hydrogen production and industrial application expertise. H2SITE provides specialized membrane reactor technology with focus on modular system design and operational flexibility for various applications. KAPSOM delivers advanced membrane solutions with a focus on high-efficiency hydrogen production and system integration capabilities. Topsoe focuses on catalyst and reactor technology with emphasis on industrial-scale ammonia processing and chemical engineering expertise.
MHI&NGK specializes in heavy industry applications and advanced reactor systems with focus on reliability and performance optimization for large-scale operations. These companies are establishing comprehensive technology development programs and building strategic partnerships to support the emerging ammonia-based hydrogen economy and clean fuel market development.
| Items | Values |
|---|---|
| Quantitative Units (2025) | USD 257.7 million |
| Membrane Technology | Metal Membrane Technology, Non-metal Membrane Technology |
| Application | Ship, Automobile, Hydrogen Generation Plant, Others |
| Regions Covered | North America, Latin America, Western Europe, Eastern Europe, East Asia, South Asia & Pacific, Middle East & Africa |
| Countries Covered | United States, Canada, United Kingdom, Germany, France, China, Japan, South Korea, Brazil, Australia and 40+ countries |
| Key Companies Profiled | Fortescue & Siemens, H2SITE, KAPSOM, Topsoe, MHI&NGK |
| Additional Attributes | Dollar sales by membrane technology and application, regional demand trends, competitive landscape, operator preferences for metal versus non-metal membrane systems, integration with ammonia supply chains and hydrogen distribution networks, innovations in membrane selectivity and reactor efficiency for diverse clean energy applications |
North America
Latin America
Western Europe
Eastern Europe
East Asia
South Asia & Pacific
Middle East & Africa
The global bonding honeycomb vibration isolation platform market is estimated to be valued at USD 468.7 million in 2025.
The market size for the bonding honeycomb vibration isolation platform market is projected to reach USD 714.1 million by 2035.
The bonding honeycomb vibration isolation platform market is expected to grow at a 4.3% CAGR between 2025 and 2035.
The key product types in bonding honeycomb vibration isolation platform market are air spring vibration isolation and vibration isolation rubber vibration isolation.
In terms of application, precision instrument production and testing segment to command 48.6% share in the bonding honeycomb vibration isolation platform market in 2025.


Our Research Products

The "Full Research Suite" delivers actionable market intel, deep dives on markets or technologies, so clients act faster, cut risk, and unlock growth.

The Leaderboard benchmarks and ranks top vendors, classifying them as Established Leaders, Leading Challengers, or Disruptors & Challengers.

Locates where complements amplify value and substitutes erode it, forecasting net impact by horizon

We deliver granular, decision-grade intel: market sizing, 5-year forecasts, pricing, adoption, usage, revenue, and operational KPIs—plus competitor tracking, regulation, and value chains—across 60 countries broadly.

Spot the shifts before they hit your P&L. We track inflection points, adoption curves, pricing moves, and ecosystem plays to show where demand is heading, why it is changing, and what to do next across high-growth markets and disruptive tech

Real-time reads of user behavior. We track shifting priorities, perceptions of today’s and next-gen services, and provider experience, then pace how fast tech moves from trial to adoption, blending buyer, consumer, and channel inputs with social signals (#WhySwitch, #UX).

Partner with our analyst team to build a custom report designed around your business priorities. From analysing market trends to assessing competitors or crafting bespoke datasets, we tailor insights to your needs.
Supplier Intelligence
Discovery & Profiling
Capacity & Footprint
Performance & Risk
Compliance & Governance
Commercial Readiness
Who Supplies Whom
Scorecards & Shortlists
Playbooks & Docs
Category Intelligence
Definition & Scope
Demand & Use Cases
Cost Drivers
Market Structure
Supply Chain Map
Trade & Policy
Operating Norms
Deliverables
Buyer Intelligence
Account Basics
Spend & Scope
Procurement Model
Vendor Requirements
Terms & Policies
Entry Strategy
Pain Points & Triggers
Outputs
Pricing Analysis
Benchmarks
Trends
Should-Cost
Indexation
Landed Cost
Commercial Terms
Deliverables
Brand Analysis
Positioning & Value Prop
Share & Presence
Customer Evidence
Go-to-Market
Digital & Reputation
Compliance & Trust
KPIs & Gaps
Outputs
Full Research Suite comprises of:
Market outlook & trends analysis
Interviews & case studies
Strategic recommendations
Vendor profiles & capabilities analysis
5-year forecasts
8 regions and 60+ country-level data splits
Market segment data splits
12 months of continuous data updates
DELIVERED AS:
PDF EXCEL ONLINE
Ammonia Online Detection System Market Size and Share Forecast Outlook 2025 to 2035
Ammonia Testing Market
Green Ammonia Market Size and Share Forecast Outlook 2025 to 2035
Metal Membrane Ammonia Cracker Market Size and Share Forecast Outlook 2025 to 2035
Membrane Separation Ammonia Cracker Market Size and Share Forecast Outlook 2025 to 2035
Heavy Oil Cracking Catalyst Market Size and Share Forecast Outlook 2025 to 2035
Fluid Catalytic Cracking Catalysts Market
Reactor Active Zone Device Market Size and Share Forecast Outlook 2025 to 2035
Glass Reactor Market Size and Share Forecast Outlook 2025 to 2035
Shunt Reactor Market Growth – Trends & Forecast 2020 to 2030
Chemical Reactors Market
Cellbag Bioreactor Chambers Market Size and Share Forecast Outlook 2025 to 2035
Airlift Bioreactors Market - Growth & Forecast 2025 to 2035
Rocking Bioreactors Market
Fixed Shunt Reactor Market Size and Share Forecast Outlook 2025 to 2035
Microbial Bioreactors Market
Single-use Bioreactors Market Size and Share Forecast Outlook 2025 to 2035
Variable Shunt Reactor Market Size and Share Forecast Outlook 2025 to 2035
Small-Scale Bioreactors Market Analysis by Product, Capacity, End-User, and Region through 2035
Pressurized Water Reactor System Market Size and Share Forecast Outlook 2025 to 2035

Thank you!
You will receive an email from our Business Development Manager. Please be sure to check your SPAM/JUNK folder too.
Chat With
MaRIA