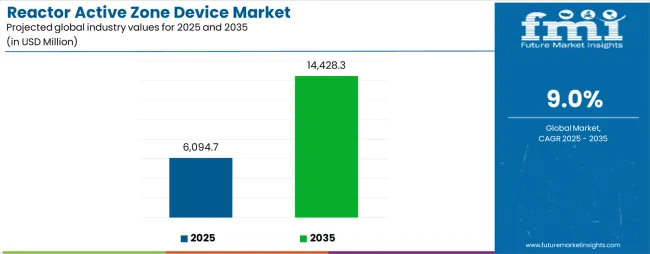
The reactor active zone device market is experiencing significant growth, projected to expand from USD 6,094.7 million in 2025 to USD 14,428.3 million by 2035, with a forecasted CAGR of 9%. This growth can be attributed to several key industry drivers, such as the increasing demand for more efficient and safe reactor operations. As industries like nuclear power, chemical manufacturing, and industrial processing focus on improving efficiency, the adoption of reactor active zone devices becomes crucial. These devices help optimize reactor performance by precisely controlling parameters within the active zone, which leads to enhanced productivity and safety. Additionally, regulations and safety protocols in industries dealing with high-risk processes have become stricter, contributing to the increased need for such devices.
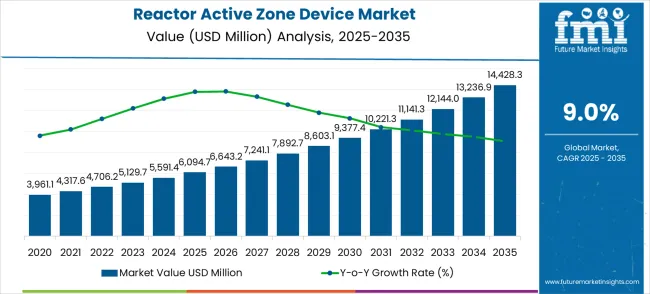
Another driver fueling the growth of the reactor active zone device market is the rising emphasis on process automation and real-time monitoring in industrial settings.
With growing concerns about minimizing environmental impact and improving safety, industries are focusing on precision control systems that can monitor, adjust, and manage reactor conditions with minimal human intervention. The increasing adoption of automation technologies within industrial plants is expected to accelerate the demand for these devices further. As companies strive for operational excellence, reactor active zone devices are seen as essential to meet new industry standards, offering better control, reduced downtime, and compliance with stringent regulations.
The reactor active zone device market holds around 7% of the share in the nuclear power generation market, driven by the increasing need for precise control and monitoring of reactor environments to ensure efficiency and safety. In the industrial automation market, it captures about 5%, as automation systems are integrated with reactor control mechanisms for enhanced performance.
Within the energy control systems market, it accounts for approximately 6%, as these devices are crucial in maintaining stable energy production. The chemical processing equipment market sees about 4%, reflecting the role of reactor devices in specialized industrial processes. In the energy infrastructure market, the market share is about 3%, as reactor active zone devices support the broader infrastructure needed to sustain energy systems. These figures demonstrate the growing reliance on advanced reactor devices across various sectors to ensure the optimal functioning and safety of energy production systems.
| Metric | Value |
|---|---|
| Market Value (2025) | USD 6,094.7 million |
| Market Forecast Value (2035) | USD 14,428.3 million |
| Market Forecast CAGR | 9.0% |
Market expansion is being supported by the rapid increase in nuclear power plant construction worldwide and the corresponding need for advanced reactor core components that provide enhanced neutron efficiency and superior safety characteristics in next-generation nuclear facilities. Modern nuclear power plants rely on sophisticated active zone devices to deliver optimal nuclear chain reactions and comprehensive reactor control including pressurized water reactors, boiling water reactors, and advanced small modular reactor systems. Even minor reactor core inefficiencies can require comprehensive nuclear fuel cycle adjustments to maintain optimal power generation and safety standards.
The growing complexity of nuclear safety requirements and increasing demand for enhanced reactor performance solutions are driving demand for reactor active zone devices from certified nuclear manufacturers with appropriate nuclear-grade capabilities and regulatory expertise. Nuclear utilities and government nuclear agencies are increasingly requiring documented performance reliability and comprehensive safety validation to maintain operational safety and regulatory compliance. Industry specifications and nuclear regulations are establishing standardized reactor core procedures that require specialized nuclear technologies and licensed nuclear engineers.
The market is entering a new phase of substantial growth, driven by demand for clean energy, advancements in nuclear technology, and evolving carbon reduction standards. By 2035, these pathways together can unlock USD 2.5-3.2 billion in incremental revenue opportunities beyond baseline growth.
Pathway A -- Advanced Reactor Technology Leadership (Generation IV Systems) Next-generation reactor technologies offer enhanced safety and efficiency. Developing active zone devices for Generation IV reactors, including high-temperature gas reactors and molten salt reactors, can capture premium positioning. Opportunity pool: USD 700-900 million.
Pathway B -- Small Modular Reactor Expansion (SMR Deployments) SMRs represent the fastest-growing nuclear segment due to their scalability and enhanced safety. Active zone devices, optimized for modular reactor systems, offer significant growth potential. Opportunity pool: USD 600-800 million.
Pathway C -- Nuclear Renaissance Programs (New Plant Construction) Global nuclear expansion, especially in emerging economies, drives demand for reactor components. Targeting new nuclear construction projects and plant modernization initiatives offers substantial opportunities. Opportunity pool: USD 500-650 million.
Pathway D -- Military and Naval Applications (Defense Propulsion) Naval nuclear propulsion and military research reactors require specialized components for their active zones. Enhanced solutions for defense applications create high-value market segments. Opportunity pool: USD 350-450 million.
Pathway E -- Research Reactor Modernization (Scientific Applications) Universities and research institutions require updated reactor components for materials testing and isotope production. Specialized research reactor solutions offer niche growth opportunities. Opportunity pool: USD 250-320 million.
Pathway F -- Advanced Fuel Cycle Integration (Recycling & Reprocessing) Closed fuel cycle technologies require specialized active zone designs for mixed oxide fuels and recycled materials. Advanced fuel cycle solutions create new market segments. Opportunity pool: USD 200-280 million.
Pathway G -- Digital Twin and IoT Integration (Smart Reactor Systems) Advanced monitoring and predictive maintenance capabilities enhance reactor performance. Digital integration and smart reactor technologies offer premium positioning opportunities. Opportunity pool: USD 150-200 million.
Pathway H -- Emerging Market Nuclear Programs Developing countries expanding nuclear programs require cost-effective solutions. Tailored active zone devices for emerging markets create volume growth potential. Opportunity pool: USD 100-150 million.
The market is segmented by product type, application, and region. By product type, the market is divided into enriched uranium dioxide, natural uranium dioxide, and others. Based on application, the market is categorized into nuclear energy and military industry. Regionally, the market is divided into North America, Europe, East Asia, South Asia & Pacific, Latin America, and Middle East & Africa.
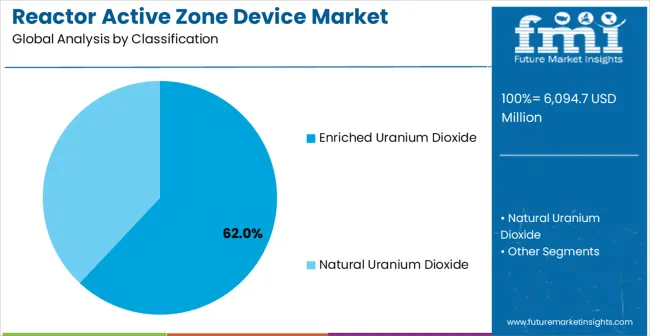
In 2025, the enriched uranium dioxide segment is projected to capture around 62% of the total market share, making it the leading product category. This dominance is largely driven by the widespread adoption of enriched uranium fuel systems that provide superior neutron economy and enhanced reactor performance characteristics, catering to a wide variety of commercial nuclear power applications. Enriched uranium dioxide technology is particularly favored for its ability to sustain controlled nuclear chain reactions with optimal fuel utilization while ensuring operational safety and regulatory compliance. Commercial nuclear utilities, research reactor operators, naval propulsion programs, and advanced reactor developers increasingly prefer enriched uranium dioxide, as it meets stringent nuclear performance requirements without imposing excessive enrichment costs or complex fuel handling procedures.
The availability of well-established uranium enrichment facilities, along with comprehensive fuel fabrication capabilities and technical support from leading nuclear fuel manufacturers, further reinforces the segment's market position. Additionally, this product category benefits from consistent demand across regions, as it is considered a practical high-performance solution for nuclear facilities requiring efficient fissile material utilization. The combination of proven nuclear performance, operational efficiency, and regulatory acceptance makes enriched uranium dioxide reactor fuel a preferred choice, ensuring their continued popularity in the nuclear power generation market.
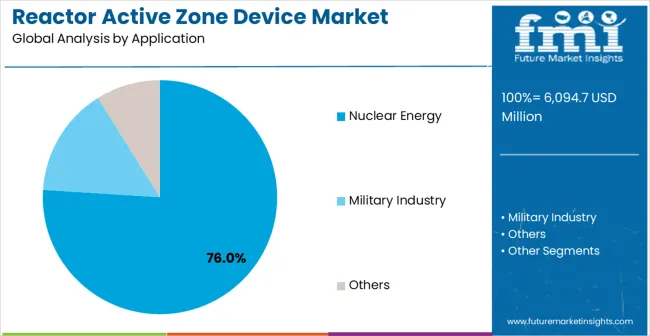
The nuclear energy segment is expected to represent 76% of reactor active zone device demand in 2025, highlighting its position as the most significant application sector. This dominance stems from the unique operational needs of commercial nuclear power generation, where reliable reactor core performance and sustained power output are critical to grid stability and energy security. Nuclear power facilities often feature complex reactor systems that require continuous operation throughout extended fuel cycles, demanding reliable and high-performance active zone components. Reactor active zone devices are particularly well-suited to these environments due to their ability to maintain consistent nuclear chain reactions with optimal neutron utilization, even during load-following operations and power level adjustments.
As countries globally accelerate nuclear power expansion and emphasize clean energy transition initiatives, the demand for advanced reactor active zone systems continues to rise. The segment also benefits from increased investment in nuclear power plant construction programs, where utilities are increasingly prioritizing reactor efficiency and operational reliability as essential performance metrics. With nuclear operators investing in advanced reactor technologies and power generation enhancement, reactor active zone devices provide an essential solution to deliver superior nuclear performance. The growth of advanced reactor designs, small modular reactor deployments, and nuclear renaissance programs, coupled with increased focus on carbon-free energy generation, ensures that nuclear energy will remain the largest and most stable demand driver for reactor active zone devices in the forecast period.
The Reactor Active Zone Device market is advancing steadily due to increasing nuclear power plant construction and growing recognition of nuclear energy advantages in carbon-free electricity generation over fossil fuel approaches. However, the market faces challenges including stringent nuclear regulatory requirements compared to conventional power equipment, complex nuclear licensing procedures for new reactor designs, and varying nuclear safety regulations across different geographic regions. Performance optimization efforts and nuclear technology advancement programs continue to influence reactor development and market adoption patterns.
The growing development of small modular reactor systems is enabling flexible nuclear deployment with enhanced safety characteristics and simplified construction approaches. Advanced SMR technologies and optimized reactor designs provide superior nuclear performance while maintaining cost-effective deployment capabilities. These technologies are particularly valuable for emerging nuclear markets and remote power applications who require reliable nuclear power that can support diverse energy requirements with enhanced safety features.
Modern reactor active zone device manufacturers are incorporating advanced Generation IV reactor technologies and enhanced safety systems that improve reactor performance and operational capabilities. Integration of passive safety features and advanced materials enables superior nuclear efficiency and comprehensive reactor control capabilities. Advanced Generation IV features support operation in diverse nuclear applications while meeting various safety requirements and regulatory specifications.
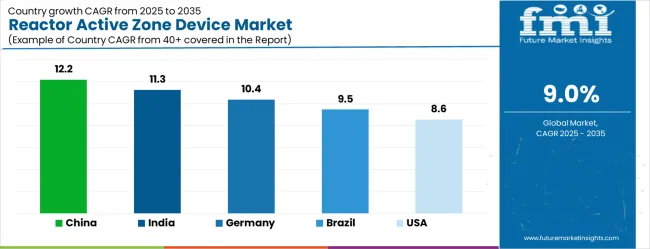
| Country | CAGR (2025-2035) |
|---|---|
| China | 12.2% |
| India | 11.3% |
| Germany | 10.4% |
| Brazil | 9.5% |
| United States | 8.6% |
| United Kingdom | 7.7% |
| Japan | 6.8% |
The reactor active zone device market is experiencing robust growth, with China leading at a 12.2% CAGR through 2035, driven by aggressive nuclear power expansion programs and increasing adoption of advanced reactor technologies across commercial power generation and research applications. India follows at 11.3%, supported by rising nuclear energy development and growing demand for indigenous reactor technology solutions for energy security enhancement. Germany grows strongly at 10.4%, integrating advanced nuclear technology into research reactor applications and international nuclear technology export programs. Brazil records 9.5%, emphasizing nuclear power program expansion and advanced reactor technology development initiatives. The United States shows substantial growth at 8.6%, focusing on nuclear renaissance programs and small modular reactor advancement. The United Kingdom demonstrates steady progress at 7.7%, maintaining established nuclear technology applications and advanced reactor research leadership. Japan records 6.8% growth, concentrating on nuclear safety enhancement and advanced reactor technology development.
The report covers an in-depth analysis of 40+ countries; seven top-performing countries are highlighted below.
The reactor active zone device market in China is projected to exhibit the highest growth rate with a CAGR of 12.2% through 2035, driven by massive nuclear power plant construction programs and increasing demand for advanced reactor components across commercial power generation and research reactor sectors. The country's ambitious nuclear energy expansion and growing domestic nuclear technology capabilities are creating significant demand for sophisticated active zone device systems. Major nuclear equipment manufacturers and reactor developers are establishing comprehensive nuclear component production facilities to support the increasing requirements of nuclear utilities and research institutions across major nuclear development zones.
National nuclear development initiatives are supporting establishment of world-class nuclear manufacturing facilities and reactor technology centers, driving demand for advanced active zone equipment throughout major nuclear industrial parks. Nuclear power expansion programs are facilitating adoption of advanced reactor technologies that enhance power generation capabilities and safety performance across nuclear energy networks.
The reactor active zone device market in India is expanding at a CAGR of 11.3%, supported by increasing nuclear energy program development and growing emphasis on indigenous nuclear technology capabilities for energy security enhancement. The country's expanding nuclear power infrastructure and rising nuclear technology self-reliance standards are driving demand for advanced active zone solutions. Nuclear utilities and research institutions are gradually implementing domestically-produced reactor components to maintain energy independence and technological sovereignty.
Nuclear energy sector growth and indigenous technology development are creating opportunities for equipment suppliers that can support diverse reactor requirements and nuclear program specifications. Professional training and development programs are building technical expertise among nuclear engineers, enabling effective utilization of advanced reactor technology that meets nuclear safety standards and operational requirements.
The reactor active zone device market in Germany is projected to grow at a CAGR of 10.4%, supported by the country's emphasis on nuclear technology research excellence and international nuclear technology leadership. German nuclear technology companies and research institutions are implementing cutting-edge reactor component systems that meet stringent performance requirements and international technical specifications. The market is characterized by focus on nuclear safety innovation, reactor efficiency optimization, and compliance with comprehensive nuclear engineering standards.
Nuclear technology industry investments are prioritizing advanced reactor component technology that demonstrates superior performance and safety while meeting German quality and international nuclear standards. Professional certification programs are ensuring comprehensive technical expertise among nuclear engineers and reactor specialists, enabling specialized nuclear component capabilities that support diverse research applications and international nuclear projects.
The reactor active zone device market in Brazil is growing at a CAGR of 9.5%, driven by increasing nuclear power program development and growing recognition of nuclear energy advantages for energy matrix diversification. The country's expanding nuclear sector is gradually integrating advanced reactor technology to enhance power generation capacity and energy security. Nuclear utilities and government nuclear agencies are investing in reactor active zone technology to address evolving energy demands and environmental commitments.
Nuclear program modernization is facilitating adoption of advanced reactor technologies that support comprehensive nuclear power capabilities across energy regions. Professional development programs are enhancing technical capabilities among nuclear engineers, enabling effective reactor technology utilization that meets evolving nuclear standards and energy requirements.
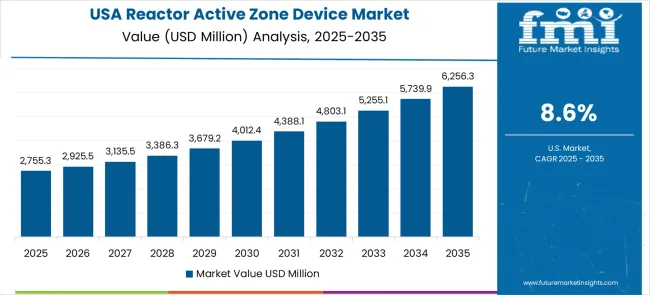
The reactor active zone device market in the U.S. is expanding at a CAGR of 8.6%, driven by established nuclear industry leadership and growing emphasis on nuclear renaissance programs and advanced reactor development. Large nuclear utilities and reactor technology companies are implementing comprehensive reactor active zone capabilities to serve diverse commercial and research nuclear requirements. The market benefits from established nuclear supply chains and professional training programs that support various nuclear power and research applications.
Nuclear industry leadership is enabling standardized reactor component utilization across multiple reactor types, providing consistent performance quality and comprehensive nuclear coverage throughout regional markets. Professional development and certification programs are building specialized nuclear expertise among reactor engineers and nuclear specialists, enabling effective reactor active zone utilization that supports evolving nuclear technology requirements.
The reactor active zone device market in the U.K. is projected to grow at a CAGR of 7.7%, supported by established nuclear technology sectors and growing emphasis on advanced nuclear research capabilities. British nuclear technology companies and research institutions are implementing reactor active zone equipment that meets international nuclear standards and technical requirements. The market benefits from established nuclear infrastructure and comprehensive training programs for nuclear professionals.
Nuclear technology investments are prioritizing advanced reactor component systems that support diverse nuclear applications while maintaining established safety and technical standards. Professional development programs are building nuclear expertise among technology personnel, enabling specialized reactor active zone operation capabilities that meet evolving institutional requirements and nuclear technology standards.
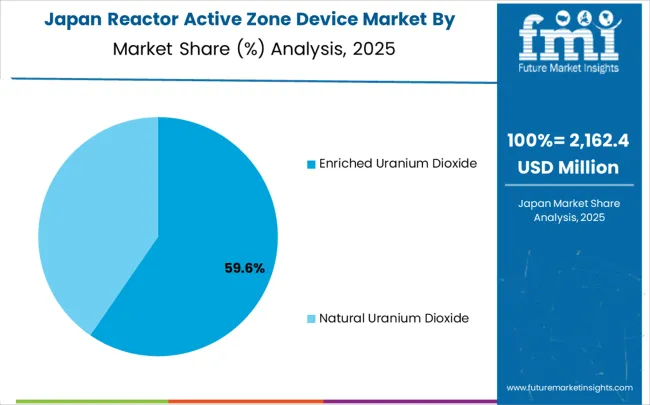
The reactor active zone device market in Japan is growing at a CAGR of 6.8%, driven by the country's focus on nuclear safety technology innovation and advanced reactor safety applications. Japanese nuclear technology companies and utilities are implementing advanced reactor active zone systems that demonstrate superior safety reliability and operational excellence. The market is characterized by emphasis on nuclear safety perfection, reactor performance assurance, and integration with established nuclear safety protocols.
Nuclear technology industry investments are prioritizing innovative reactor solutions that combine advanced active zone technology with enhanced safety engineering while maintaining Japanese nuclear safety and reliability standards. Professional development programs are ensuring comprehensive nuclear expertise among reactor engineers and nuclear safety specialists, enabling specialized reactor safety capabilities that support diverse nuclear applications and safety requirements.
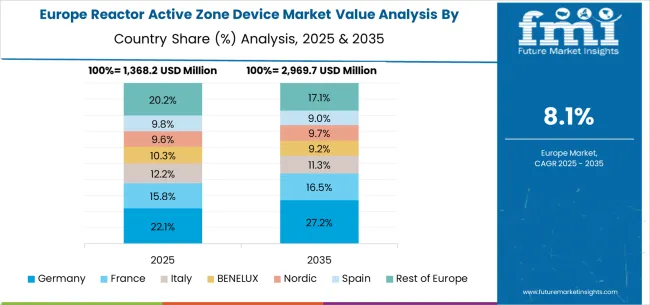
The reactor active zone device market in Europe is forecast to expand from USD 1,593.3 million in 2025 to USD 3,769.3 million by 2035, registering a CAGR of 9.0%. Germany will remain the largest market, holding 32.0% share in 2025, easing to 31.5% by 2035, supported by strong nuclear technology research infrastructure and international nuclear project leadership. The United Kingdom follows, rising from 28.5% in 2025 to 29.0% by 2035, driven by nuclear technology innovation and advanced reactor research programs. France is expected to maintain stability around 24.0%, reflecting steady nuclear power investment patterns. Italy maintains stability at around 8.5%, supported by nuclear research and technology development growth, while Spain grows from 5.0% to 5.5% with expanding nuclear research infrastructure and technology advancement. BENELUX markets ease from 1.8% to 1.7%, while the remainder of Europe hovers near 0.2%-0.3%, balancing emerging Eastern European nuclear development against mature Nordic nuclear technology markets.
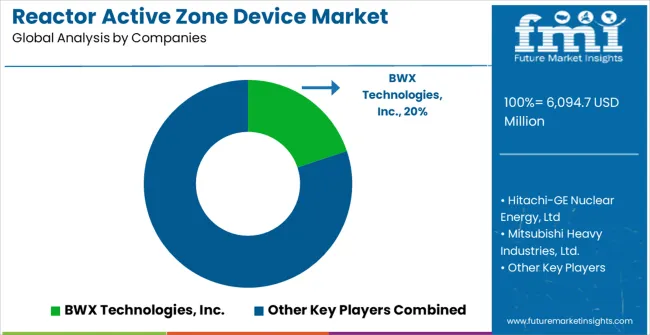
The Reactor Active Zone Device market is defined by competition among specialized nuclear equipment manufacturers, nuclear technology companies, and reactor component solution providers. Companies are investing in advanced nuclear fuel technology development, reactor performance optimization, safety system enhancement improvements, and comprehensive nuclear engineering capabilities to deliver reliable, safe, and cost-effective nuclear reactor solutions. Strategic partnerships, technological innovation, and market expansion are central to strengthening product portfolios and market presence.
BWX Technologies Inc. offers comprehensive nuclear component solutions with established nuclear manufacturing expertise and government-grade nuclear capabilities. Hitachi-GE Nuclear Energy Ltd. provides extensive nuclear power equipment with focus on advanced boiling water reactor technology and nuclear system integration. Mitsubishi Heavy Industries Ltd. delivers specialized nuclear equipment with emphasis on pressurized water reactor systems and nuclear component manufacturing. State Atomic Energy Corporation Rosatom specializes in comprehensive nuclear technology with advanced reactor design integration.
Westinghouse Electric Company LLC offers nuclear power plant solutions with focus on pressurized water reactor technology and nuclear fuel systems. KEPCO NF provides nuclear fuel fabrication services with emphasis on reactor fuel assembly manufacturing. Framatome delivers nuclear steam supply systems with comprehensive reactor technology capabilities. China National Nuclear Corporation and UMP offer specialized nuclear manufacturing expertise, reactor reliability, and comprehensive nuclear technology development across global and regional nuclear power market segments.
| Item | Value |
|---|---|
| Quantitative Units | USD 6,094.7 million |
| Product Type | Enriched Uranium Dioxide, Natural Uranium Dioxide, Others |
| Application | Nuclear Energy, Military Industry |
| Regions Covered | North America, Europe, East Asia, South Asia & Pacific, Latin America, Middle East & Africa |
| Country Covered | China, India, Germany, Brazil, United States, United Kingdom, Japan, and 40+ countries |
| Key Companies Profiled | BWX Technologies Inc., Hitachi-GE Nuclear Energy Ltd., Mitsubishi Heavy Industries Ltd., State Atomic Energy Corporation Rosatom, Westinghouse Electric Company LLC., KEPCO NF, Framatome, China National Nuclear Corporation, UMP |
| Additional Attributes | Dollar sales by product type and application segment, regional demand trends across major markets, competitive landscape with established nuclear equipment manufacturers and emerging reactor technology providers, customer preferences for different fuel enrichment levels and reactor configurations, integration with nuclear power plant systems and safety protocols, innovations in advanced reactor designs and enhanced safety features, and adoption of digital monitoring technologies with enhanced performance capabilities for improved nuclear power workflows. |
The global abdominal compression garments market is estimated to be valued at USD 565.9 million in 2025.
The market size for the abdominal compression garments market is projected to reach USD 1,082.3 million by 2035.
The abdominal compression garments market is expected to grow at a 6.7% CAGR between 2025 and 2035.
The key product types in abdominal compression garments market are cotton, chemical fiber and functional fabric.
In terms of application, sports segment to command 34.0% share in the abdominal compression garments market in 2025.


Our Research Products

The "Full Research Suite" delivers actionable market intel, deep dives on markets or technologies, so clients act faster, cut risk, and unlock growth.

The Leaderboard benchmarks and ranks top vendors, classifying them as Established Leaders, Leading Challengers, or Disruptors & Challengers.

Locates where complements amplify value and substitutes erode it, forecasting net impact by horizon

We deliver granular, decision-grade intel: market sizing, 5-year forecasts, pricing, adoption, usage, revenue, and operational KPIs—plus competitor tracking, regulation, and value chains—across 60 countries broadly.

Spot the shifts before they hit your P&L. We track inflection points, adoption curves, pricing moves, and ecosystem plays to show where demand is heading, why it is changing, and what to do next across high-growth markets and disruptive tech

Real-time reads of user behavior. We track shifting priorities, perceptions of today’s and next-gen services, and provider experience, then pace how fast tech moves from trial to adoption, blending buyer, consumer, and channel inputs with social signals (#WhySwitch, #UX).

Partner with our analyst team to build a custom report designed around your business priorities. From analysing market trends to assessing competitors or crafting bespoke datasets, we tailor insights to your needs.
Supplier Intelligence
Discovery & Profiling
Capacity & Footprint
Performance & Risk
Compliance & Governance
Commercial Readiness
Who Supplies Whom
Scorecards & Shortlists
Playbooks & Docs
Category Intelligence
Definition & Scope
Demand & Use Cases
Cost Drivers
Market Structure
Supply Chain Map
Trade & Policy
Operating Norms
Deliverables
Buyer Intelligence
Account Basics
Spend & Scope
Procurement Model
Vendor Requirements
Terms & Policies
Entry Strategy
Pain Points & Triggers
Outputs
Pricing Analysis
Benchmarks
Trends
Should-Cost
Indexation
Landed Cost
Commercial Terms
Deliverables
Brand Analysis
Positioning & Value Prop
Share & Presence
Customer Evidence
Go-to-Market
Digital & Reputation
Compliance & Trust
KPIs & Gaps
Outputs
Full Research Suite comprises of:
Market outlook & trends analysis
Interviews & case studies
Strategic recommendations
Vendor profiles & capabilities analysis
5-year forecasts
8 regions and 60+ country-level data splits
Market segment data splits
12 months of continuous data updates
DELIVERED AS:
PDF EXCEL ONLINE
Glass Reactor Market Size and Share Forecast Outlook 2025 to 2035
Shunt Reactor Market Growth – Trends & Forecast 2020 to 2030
Chemical Reactors Market
Cellbag Bioreactor Chambers Market Size and Share Forecast Outlook 2025 to 2035
Airlift Bioreactors Market - Growth & Forecast 2025 to 2035
Rocking Bioreactors Market
Fixed Shunt Reactor Market Size and Share Forecast Outlook 2025 to 2035
Microbial Bioreactors Market
Single-use Bioreactors Market Size and Share Forecast Outlook 2025 to 2035
Variable Shunt Reactor Market Size and Share Forecast Outlook 2025 to 2035
Small-Scale Bioreactors Market Analysis by Product, Capacity, End-User, and Region through 2035
Pressurized Water Reactor System Market Size and Share Forecast Outlook 2025 to 2035
Three Phase Shunt Reactor Market Size and Share Forecast Outlook 2025 to 2035
Controllable Shunt Reactor for UHV Market Size and Share Forecast Outlook 2025 to 2035
Continuous Flow Bioreactors Market Analysis - Size, Share, and Forecast Outlook 2025 to 2035
Oil Immersed Shunt Reactor Market Size and Share Forecast Outlook 2025 to 2035
Single Phase Shunt Reactor Market Size and Share Forecast Outlook 2025 to 2035
Utility Based Shunt Reactor Market Size and Share Forecast Outlook 2025 to 2035
Air Core Fixed Shunt Reactor Market Size and Share Forecast Outlook 2025 to 2035
Renewable Based Shunt Reactor Market Size and Share Forecast Outlook 2025 to 2035

Thank you!
You will receive an email from our Business Development Manager. Please be sure to check your SPAM/JUNK folder too.
Chat With
MaRIA