The variable shunt reactor market was valued at USD 1,027.6 million in 2025 and is projected to reach USD 2,137.7 million by 2035, reflecting a CAGR of 7.6%. Over the ten years, the market demonstrates a steady increase, moving from USD 1,105.7 million in 2026 to USD 1,986.7 million in 2034 before reaching the projected value. This growth trajectory underscores the increasing reliance on variable shunt reactors to regulate voltage, enhance grid stability, and manage reactive power in transmission networks. In my view, the market expansion suggests that utilities and independent system operators are prioritizing investments in reactive power management to maintain efficiency, prevent power losses, and mitigate system risks. The consistent year-on-year increments underscore that variable shunt reactors are becoming indispensable tools in modern electricity networks where operational control and reliability are critical.
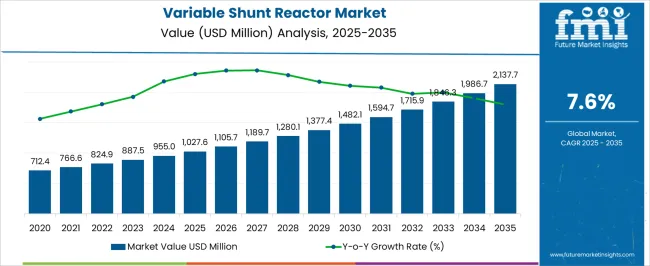
The variable shunt reactor market stood at USD 1,027.6 million in 2025 and is anticipated to grow to USD 2,137.7 million by 2035, illustrating a CAGR of 7.6%. Year-on-year comparisons reveal a consistent upward trend, with values increasing from USD 1,189.7 million in 2027 to USD 1,846.3 million in 2033, reflecting steady adoption across multiple regions. The market is being reinforced by the need to manage voltage fluctuations, minimize transmission losses, and support complex load patterns in power grids. From my perspective, companies that deploy variable shunt reactors are well-positioned to optimize energy flow, enhance network stability, and mitigate operational bottlenecks. The growth pattern suggests that utilities are gradually shifting away from static solutions, emphasizing flexible and controlled reactive power management as a crucial component of grid modernization strategies.
| Metric | Value |
|---|---|
| Variable Shunt Reactor Market Estimated Value in (2025 E) | USD 1027.6 million |
| Variable Shunt Reactor Market Forecast Value in (2035F) | USD 2137.7 million |
| Forecast CAGR (2025 to 2035) | 7.6% |
The variable shunt reactor market has been positioned as a crucial niche within several expansive parent markets, each reflecting a measurable level of integration. Within the power transmission and distribution market, the variable shunt reactor contributes approximately 4.9%, driven by its role in stabilizing voltage fluctuations, improving system reliability, and managing reactive power in high-voltage networks.
In the electrical equipment market, its share is estimated at around 5.3%, as these reactors are increasingly adopted for compact installations, reducing the footprint of substations and enhancing operational efficiency. The high voltage equipment market records a penetration of nearly 5.8%, reflecting its importance in handling voltage surges, improving load flow management, and minimizing transmission losses. Within the grid infrastructure market, the market holds a 4.7% share, highlighting adoption in modernized grids for balancing generation and consumption across interconnected networks.
In the industrial automation and control systems market, variable shunt reactors account for roughly 3.9%, as integration into centralized monitoring and control systems allows for precise reactive power compensation and system optimization. Cumulatively, the variable shunt reactor market represents nearly 24.6% across these parent industries, underscoring its strategic significance in enhancing electrical network performance.
Its adoption is driven by the necessity for reliable, scalable, and efficient voltage regulation solutions, prompting utilities and industrial operators to integrate variable shunt reactors as core components of modern transmission and distribution architectures. The influence of this market has been reshaping competitive strategies, encouraging innovation in system design and operational excellence while ensuring stable, loss-minimized power delivery across complex networks.
The variable shunt reactor market is witnessing notable growth driven by the increasing need for grid stability, load compensation, and voltage regulation in high-voltage power transmission systems. The shift toward renewable energy integration and the expansion of long-distance transmission networks are reinforcing the role of variable shunt reactors in dynamic reactive power management. With utilities investing in smart grids and flexible AC transmission systems (FACTS), demand for advanced compensation technologies has intensified.
The market outlook remains positive, supported by policy-led investments in power infrastructure upgrades and ongoing digitalization initiatives across grid systems. Technological advancements in control systems and insulation design have further enhanced reactor efficiency, while growing concerns around energy losses and system reliability continue to shape procurement strategies.
Additionally, the rising electricity demand in emerging economies is increasing the deployment of reactive power devices to ensure efficient and uninterrupted power flow. As the global energy transition accelerates, variable shunt reactors are expected to play a critical role in enhancing grid resilience and optimizing energy transmission across variable load conditions.
The variable shunt reactor market is segmented by phase, insulation, end use, and geographic regions. By phase, variable shunt reactor market is divided into Single phase and Three phase. In terms of insulation, variable shunt reactor market is classified into Oil immersed and Air core. Based on end use, variable shunt reactor market is segmented into Electric utility and Renewable energy. Regionally, the variable shunt reactor industry is classified into North America, Latin America, Western Europe, Eastern Europe, Balkan & Baltic Countries, Russia & Belarus, Central Asia, East Asia, South Asia & Pacific, and the Middle East & Africa.
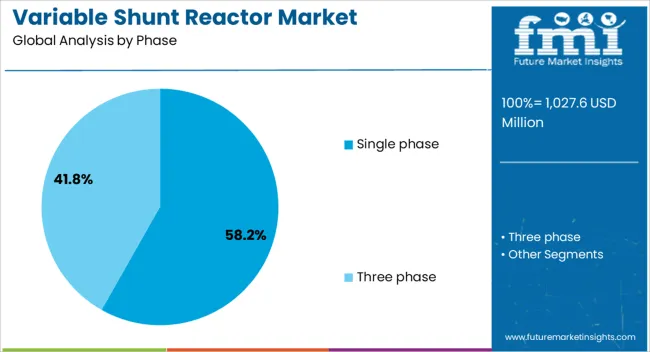
The single phase segment holds the dominant position in the phase category of the variable shunt reactor market, accounting for approximately 58.2% of the overall share. This leadership is attributed to the segment’s widespread application in high-voltage power transmission systems where phase balancing and voltage control are critical. Single phase reactors are typically preferred for their modular design, operational flexibility, and ease of installation in both new and retrofit grid infrastructures.
The segment’s growth is further supported by increasing deployment in remote substations and rural grid extensions, where tailored compensation for phase-specific load variation is necessary. Additionally, cost-effectiveness in manufacturing and maintenance contributes to its sustained preference among utilities.
Integration of smart monitoring systems into single phase units has improved real-time control capabilities, aligning with digital grid strategies. With continued investments in grid modernization and voltage regulation equipment, the single phase segment is expected to maintain its leadership in the coming years.
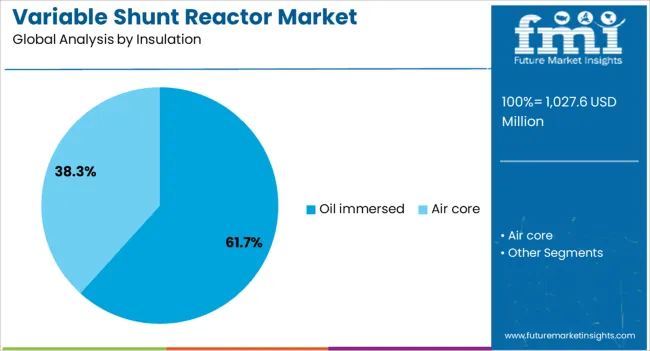
The oil immersed segment leads the insulation category, capturing approximately 61.7% of the market share due to its proven reliability, thermal stability, and extended service life under high-voltage conditions. Oil-based insulation has been widely adopted in power transmission applications, particularly where enhanced dielectric strength and cooling efficiency are required. This segment’s dominance is reinforced by its compatibility with large-scale installations and its capacity to handle substantial reactive power compensation loads.
Utilities and power system operators continue to prefer oil immersed reactors for their lower risk of dielectric breakdown and effective performance in harsh environmental conditions. Despite the growing interest in dry-type alternatives, oil immersed reactors remain the industry standard for outdoor and high-capacity applications.
Advancements in oil purification and leak-proof designs have further improved operational safety and environmental compliance. Given the balance of performance, cost-efficiency, and regulatory acceptance, the oil immersed segment is anticipated to retain its leading role in the insulation category throughout the forecast period.
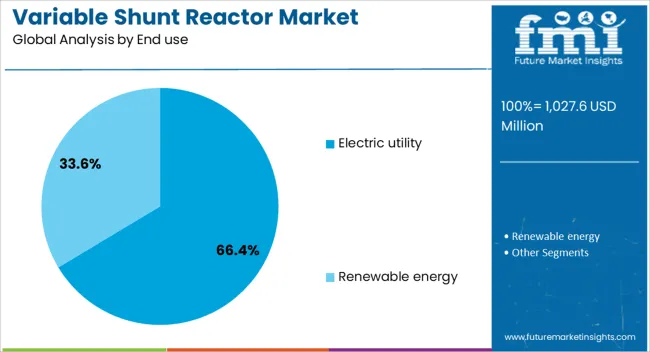
The electric utility segment dominates the end use category, accounting for approximately 66.4% of the variable shunt reactor market. This segment’s prominence stems from the utilities’ continuous focus on grid stability, energy efficiency, and infrastructure reliability in high-voltage power networks. Variable shunt reactors are increasingly utilized by electric utilities to manage voltage fluctuations, enhance reactive power control, and maintain system integrity under varying load conditions.
The rise in renewable energy penetration and distributed generation has further underscored the need for flexible compensation solutions, with utilities at the forefront of deployment. Regulatory mandates for grid modernization, energy loss reduction, and system automation have also accelerated reactor installation across transmission and distribution networks.
Strategic investments in smart substations and cross-border interconnection projects are reinforcing demand from electric utilities. With grid expansion plans underway in emerging regions and refurbishment initiatives in mature markets, the electric utility segment is expected to remain the primary driver of growth in the variable shunt reactor market.
The variable shunt reactor market has been driven by increasing demand for voltage regulation, grid stability, and reactive power management in transmission networks. Adoption has been influenced by the expansion of high-voltage grids, renewable integration, and industrial electrification. Opportunities are emerging in retrofitting aging substations and deploying flexible reactor solutions for complex networks. Trends are being observed in digital monitoring, modular designs, and hybrid shunt reactor deployment, while challenges persist in high capital costs, operational complexities, and regional regulatory compliance. Overall, the market outlook remains positive with ongoing grid modernization initiatives.
The demand for variable shunt reactors has been strongly influenced by the growing requirement for voltage control, reactive power compensation, and improved grid stability in transmission and distribution networks. Utilities and power system operators have been observed increasingly adopting these reactors to manage fluctuating loads, maintain optimal voltage levels, and prevent transmission bottlenecks in both high-voltage and extra-high-voltage networks. In opinion, this demand has been reinforced by the expansion of renewable energy integration, which has created variable load patterns and necessitated advanced reactive power management. Industrial facilities and large-scale grid operators are also prioritizing the use of variable shunt reactors to mitigate system losses and enhance operational efficiency. The adoption of flexible reactor solutions is being viewed as essential to maintain network reliability, optimize power flow, and prevent voltage collapse, highlighting that demand is structurally driven by evolving transmission challenges rather than temporary market fluctuations.
Opportunities in the variable shunt reactor market have been largely defined by retrofitting aging substations, replacing fixed reactors, and deploying flexible reactor solutions in complex networks. Utilities are increasingly recognizing the value of reactors that allow adjustable compensation based on load variations and system conditions. In opinion, these opportunities are expanding in emerging regions where power grids are being upgraded and transmission congestion is prevalent. The deployment of variable shunt reactors for hybrid solutions, which combine conventional and adjustable configurations, has been observed to enhance grid resilience and operational flexibility. Furthermore, service providers and manufacturers are exploring opportunities in monitoring, control integration, and lifecycle management contracts. Cross-border transmission projects and large-scale industrial electrification initiatives are further amplifying these opportunities, as network operators seek adaptive solutions to maintain voltage stability, optimize reactive power, and reduce overall transmission losses. These factors are expected to accelerate adoption and support long-term market growth.
The variable shunt reactor market has been shaped by noticeable trends in digital monitoring, remote control, and modular reactor designs. Real-time monitoring systems have been increasingly adopted to provide predictive maintenance, operational diagnostics, and performance optimization. Modular designs are being preferred for their flexibility, ease of installation, and scalability across multiple voltage levels. In opinion, these trends are reinforcing the market’s transition toward more adaptive and performance-driven solutions, enabling utilities to respond effectively to fluctuating loads and network contingencies. Integration with SCADA systems and digital substations has further strengthened the trend, allowing for precise control, load balancing, and enhanced safety. Hybrid reactors that combine modular and adjustable features are also gaining traction, reflecting the shift in market preference toward solutions that can be dynamically adapted to evolving transmission challenges. Overall, such trends are redefining competitive dynamics and shaping stakeholder investment priorities.
The variable shunt reactor market has faced ongoing challenges related to high capital expenditure, complex installation processes, and regional regulatory approvals. The upfront costs associated with acquiring and deploying variable shunt reactors are significantly higher than traditional fixed reactors, which can deter smaller utilities or constrained industrial operators. In opinion, installation challenges, including specialized handling, testing, and commissioning, have been underestimated in several large-scale projects, leading to delays and operational risks. Regulatory frameworks governing voltage control devices and high-voltage equipment vary across regions, further complicating adoption timelines and cross-border deployment. Supply chain dependencies for core components, such as magnetic cores and power electronics, have occasionally restricted market expansion. Addressing these challenges requires meticulous project planning, adherence to standards, and strong collaboration between manufacturers, utilities, and regulatory authorities. Overcoming these barriers is essential to ensure the consistent deployment of variable shunt reactors and the maintenance of grid reliability.
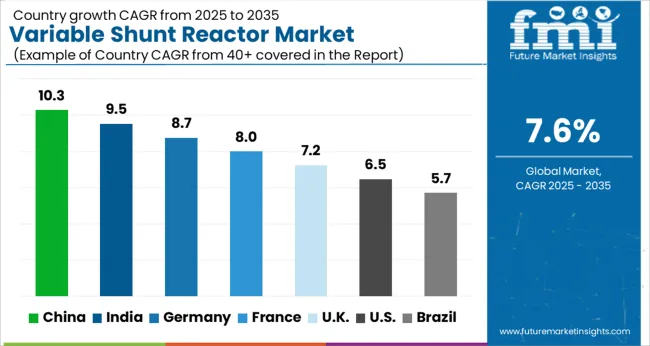
| Country | CAGR |
|---|---|
| China | 10.3% |
| India | 9.5% |
| Germany | 8.7% |
| France | 8.0% |
| UK | 7.2% |
| USA | 6.5% |
| Brazil | 5.7% |
The global variable shunt reactor (VSR) market is projected to grow at a CAGR of 7.6% from 2025 to 2035. China leads with 10.3% growth, followed by India at 9.5%, and Germany at 8.7%. The United Kingdom records 7.2%, while the United States shows the slowest growth at 6.5%. Expansion is being driven by increasing demand for reactive power compensation, voltage stabilization, and grid reliability in transmission and distribution networks. Emerging markets like China and India witness higher growth due to rapid grid expansion, renewable energy integration, and industrial electrification, while developed markets focus on modernizing aging networks, improving operational efficiency, and reducing transmission losses. This report includes insights on 40+ countries; the top markets are shown here for reference.
The variable shunt reactor market in China is growing at a CAGR of 10.3%, supported by rapid power grid expansion, renewable energy integration, and increasing industrial load requirements. Utilities are adopting VSRs to stabilize voltage fluctuations, optimize reactive power compensation, and improve overall grid reliability. Government policies promoting smart grids and clean energy deployment further accelerate adoption. Local manufacturing capabilities and large-scale investments in transmission infrastructure enhance market penetration. Growth is reinforced by the rising deployment of high-voltage lines and substations, where VSRs are critical for maintaining voltage stability under variable load conditions.
The variable shunt reactor market in India is advancing at a CAGR of 9.5%, fueled by growing power demand, industrialization, and transmission network upgrades. Indian utilities are replacing conventional reactors with VSRs to improve reactive power management, reduce system losses, and enhance voltage stability. Growth is reinforced by government initiatives aimed at modernizing the grid and integrating renewable energy sources. Domestic manufacturers and EPC contractors are providing turnkey VSR solutions to facilitate faster deployment. The rising adoption of high-voltage lines for long-distance power transmission supports consistent market expansion.
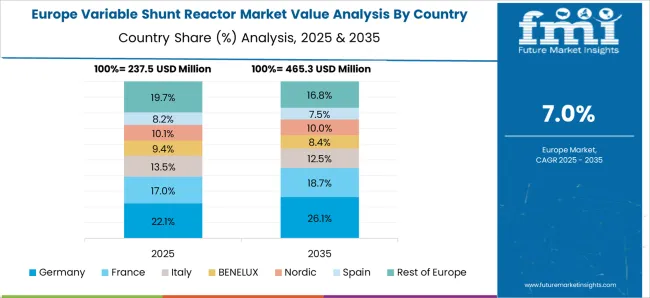
The variable shunt reactor market in Germany is projected to grow at a CAGR of 8.7%, supported by upgrading aging transmission infrastructure, increasing grid automation, and renewable energy penetration. German utilities prioritize VSRs for reactive power compensation and maintaining voltage stability in complex industrial and urban networks. Adoption is also reinforced by strict regulatory standards and focus on reducing transmission losses. Market growth is concentrated in high-value substations where performance reliability is critical. Integration with monitoring and predictive maintenance systems further enhances operational efficiency.
The variable shunt reactor market in the United Kingdom is expanding at a CAGR of 7.2%, supported by modernization of transmission networks, urban grid stability requirements, and integration of renewable energy sources. Utilities are increasingly deploying VSRs to manage voltage fluctuations, ensure power quality, and enhance system reliability. Growth is further supported by investments in smart grids and digital monitoring systems, enabling real-time reactive power control. VSR adoption is focused on high-demand substations and industrial applications where voltage regulation is critical.
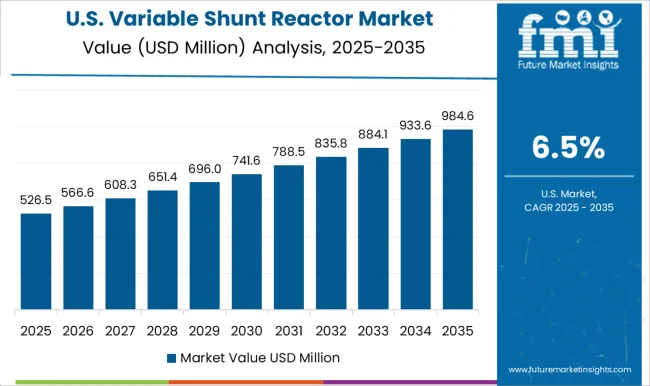
The variable shunt reactor market in the United States is growing at a CAGR of 6.5%, driven by upgrades to aging transmission networks, increasing focus on grid reliability, and integration of renewable energy. USA utilities are deploying VSRs to optimize reactive power, stabilize voltage, and reduce transmission losses. Advanced monitoring and automation solutions are being integrated to enhance operational efficiency and support predictive maintenance. While growth is slower than in emerging markets, steady adoption is observed in high-value industrial and urban substations, supporting consistent market expansion.
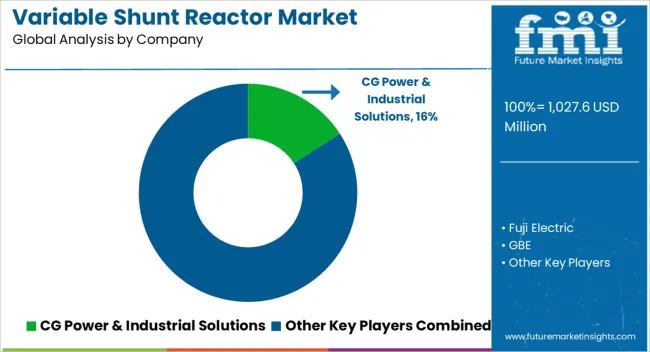
The variable shunt reactor market is being shaped by a mix of global electrical leaders and regional specialists. Siemens Energy, GE, and Hitachi Energy are being positioned as dominant players through high-capacity, reliability-focused solutions for grid stabilization and reactive power control. Their strategy is being executed with advanced insulation technologies, compact modular designs, and robust testing standards, ensuring minimal losses and long service life. CG Power & Industrial Solutions, Fuji Electric, and Hyosung Heavy Industries are being directed toward regional strength, combining cost-effective manufacturing with localized service support. Toshiba Energy Systems & Solutions, Nissin Electric, and WEG are being noted for specialized reactors catering to industrial and utility-scale applications, emphasizing precision control and energy efficiency.
GBE, Getra, SGB Smit, Shrihans Electricals, and TMC Transformers Manufacturing Company are being recognized for niche solutions, small-to-medium capacity units, and customization options that appeal to specific power distribution challenges. The competitive landscape is being determined by reliability, scalability, and adaptability to grid fluctuations, while market leadership is being reinforced through proven performance, certifications, and turnkey service offerings. Product brochures are being crafted as concise yet authoritative tools to convey technical strength. Siemens Energy and GE brochures are being developed with clear schematics, performance tables, and case studies demonstrating grid stability improvements. Hitachi Energy and Toshiba brochures emphasize reliability, minimal maintenance, and modular integration, ensuring quick decision-making for utility planners.
CG Power & Industrial Solutions, Fuji Electric, and Hyosung brochures are focused on regional delivery efficiency, cost-effectiveness, and installation simplicity. Nissin Electric, WEG, and SGB Smit brochures highlight specialized applications, energy savings, and operational flexibility. GBE, Getra, Shrihans Electricals, and TMC Transformers Manufacturing Company brochures are tailored with diagrams and compact narratives that stress customization, technical compliance, and small-scale deployment advantages. Each brochure is being structured to act as a persuasive standalone reference, blending technical precision, visual clarity, and performance metrics to ensure buyers can quickly assess value and reliability in the variable shunt reactor market.
| Item | Value |
|---|---|
| Quantitative Units | USD 1027.6 Million |
| Phase | Single phase and Three phase |
| Insulation | Oil immersed and Air core |
| End use | Electric utility and Renewable energy |
| Regions Covered | North America, Europe, Asia-Pacific, Latin America, Middle East & Africa |
| Country Covered | United States, Canada, Germany, France, United Kingdom, China, Japan, India, Brazil, South Africa |
| Key Companies Profiled | CG Power & Industrial Solutions, Fuji Electric, GBE, GE, Getra, Hitachi Energy, Hyosung Heavy Industries, Nissin Electric, SGB Smit, Siemens Energy, Shrihans Electricals, TMC Transformers Manufacturing Company, Toshiba Energy Systems & Solutions, and WEG |
| Additional Attributes | Dollar sales by reactor type (air-core, iron-core) and application (transmission lines, distribution networks, renewable integration) are key metrics. Trends include rising demand for voltage stabilization, growth in high-voltage grid infrastructure, and increasing adoption in renewable energy projects. Regional deployment, technological advancements, and regulatory compliance are driving market growth. |
The global variable shunt reactor market is estimated to be valued at USD 1,027.6 million in 2025.
The market size for the variable shunt reactor market is projected to reach USD 2,137.7 million by 2035.
The variable shunt reactor market is expected to grow at a 7.6% CAGR between 2025 and 2035.
The key product types in variable shunt reactor market are single phase and three phase.
In terms of insulation, oil immersed segment to command 61.7% share in the variable shunt reactor market in 2025.


Our Research Products

The "Full Research Suite" delivers actionable market intel, deep dives on markets or technologies, so clients act faster, cut risk, and unlock growth.

The Leaderboard benchmarks and ranks top vendors, classifying them as Established Leaders, Leading Challengers, or Disruptors & Challengers.

Locates where complements amplify value and substitutes erode it, forecasting net impact by horizon

We deliver granular, decision-grade intel: market sizing, 5-year forecasts, pricing, adoption, usage, revenue, and operational KPIs—plus competitor tracking, regulation, and value chains—across 60 countries broadly.

Spot the shifts before they hit your P&L. We track inflection points, adoption curves, pricing moves, and ecosystem plays to show where demand is heading, why it is changing, and what to do next across high-growth markets and disruptive tech

Real-time reads of user behavior. We track shifting priorities, perceptions of today’s and next-gen services, and provider experience, then pace how fast tech moves from trial to adoption, blending buyer, consumer, and channel inputs with social signals (#WhySwitch, #UX).

Partner with our analyst team to build a custom report designed around your business priorities. From analysing market trends to assessing competitors or crafting bespoke datasets, we tailor insights to your needs.
Supplier Intelligence
Discovery & Profiling
Capacity & Footprint
Performance & Risk
Compliance & Governance
Commercial Readiness
Who Supplies Whom
Scorecards & Shortlists
Playbooks & Docs
Category Intelligence
Definition & Scope
Demand & Use Cases
Cost Drivers
Market Structure
Supply Chain Map
Trade & Policy
Operating Norms
Deliverables
Buyer Intelligence
Account Basics
Spend & Scope
Procurement Model
Vendor Requirements
Terms & Policies
Entry Strategy
Pain Points & Triggers
Outputs
Pricing Analysis
Benchmarks
Trends
Should-Cost
Indexation
Landed Cost
Commercial Terms
Deliverables
Brand Analysis
Positioning & Value Prop
Share & Presence
Customer Evidence
Go-to-Market
Digital & Reputation
Compliance & Trust
KPIs & Gaps
Outputs
Full Research Suite comprises of:
Market outlook & trends analysis
Interviews & case studies
Strategic recommendations
Vendor profiles & capabilities analysis
5-year forecasts
8 regions and 60+ country-level data splits
Market segment data splits
12 months of continuous data updates
DELIVERED AS:
PDF EXCEL ONLINE
Air Core Variable Shunt Reactor Market Size and Share Forecast Outlook 2025 to 2035
Single Phase Variable Shunt Reactor Market Size and Share Forecast Outlook 2025 to 2035
Variable Frequency Drive Market Size and Share Forecast Outlook 2025 to 2035
Variable Air Volume System Market Size and Share Forecast Outlook 2025 to 2035
Variable Valve Timing Market Size and Share Forecast Outlook 2025 to 2035
Variable Displacement Compressor Market Size and Share Forecast Outlook 2025 to 2035
Variable Reluctance Sensor Market Size and Share Forecast Outlook 2025 to 2035
Variable Speed Generators Market Analysis & Forecast by Technology, End Use and Region through 2035
Variable Data Printing Market Analysis – Growth & Forecast through 2034
Marine Variable Frequency Drives Market Size and Share Forecast Outlook 2025 to 2035
Automotive Variable Displacement Pumps Market Size and Share Forecast Outlook 2025 to 2035
Automotive Variable Oil Pump Market Growth – Trends & Forecast 2024-2034
Automotive Variable Discharge Oil Pump Market
Large Scale Variable Frequency Drives Market Size and Share Forecast Outlook 2025 to 2035
Continuously Variable Transmission (CVT) Market Size and Share Forecast Outlook 2025 to 2035
North America Variable Frequency Drives Market Growth – Trends & Forecast 2024-2034
Shunt Voltage References Market
Shunt Reactor Market Growth – Trends & Forecast 2020 to 2030
Fixed Shunt Reactor Market Size and Share Forecast Outlook 2025 to 2035
Interatrial Shunt Market

Thank you!
You will receive an email from our Business Development Manager. Please be sure to check your SPAM/JUNK folder too.
Chat With
MaRIA