Anti-Caking Makeup Products Market Size and Share Forecast Outlook 2025 to 2035

The Anti-Caking Makeup Products Market is expected to record a valuation of USD 1,803.7 million in 2025 and USD 3,904.7 million in 2035, with an increase of USD 2,101.0 million, which equals a growth of 193% over the decade. The overall expansion represents a CAGR of 8.0% and a 2X increase in market size.
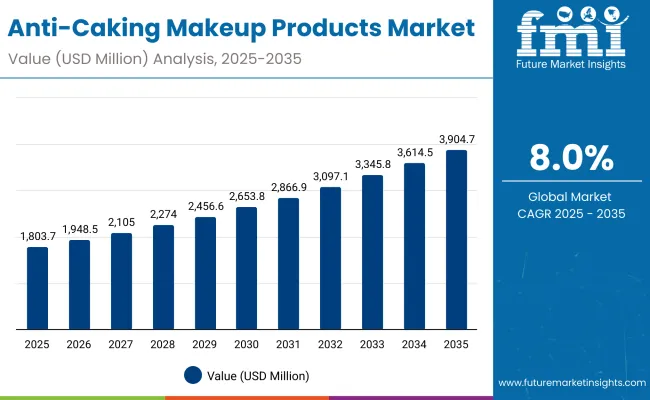
Quick Stats for Anti-Caking Makeup Products Market

  • Anti-Caking Makeup Products Market Value (2025): USD 1,803.7 million
  • Anti-Caking Makeup Products Market Forecast Value (2035): USD 3,904.7 million
  • Anti-Caking Makeup Products Market Forecast CAGR: 8.0%
  • Leading Segment in Anti-Caking Makeup Products Market in 2025: Setting powders (44.2%)
  • Key Growth Regions in the Anti-Caking Makeup Products Market: Asia-Pacific, North America, Europe
  • Top Key Players in the Anti-Caking Makeup Products Market: Laura Mercier, MAC Cosmetics, Maybelline, Urban Decay, NARS, Fenty Beauty, Charlotte Tilbury, Sephora Collection, NYX Professional, Clinique

Anti Caking Makeup Products Market

Anti-Caking Makeup Products Market Key Takeaways

Metric Value
Anti-Caking Makeup Products Market Estimated Value in (2025E) USD 1,803.7 million
Anti-Caking Makeup Products Market Forecast Value in (2035F) USD 3,904.7 million
Forecast CAGR (2025 to 2035) 8.00%

During the first five-year period from 2025 to 2030, the market increases from USD 1,803.7 million to USD 2,653.8 million, adding USD 850.1 million, which accounts for around 40% of the total decade growth. This phase records steady adoption in everyday consumer makeup, event and bridal applications, and professional makeup artistry, driven by the need for oil-control and mattifying finishes. Setting powders dominate this period as they cater to over 44% of total usage, particularly favored for base stability and long-lasting wear across multiple consumer groups. E-commerce platforms emerge as a strong driver of growth, capturing nearly 867.6 million in value during 2025, as online beauty trends and influencer-driven tutorials expand consumer reach.

The second half from 2030 to 2035 contributes USD 1,251.0 million, equal to around 60% of total growth, as the market jumps from USD 2,653.8 million to USD 3,904.7 million. This acceleration is powered by the widespread popularity of multifunctional primers, long-wear finishing sprays, and portable pressed powders. Technological innovation in formulations, such as micro-fine mattifying particles and moisture-balancing actives, enhances adoption among professional artists and high-performance consumers.

By the end of the decade, long-wear finishing categories and multi-use primers together capture a rising share above 50%, while the professional makeup supplier channel gains traction with expanding salon and studio networks. At the same time, software-like subscription models and brand-exclusive online bundles add recurring revenue, increasing the e-commerce share beyond 50% in total value.

From 2020 to 2024, the Anti-Caking Makeup Products Market grew steadily from around USD 1,200 million to USD 1,750 million, driven largely by the surge in hardware-style categories such as setting powders and pressed powders. During this period, the competitive landscape was dominated by international cosmetics leaders controlling nearly 70% of revenue, with brands such as Laura Mercier, MAC Cosmetics, and Maybelline focusing on powder-based anti-caking solutions designed for both professional and everyday use.

Competitive differentiation relied heavily on product finish, staying power, and oil-control properties, while sprays and primers remained niche but steadily growing segments. Service-based brand experiences, such as personalized shade matching and virtual try-ons, had minimal traction, contributing less than 10% of the total market value.

Demand for anti-caking products expanded to USD 1,803.7 million in 2025, and the revenue mix began to shift as finishing sprays and primers grew to over 30% share. Traditional powder-focused leaders faced rising competition from digital-first beauty brands offering long-wear, multifunctional, and skincare-infused solutions. Major beauty companies began pivoting to hybrid portfolios, integrating anti-caking benefits into broader foundation and primer lines to retain relevance. Emerging entrants specializing in clean-label, vegan, and AI-driven personalized recommendations gained share.

Why the Anti-Caking Makeup Products Market is Growing?

Advances in formulation science have improved the performance of anti-caking products, allowing for better oil absorption, smoother texture, and longer wear across diverse skin types. Setting powders and pressed powders have gained popularity due to their suitability for mattifying effects and their ability to lock in foundation. The rise of oil-control and moisture-balancing ingredients has contributed to enhanced skin comfort and real-time finish correction. Industries such as professional makeup artistry, event makeup, and everyday consumer cosmetics are driving demand for anti-caking products that can integrate seamlessly into multi-step routines.

Expansion of automated digital retail, AR-based beauty try-ons, and e-commerce subscription boxes has fueled market growth. Innovations in portable pressed powders, high-definition finishing sprays, and lightweight primers are expected to open new application areas. Segment growth is expected to be led by setting powders in product types, oil-absorbing formulations in functional benefits, and e-commerce channels in distribution, due to their accessibility, adaptability, and wide consumer acceptance.

Segmental Analysis

The market is segmented by product type, function, channel, end user, and region. Product types include setting powders, primers, finishing sprays, and pressed powders, highlighting the core formulations driving adoption across consumer and professional applications. Functions cover oil absorption & mattifying, moisture balancing, and long-wear finish, each addressing distinct skin concerns and performance expectations. Channel classification spans e-commerce, specialty beauty retail, mass retail, and professional makeup suppliers to cater to the different modes of consumer purchasing.

Based on end user, the segmentation includes professional makeup artists, everyday consumers, and event/bridal users, reflecting the broad base of both professional and lifestyle-driven demand. Regionally, the scope spans North America, Latin America, Europe, East Asia, South Asia & Pacific, and the Middle East & Africa, ensuring coverage of both mature beauty markets and fast-emerging growth regions.

Within these regions, countries such as the United States, United Kingdom, Germany, France, China, Japan, and India represent key contributors, while emerging economies in Latin America and Africa are beginning to capture share through expanding online beauty platforms and localized product launches.
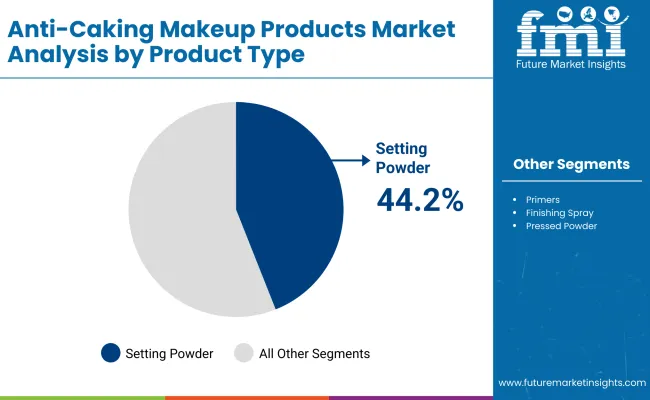
Insights into the Product Type Segment with Setting Powders Leading in Market Share

Anti Caking Makeup Products Market By Product

Product Type Value Share% 2025
Setting powders 44.2%
Others 55.8%

The setting powders segment is projected to contribute 44.2% of the Anti-Caking Makeup Products Market revenue in 2025, maintaining its lead as the dominant product type category. This is driven by ongoing consumer demand for advanced powder formulations with micro-fine textures that provide improved oil absorption, mattifying effects, and long-lasting coverage. Setting powders are prioritized by both everyday consumers and professional makeup artists for their reliability in locking in foundation and ensuring consistent results across skin types and climates.

The segment’s growth is also supported by the development of lightweight and portable pressed setting powders that enhance usability for on-the-go touch-ups. As digital retail and influencer-driven tutorials become more prevalent, brands are innovating with tinted, translucent, and clean-label formulations to meet diverse consumer preferences. The setting powders segment is expected to retain its position as the backbone of anti-caking makeup products, reflecting its indispensable role in achieving smooth, long-wear finishes.
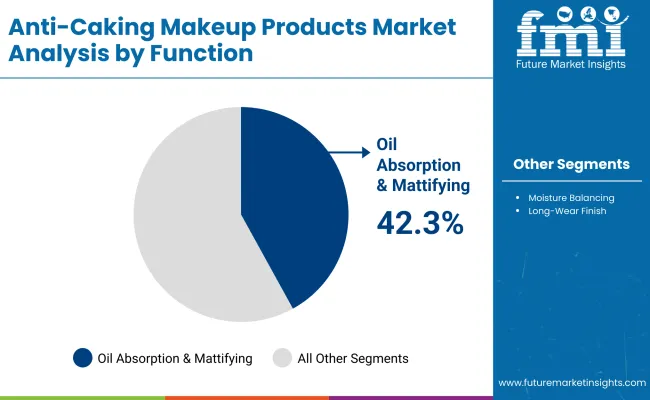
Insights into the Function Segment with Oil Absorption & Mattifying Dominating the Demand

Anti Caking Makeup Products Market By Function

Function Value Share% 2025
Oil absorption & mattifying 42.3%
Others 57.7%

The oil absorption & mattifying segment is forecasted to hold 42.3% of the market share in 2025, led by its application in controlling excess sebum and creating a shine-free finish. These formulations are favored for their high efficiency in managing oily skin conditions and ensuring long-lasting wear, making them ideal for both everyday use and professional applications in event and bridal makeup.

Their lightweight texture and ease of layering with other cosmetic products have facilitated widespread adoption among everyday consumers as well as makeup artists. The segment’s growth is bolstered by advancements in powder technology, such as silica-coated microspheres and botanical-infused mattifiers, which improve absorption efficiency while reducing skin dryness. As consumers increasingly require products that deliver flawless finishes for both casual and high-performance use, oil absorption & mattifying products are expected to continue their dominance in the market.
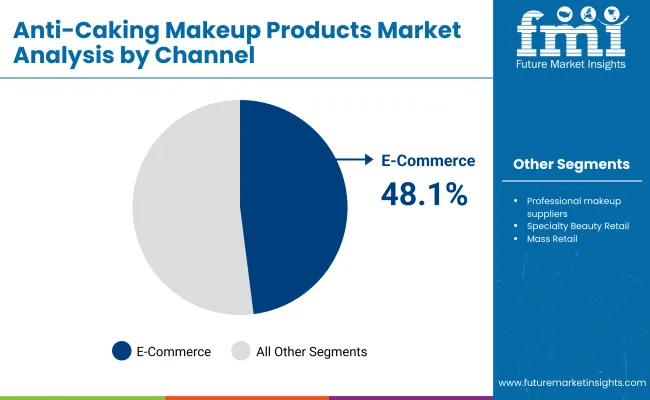
Insights into the Channel Segment with E-commerce Leading in Market Share

Anti Caking Makeup Products Market By Channel

Channel Value Share% 2025
E-commerce 48.1%
Others 51.9%

The e-commerce segment is projected to account for 48.1% of the Anti-Caking Makeup Products Market revenue in 2025, establishing it as the leading distribution channel. This channel is preferred due to the rapid rise of online beauty platforms, influencer-driven purchasing behavior, and the availability of virtual try-on tools that enhance consumer engagement.

Its suitability for offering bundled deals, subscription boxes, and personalized product recommendations has made e-commerce increasingly attractive across different consumer demographics. Developments in digital platforms and seamless delivery services have further accelerated adoption, improving accessibility and convenience. Given its balance of wide reach and high growth potential, e-commerce is expected to maintain its leading role in the Anti-Caking Makeup Products Market.

What are the Drivers, Restraints, and Key Trends of the Anti-Caking Makeup Products Market?

Drivers

Rising Demand for Long-Wear, Oil-Control Formulations

One of the strongest growth drivers in the Anti-Caking Makeup Products Market is the rising consumer demand for long-wear makeup that can withstand oil, humidity, and extended usage hours. Urban lifestyles, climate variability, and high social media visibility have pushed consumers toward products that promise a shine-free, photo-ready finish throughout the day. The oil absorption & mattifying segment already commands 42.3% share in 2025, highlighting how sebum-control benefits resonate with diverse consumer bases.

This demand is particularly strong in emerging Asian markets like India and China, where humid climates and rising middle-class purchasing power are combining to accelerate uptake of anti-caking powders and sprays. The driver is not only functional but also aspirational, as consumers associate flawless, matte skin with modern beauty standards amplified by global influencer culture.

Expansion of E-commerce and Direct-to-Consumer Platforms

With 48.1% of global sales in 2025 already coming from e-commerce, online distribution is not just a channel it’s becoming a growth engine. E-commerce allows brands to launch micro-collections, leverage AR/VR try-on tools, and run influencer-led campaigns at low cost and high reach. Global consumers, particularly Gen Z and millennials, rely on reviews, tutorials, and social media-driven shopping journeys, which favor online-first anti-caking product launches. Subscription models and refill packs are increasingly bundled into e-commerce offerings, generating recurring sales. This driver is especially relevant in markets like the USA and UK, where Sephora Collection, Fenty Beauty, and NYX Professional dominate online engagement, and in Asia-Pacific, where platforms like Tmall and Shopee give premium and mass brands simultaneous reach.

Restraints

Skin Health Concerns and Regulatory Scrutiny

Despite strong growth, the market faces a restraint due to increasing concerns around skin dryness, clogged pores, and irritation caused by heavy powder formulations. Dermatologists often caution against overuse of powders that may strip moisture or exacerbate acne-prone skin. In parallel, regulators in Europe and North America are tightening ingredient compliance for talc-based products, microplastics, and chemical mattifiers.

This scrutiny forces brands to reformulate, adding R&D costs while slowing time-to-market. Consumers shifting toward "clean beauty" and dermatologist-tested claims may limit adoption of traditional anti-caking formulas, especially among health-conscious demographics.

Pricing Pressure from Mass Retail Segments

Another restraint is the price competition between premium and mass-market anti-caking products. While luxury players like Laura Mercier and Charlotte Tilbury dominate the aspirational space, drugstore brands like Maybelline and NYX Professional aggressively compete on affordability and accessibility through supermarkets and pharmacies. This dual market dynamic compresses margins for mid-tier brands, especially in emerging economies where cost-sensitive consumers often trade down. The increasing availability of private label anti-caking powders and sprays in retail chains further pressures established players, restraining overall premiumization.

Key Trends

Hybrid Skincare-Infused Anti-Caking Products

A major trend reshaping the Anti-Caking Makeup Products Market is the rise of skincare-infused powders, primers, and sprays. Products now include actives like niacinamide, hyaluronic acid, and botanical extracts that balance mattifying with hydration and barrier support. This hybridization directly addresses consumer concerns over dryness or irritation, while positioning anti-caking products within the "skinification of makeup" trend. Brands like Fenty Beauty and Clinique are already advancing this shift, launching powders and setting sprays that double as skincare-enhancers. This aligns with consumer interest in multi-benefit products, cutting down steps in their routine.

Regional Surge in Asia-Pacific with Localized Formulations

Asia-Pacific is emerging as the fastest-growing region, with India (17.2% CAGR) and China (15.3% CAGR) outpacing global growth rates. The trend here is not just volume growth but localization of textures, shades, and finishes to match diverse skin tones and climatic conditions. Lightweight powders suited for humid environments, dewy-yet-mattifying finishes, and finely milled textures are particularly sought after. Local players and global brands alike are innovating region-specific variants to capture this demand. For instance, translucent powders and mist-based finishing sprays are favored in Japan and Korea, while India’s market shows strong adoption of high-pigment pressed powders suited for event and bridal users. This regional customization trend is key to global growth momentum.
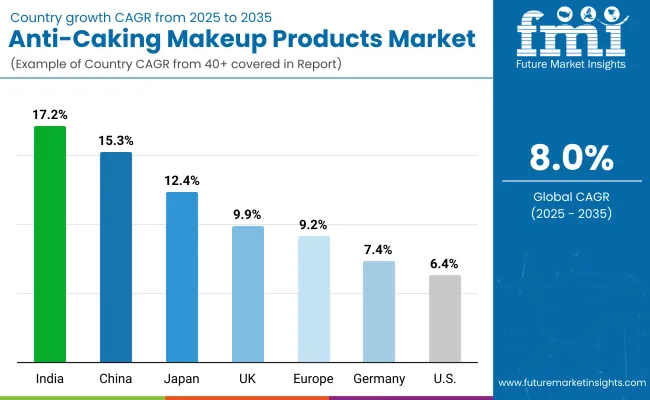
Analysis of Anti-Caking Makeup Products Market By Key Countries

Anti Caking Makeup Products Market By Country

Countries Estimated CAGR (2025 to 2035)
China 15.3%
USA 6.4%
India 17.2%
UK 9.9%
Germany 7.4%
Japan 12.4%
Europe 9.2%

The Anti-Caking Makeup Products Market shows highly uneven growth across key countries, reflecting differences in consumer behavior, beauty routines, and distribution maturity. India leads with a CAGR of 17.2%, driven by rising disposable incomes, a booming bridal and event makeup culture, and increased acceptance of premium powders and sprays among younger consumers. China follows with 15.3% CAGR, supported by the rapid expansion of e-commerce platforms like Tmall and JD.com, combined with strong consumer appetite for oil-control and long-wear products in humid climates.

Japan, at 12.4% CAGR, is fueled by innovation in hybrid skincare-infused powders and sprays, with local brands setting new standards in texture refinement and clean-label claims. These high-growth Asian markets are shaping the innovation agenda, pushing both global and regional players to localize formulations to suit skin tones, weather conditions, and cultural beauty expectations.

In contrast, growth in the Western markets is more moderate, highlighting saturation and brand maturity. The USA (6.4% CAGR) continues to expand steadily due to sustained e-commerce dominance and influencer-driven demand, but competition between luxury and mass-market brands keeps the market balanced. The UK (9.9%) and Germany (7.4%), along with broader Europe at 9.2% CAGR, benefit from strong professional makeup usage and evolving consumer preferences for clean, vegan, and dermatologist-tested powders and sprays.

However, regulatory pressures on certain ingredients and slower replacement cycles limit acceleration compared to Asia-Pacific. Overall, the global landscape demonstrates that while mature regions ensure stability, the true engine of growth lies in Asia, where demand expansion is redefining the competitive and product innovation outlook for anti-caking makeup products.
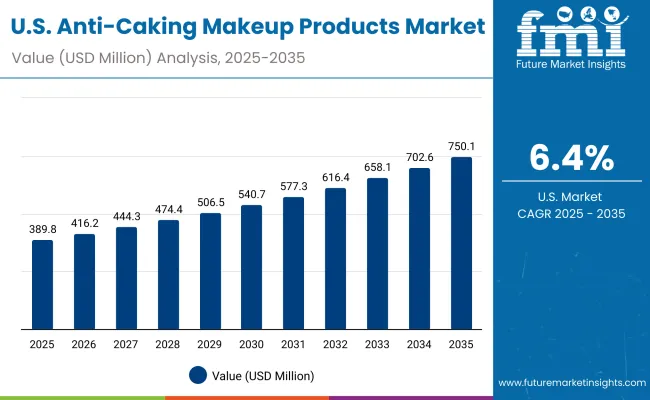
Sales Outlook for Anti-Caking Makeup Products in the United States

Anti Caking Makeup Products Market Usa

Year USA Anti-Caking Makeup Products Market (USD Million)
2025 389.84
2026 416.21
2027 444.37
2028 474.43
2029 506.52
2030 540.78
2031 577.36
2032 616.42
2033 658.12
2034 702.64
2035 750.17

The Anti-Caking Makeup Products Market in the United States is projected to grow at a CAGR of 6.4%, led by increased demand for long-wear, oil-control formulations. Everyday consumers continue to drive volume, with setting powders accounting for 41.8% of the USA product type share in 2025. Bridal and event users are also a key growth audience, favoring finishing sprays that provide high performance under lighting and extended wear conditions.

The professional makeup artist community, particularly in urban centers like New York and Los Angeles, has been instrumental in popularizing premium powders and primers through social media and training academies. Growth is also supported by a strong e-commerce ecosystem, where brands like Fenty Beauty, Laura Mercier, and NYX Professional capitalize on influencer partnerships and personalized virtual try-on tools.

  • Setting powders dominate USA demand with over USD 162.9 million in 2025.
  • Event and bridal users are increasingly adopting finishing sprays for long-wear results.
  • Influencer-led e-commerce strategies are key to reaching younger USA consumers.

Growth and Expansion Outlook for Anti-Caking Makeup Products in the United Kingdom

The Anti-Caking Makeup Products Market in the United Kingdom is expected to grow at a CAGR of 9.9%, supported by professional makeup adoption, retail innovation, and cultural event demand. London-based makeup schools and fashion shows are accelerating the use of anti-caking products for long-lasting finishes in high-performance settings. The wedding and events sector is a major growth driver, with pressed powders and primers gaining favor for extended wear during ceremonies. Additionally, UK retailers are introducing clean-label and vegan anti-caking products to align with the country’s fast-evolving sustainability and ethical consumption values.

  • Professional makeup schools and fashion circuits are expanding product usage.
  • Bridal/event sector is fueling adoption of pressed powders and primers.
  • Retailers are aligning with vegan, cruelty-free, and clean-label consumer demands.

Growth and Expansion Outlook for Anti-Caking Makeup Products in India

India is witnessing rapid growth in the Anti-Caking Makeup Products Market, which is forecast to expand at a CAGR of 17.2% through 2035, the highest among all leading markets. Rising disposable incomes and aspirational lifestyles are fueling strong adoption of setting powders and pressed powders, especially among young women in Tier-2 and Tier-3 cities. Bridal makeup remains a cornerstone of demand, with primers and finishing sprays used extensively in multi-day wedding events. Increasing influence of Bollywood and regional cinema, along with widespread access to tutorials on platforms like Instagram and YouTube, is shaping consumer preferences. E-commerce platforms such as Nykaa and Myntra have accelerated affordability and accessibility by promoting both premium international and local brands.
  • Tier-2 and Tier-3 city adoption is rising, driven by aspirational consumers.
  • Bridal and cinematic makeup culture is a major driver of demand.
  • Local e-commerce platforms are boosting both premium and affordable product access.

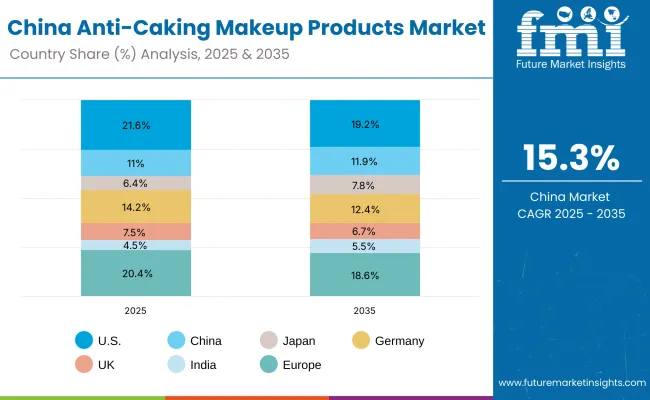
Sales Outlook for Anti-Caking Makeup Products in China

Anti Caking Makeup Products Market China

Countries 2025 Share (%)
USA 21.6%
China 11.0%
Japan 6.4%
Germany 14.2%
UK 7.5%
India 4.5%
Europe 20.4%
Countries 2035 Share (%)
USA 19.2%
China 11.9%
Japan 7.8%
Germany 12.4%
UK 6.7%
India 5.5%
Europe 18.6%

The Anti-Caking Makeup Products Market in China is expected to grow at a CAGR of 15.3%, making it one of the fastest-expanding economies in this segment. Strong momentum is driven by e-commerce dominance on Tmall and JD.com, skincare-makeup hybrid innovation, and youth-driven fashion trends. Finishing sprays and primers are gaining traction in humid regions, while setting powders remain a staple in northern provinces. Municipal interest in promoting beauty and fashion clusters has supported local innovation, while affordable but high-performing products from domestic brands are driving mass adoption. International brands like NARS and Charlotte Tilbury continue to compete by offering Asia-specific shades, translucent formulations, and lightweight textures tailored to Chinese consumers.
  • Hybrid skincare-makeup powders and sprays are driving innovation.
  • Domestic players are accelerating mass adoption through competitive pricing.
  • Online-first launches dominate, with influencers shaping consumer choices on Tmall and Douyin.

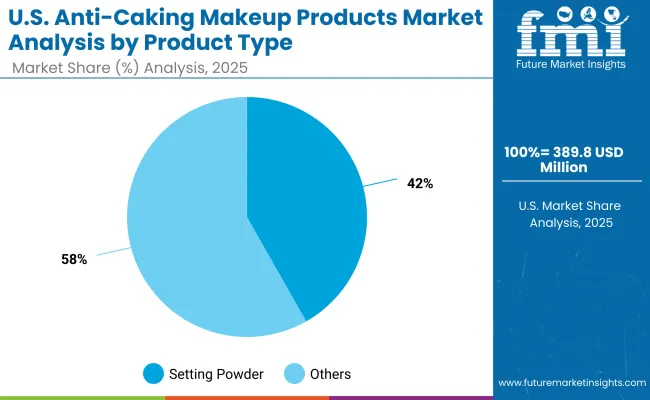
Growth Outlook for Anti-Caking Makeup Products Market in USA

Anti Caking Makeup Products Market Usa 2

USA By Product Type Value Share% 2025
Setting powders 41.8%
Others 58.2%

The Anti-Caking Makeup Products Market in the United States is projected at USD 389.8 million in 2025. Setting powders contribute 41.8%, while other categories such as primers, finishing sprays, and pressed powders together hold 58.2%, which shows a balanced product mix where consumers are diversifying beyond powders. This distribution reflects the maturity of the USA beauty industry, where long-wear sprays and primers are gaining traction due to the popularity of hybrid skincare-makeup routines.

The USA market is shaped by e-commerce leadership, with nearly half of all anti-caking sales generated through online channels in 2025. The growing appeal of finishing sprays, promoted heavily on TikTok and Instagram, underlines the trend toward multi-function, all-day wear solutions. Professional makeup artists, influencers, and bridal users amplify the demand for products that perform well under strong lighting, photography, and extended use. As clean-label and dermatologist-tested claims become more important, brands are reformulating powders with talc alternatives and lightweight finishes to address consumer concerns.
  • Market in USA holds 21.6% share in 2025 of the global market.
  • Setting powders lead with 41.8% share in product type mix.
  • Growth is supported by e-commerce, influencer culture, and long-wear innovation.

Opportunity Analysis of China Anti-Caking Makeup Products Market

Anti Caking Makeup Products Market China 2

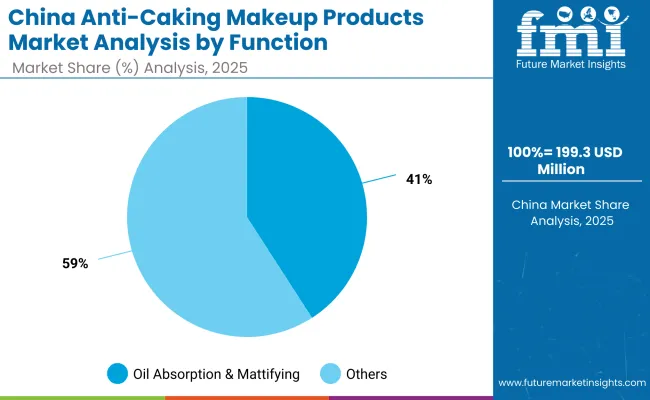
China By Function Value Share% 2025
Oil absorption & mattifying 40.9%
Others 59.1%

The Anti-Caking Makeup Products Market in China is valued at around USD 199.3 million in 2025, with oil absorption & mattifying products leading at 40.9%, followed by moisture-balancing and long-wear categories at 59.1%. The dominance of oil-control formulas directly reflects China’s humid climate conditions and the strong consumer preference for matte, poreless skin finishes. These products are also popular among younger consumers who seek camera-ready looks for social media engagement and livestream shopping.

China’s market momentum is tied closely to digital-first platforms like Tmall, JD.com, and Douyin, which drive direct-to-consumer sales and allow brands to localize formulations with great speed. Domestic brands are competing aggressively with international players by offering affordable, clean-label powders and sprays, often infused with skincare actives like niacinamide and green tea extracts. This positions China not only as a high-growth volume market but also as an innovation hub, where hybrid beauty trends are setting benchmarks for global product launches.
  • Market size for China in 2025 is USD 199.3 million.
  • Global market share is approximately 11%.
  • Oil absorption & mattifying products lead with 40.9% due to humid climate and youth-driven beauty trends.

Competitive Landscape of Anti-Caking Makeup Products Market

Anti Caking Makeup Products Market By Company

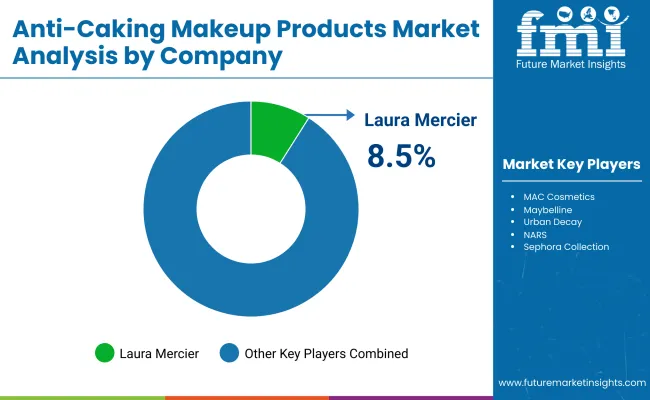
The Anti-Caking Makeup Products Market is moderately consolidated, with global leaders, prestige brands, and mass-market innovators competing across categories. Laura Mercier leads with 8.5% share, driven by its reputation as a pioneer in setting powders that deliver flawless finishes and long-lasting performance. Its flagship translucent powder has set industry benchmarks and remains a staple in professional kits worldwide.

Prestige brands such as Charlotte Tilbury, NARS, and Fenty Beauty are expanding their presence with multifunctional sprays, primers, and pressed powders that combine mattifying benefits with skincare actives. Mass brands like Maybelline and NYX Professional play a critical role in democratizing access, offering affordable yet effective powders and sprays that appeal to younger consumers and dominate drugstore channels. Retail-owned labels such as Sephora Collection enhance competitiveness through exclusive online launches and influencer collaborations

Competitive differentiation is shifting away from traditional powder quality alone toward ecosystem strategies that blend product innovation with omnichannel engagement. This includes AR-based virtual try-ons, subscription-based product bundles, and clean beauty credentials (vegan, dermatologist-tested, talc-free). As Asian markets surge, global and local brands alike are increasingly investing in region-specific textures and shades, making localization and digital-first strategies essential for competitive advantage.

Key Developments in Anti-Caking Makeup Products Market

  • On March 12, 2024, Laura Mercier reformulated its bestselling translucent setting powder with talc-free, clean-label ingredients, positioning it as a safer alternative in light of rising regulatory scrutiny in Europe and North America.
  • On May 7, 2024, Fenty Beauty launched its "We Matte Too" finishing spray, combining oil-control polymers with hydrating actives to create a dual-function anti-caking product that aligns with the skinification trend in makeup.

Scope of the Report

Item Value
Quantitative Units USD Million
Product Type Setting powders, Primers, Finishing sprays, Pressed powders
Function Oil absorption & mattifying, Moisture balancing, Long-wear finish
Channel E-commerce, Specialty beauty retail, Mass retail, Professional makeup suppliers
End User Professional makeup artists, Everyday consumers, Event/bridal users
Regions Covered North America, Europe, Asia-Pacific, Latin America, Middle East & Africa
Country Covered United States, Canada, Germany, France, United Kingdom, China, Japan, India, Brazil, South Africa
Key Companies Profiled Laura Mercier, MAC Cosmetics, Maybelline, Urban Decay, NARS, Fenty Beauty, Charlotte Tilbury, Sephora Collection, NYX Professional, Clinique
Additional Attributes Dollar sales by product type and channel, adoption trends in professional makeup and everyday consumer routines, rising demand for e-commerce and online-exclusive beauty launches, sector-specific growth in bridal, event, and professional makeup artistry, revenue segmentation by skincare-infused vs. traditional formulations, integration with AR/VR try-on technologies and digital-first retail strategies, regional trends influenced by beauty culture and sustainability claims, and innovations in setting powders, finishing sprays, and hybrid primer formulations.

Key Segments

By Product Type:

  • Setting powders
  • Primers
  • Finishing sprays
  • Pressed powders

By Function:

  • Oil absorption & mattifying
  • Moisture balancing
  • Long-wear finish

By Channel:

  • E-commerce
  • Professional makeup suppliers
  • Mass retail
  • Specialty beauty retail

By End User:

  • Professional makeup artists
  • Everyday consumers
  • Event/bridal users

By Region:

  • North America
  • Latin America
  • Europe
  • East Asia
  • South Asia & Pacific
  • Middle East and Africa

Table of Content

  1. Executive Summary
    • Global Market Outlook
    • Demand-side Trends
    • Supply-side Trends
    • Technology Roadmap Analysis
    • Analysis and Recommendations
  2. Market Overview
    • Market Coverage / Taxonomy
    • Market Definition / Scope / Limitations
  3. Market Background
    • Market Dynamics
      • Drivers
      • Restraints
      • Opportunity
      • Trends
    • Scenario Forecast
      • Demand in Optimistic Scenario
      • Demand in Likely Scenario
      • Demand in Conservative Scenario
    • Opportunity Map Analysis
    • Product Life Cycle Analysis
    • Supply Chain Analysis
      • Supply Side Participants and their Roles
        • Producers
        • Mid-Level Participants (Traders/ Agents/ Brokers)
        • Wholesalers and Distributors
      • Value Added and Value Created at Node in the Supply Chain
      • List of Raw Material Suppliers
      • List of Existing and Potential Buyer’s
    • Investment Feasibility Matrix
    • Value Chain Analysis
      • Profit Margin Analysis
      • Wholesalers and Distributors
      • Retailers
    • PESTLE and Porter’s Analysis
    • Regulatory Landscape
      • By Key Regions
      • By Key Countries
    • Regional Parent Market Outlook
    • Production and Consumption Statistics
    • Import and Export Statistics
  4. Global Market Analysis 2020 to 2024 and Forecast, 2025 to 2035
    • Historical Market Size Value (USD Million) & Volume (Units) Analysis, 2020 to 2024
    • Current and Future Market Size Value (USD Million) & Volume (Units) Projections, 2025 to 2035
      • Y-o-Y Growth Trend Analysis
      • Absolute $ Opportunity Analysis
  5. Global Market Analysis 2020 to 2024 and Forecast 2025 to 2035, By Product Type
    • Introduction / Key Findings
    • Historical Market Size Value (USD Million) & Volume (Units) Analysis By Product Type, 2020 to 2024
    • Current and Future Market Size Value (USD Million) & Volume (Units) Analysis and Forecast By Product Type, 2025 to 2035
      • Setting powders
      • Primers
      • Finishing sprays
      • Pressed powders
    • Y-o-Y Growth Trend Analysis By Product Type, 2020 to 2024
    • Absolute $ Opportunity Analysis By Product Type, 2025 to 2035
  6. Global Market Analysis 2020 to 2024 and Forecast 2025 to 2035, By Function
    • Introduction / Key Findings
    • Historical Market Size Value (USD Million) & Volume (Units) Analysis By Function, 2020 to 2024
    • Current and Future Market Size Value (USD Million) & Volume (Units) Analysis and Forecast By Function, 2025 to 2035
      • Oil absorption & mattifying
      • Moisture balancing
      • Long-wear finish
    • Y-o-Y Growth Trend Analysis By Function, 2020 to 2024
    • Absolute $ Opportunity Analysis By Function, 2025 to 2035
  7. Global Market Analysis 2020 to 2024 and Forecast 2025 to 2035, By Channel
    • Introduction / Key Findings
    • Historical Market Size Value (USD Million) & Volume (Units) Analysis By Channel, 2020 to 2024
    • Current and Future Market Size Value (USD Million) & Volume (Units) Analysis and Forecast By Channel, 2025 to 2035
      • E-commerce
      • Professional makeup suppliers
      • Mass retail
      • Specialty beauty retail
    • Y-o-Y Growth Trend Analysis By Channel, 2020 to 2024
    • Absolute $ Opportunity Analysis By Channel, 2025 to 2035
  8. Global Market Analysis 2020 to 2024 and Forecast 2025 to 2035, By End User
    • Introduction / Key Findings
    • Historical Market Size Value (USD Million) & Volume (Units) Analysis By End User, 2020 to 2024
    • Current and Future Market Size Value (USD Million) & Volume (Units) Analysis and Forecast By End User, 2025 to 2035
      • Professional makeup artists
      • Everyday consumers
      • Event/bridal users
    • Y-o-Y Growth Trend Analysis By End User, 2020 to 2024
    • Absolute $ Opportunity Analysis By End User, 2025 to 2035
  9. Global Market Analysis 2020 to 2024 and Forecast 2025 to 2035, By Region
    • Introduction
    • Historical Market Size Value (USD Million) & Volume (Units) Analysis By Region, 2020 to 2024
    • Current Market Size Value (USD Million) & Volume (Units) Analysis and Forecast By Region, 2025 to 2035
      • North America
      • Latin America
      • Europe
      • East Asia
      • South Asia & Pacific
      • Middle East and Africa
    • Market Attractiveness Analysis By Region
  10. North America Market Analysis 2020 to 2024 and Forecast 2025 to 2035, By Country
    • Historical Market Size Value (USD Million) & Volume (Units) Trend Analysis By Market Taxonomy, 2020 to 2024
    • Market Size Value (USD Million) & Volume (Units) Forecast By Market Taxonomy, 2025 to 2035
      • By Country
        • USA
        • Canada
      • By Product Type
      • By Function
      • By Channel
      • By End User
    • Market Attractiveness Analysis
      • By Country
      • By Product Type
      • By Function
      • By Channel
      • By End User
    • Key Takeaways
  11. Latin America Market Analysis 2020 to 2024 and Forecast 2025 to 2035, By Country
    • Historical Market Size Value (USD Million) & Volume (Units) Trend Analysis By Market Taxonomy, 2020 to 2024
    • Market Size Value (USD Million) & Volume (Units) Forecast By Market Taxonomy, 2025 to 2035
      • By Country
        • Brazil
        • Mexico
        • Colombia
        • Rest of Latin America
      • By Product Type
      • By Function
      • By Channel
      • By End User
    • Market Attractiveness Analysis
      • By Country
      • By Product Type
      • By Function
      • By Channel
      • By End User
    • Key Takeaways
  12. Europe Market Analysis 2020 to 2024 and Forecast 2025 to 2035, By Country
    • Historical Market Size Value (USD Million) & Volume (Units) Trend Analysis By Market Taxonomy, 2020 to 2024
    • Market Size Value (USD Million) & Volume (Units) Forecast By Market Taxonomy, 2025 to 2035
      • By Country
        • Germany
        • UK
        • France
        • Italy
        • Spain
        • Belgium
        • Netherlands
        • Nordic
        • Switzerland
        • Russia
        • Poland
        • Rest of Europe
      • By Product Type
      • By Function
      • By Channel
      • By End User
    • Market Attractiveness Analysis
      • By Country
      • By Product Type
      • By Function
      • By Channel
      • By End User
    • Key Takeaways
  13. East Asia Market Analysis 2020 to 2024 and Forecast 2025 to 2035, By Country
    • Historical Market Size Value (USD Million) & Volume (Units) Trend Analysis By Market Taxonomy, 2020 to 2024
    • Market Size Value (USD Million) & Volume (Units) Forecast By Market Taxonomy, 2025 to 2035
      • By Country
        • China
        • Japan
        • South Korea
      • By Product Type
      • By Function
      • By Channel
      • By End User
    • Market Attractiveness Analysis
      • By Country
      • By Product Type
      • By Function
      • By Channel
      • By End User
    • Key Takeaways
  14. South Asia & Pacific Market Analysis 2020 to 2024 and Forecast 2025 to 2035, By Country
    • Historical Market Size Value (USD Million) & Volume (Units) Trend Analysis By Market Taxonomy, 2020 to 2024
    • Market Size Value (USD Million) & Volume (Units) Forecast By Market Taxonomy, 2025 to 2035
      • By Country
        • India
        • Thailand
        • Malaysia
        • Indonesia
        • Singapore
        • Vietnam
        • Australia
        • New Zealand
        • Rest of South Asia
      • By Product Type
      • By Function
      • By Channel
      • By End User
    • Market Attractiveness Analysis
      • By Country
      • By Product Type
      • By Function
      • By Channel
      • By End User
    • Key Takeaways
  15. Middle East and Africa Market Analysis 2020 to 2024 and Forecast 2025 to 2035, By Country
    • Historical Market Size Value (USD Million) & Volume (Units) Trend Analysis By Market Taxonomy, 2020 to 2024
    • Market Size Value (USD Million) & Volume (Units) Forecast By Market Taxonomy, 2025 to 2035
      • By Country
        • Turkey
        • UAE
        • Saudi Arabia
        • Israel
        • Other GCC Countries
        • North Africa
        • South Africa
      • By Product Type
      • By Function
      • By Channel
      • By End User
    • Market Attractiveness Analysis
      • By Country
      • By Product Type
      • By Function
      • By Channel
      • By End User
    • Key Takeaways
  16. Key Countries Market Analysis
    • USA
      • Pricing Analysis
      • Market Share Analysis, 2024
        • By Product Type
        • By Function
        • By Channel
        • By End User
    • Canada
      • Pricing Analysis
      • Market Share Analysis, 2024
        • By Product Type
        • By Function
        • By Channel
        • By End User
    • Brazil
      • Pricing Analysis
      • Market Share Analysis, 2024
        • By Product Type
        • By Function
        • By Channel
        • By End User
    • Mexico
      • Pricing Analysis
      • Market Share Analysis, 2024
        • By Product Type
        • By Function
        • By Channel
        • By End User
    • Colombia
      • Pricing Analysis
      • Market Share Analysis, 2024
        • By Product Type
        • By Function
        • By Channel
        • By End User
    • Germany
      • Pricing Analysis
      • Market Share Analysis, 2024
        • By Product Type
        • By Function
        • By Channel
        • By End User
    • UK
      • Pricing Analysis
      • Market Share Analysis, 2024
        • By Product Type
        • By Function
        • By Channel
        • By End User
    • France
      • Pricing Analysis
      • Market Share Analysis, 2024
        • By Product Type
        • By Function
        • By Channel
        • By End User
    • Italy
      • Pricing Analysis
      • Market Share Analysis, 2024
        • By Product Type
        • By Function
        • By Channel
        • By End User
    • Spain
      • Pricing Analysis
      • Market Share Analysis, 2024
        • By Product Type
        • By Function
        • By Channel
        • By End User
    • Belgium
      • Pricing Analysis
      • Market Share Analysis, 2024
        • By Product Type
        • By Function
        • By Channel
        • By End User
    • Netherlands
      • Pricing Analysis
      • Market Share Analysis, 2024
        • By Product Type
        • By Function
        • By Channel
        • By End User
    • Nordic
      • Pricing Analysis
      • Market Share Analysis, 2024
        • By Product Type
        • By Function
        • By Channel
        • By End User
    • Switzerland
      • Pricing Analysis
      • Market Share Analysis, 2024
        • By Product Type
        • By Function
        • By Channel
        • By End User
    • Russia
      • Pricing Analysis
      • Market Share Analysis, 2024
        • By Product Type
        • By Function
        • By Channel
        • By End User
    • Poland
      • Pricing Analysis
      • Market Share Analysis, 2024
        • By Product Type
        • By Function
        • By Channel
        • By End User
    • China
      • Pricing Analysis
      • Market Share Analysis, 2024
        • By Product Type
        • By Function
        • By Channel
        • By End User
    • Japan
      • Pricing Analysis
      • Market Share Analysis, 2024
        • By Product Type
        • By Function
        • By Channel
        • By End User
    • South Korea
      • Pricing Analysis
      • Market Share Analysis, 2024
        • By Product Type
        • By Function
        • By Channel
        • By End User
    • India
      • Pricing Analysis
      • Market Share Analysis, 2024
        • By Product Type
        • By Function
        • By Channel
        • By End User
    • Thailand
      • Pricing Analysis
      • Market Share Analysis, 2024
        • By Product Type
        • By Function
        • By Channel
        • By End User
    • Indonesia
      • Pricing Analysis
      • Market Share Analysis, 2024
        • By Product Type
        • By Function
        • By Channel
        • By End User
    • Australia
      • Pricing Analysis
      • Market Share Analysis, 2024
        • By Product Type
        • By Function
        • By Channel
        • By End User
    • New Zealand
      • Pricing Analysis
      • Market Share Analysis, 2024
        • By Product Type
        • By Function
        • By Channel
        • By End User
    • Turkey
      • Pricing Analysis
      • Market Share Analysis, 2024
        • By Product Type
        • By Function
        • By Channel
        • By End User
    • UAE
      • Pricing Analysis
      • Market Share Analysis, 2024
        • By Product Type
        • By Function
        • By Channel
        • By End User
    • Saudi Arabia
      • Pricing Analysis
      • Market Share Analysis, 2024
        • By Product Type
        • By Function
        • By Channel
        • By End User
    • Israel
      • Pricing Analysis
      • Market Share Analysis, 2024
        • By Product Type
        • By Function
        • By Channel
        • By End User
    • North Africa
      • Pricing Analysis
      • Market Share Analysis, 2024
        • By Product Type
        • By Function
        • By Channel
        • By End User
    • South Africa
      • Pricing Analysis
      • Market Share Analysis, 2024
        • By Product Type
        • By Function
        • By Channel
        • By End User
  17. Market Structure Analysis
    • Competition Dashboard
    • Competition Benchmarking
    • Market Share Analysis of Top Players
      • By Regional
      • By Product Type
      • By Function
      • By Channel
      • By End User
  18. Competition Analysis
    • Competition Deep Dive
      • Laura Mercier
        • Overview
        • Product Portfolio
        • Profitability by Market Segments (Product/Age /Sales Channel/Region)
        • Sales Footprint
        • Strategy Overview
          • Marketing Strategy
          • Product Strategy
          • Channel Strategy
      • MAC Cosmetics
        • Overview
        • Product Portfolio
        • Profitability by Market Segments (Product/Age /Sales Channel/Region)
        • Sales Footprint
        • Strategy Overview
          • Marketing Strategy
          • Product Strategy
          • Channel Strategy
      • Maybelline
        • Overview
        • Product Portfolio
        • Profitability by Market Segments (Product/Age /Sales Channel/Region)
        • Sales Footprint
        • Strategy Overview
          • Marketing Strategy
          • Product Strategy
          • Channel Strategy
      • Urban Decay
        • Overview
        • Product Portfolio
        • Profitability by Market Segments (Product/Age /Sales Channel/Region)
        • Sales Footprint
        • Strategy Overview
          • Marketing Strategy
          • Product Strategy
          • Channel Strategy
      • NARS
        • Overview
        • Product Portfolio
        • Profitability by Market Segments (Product/Age /Sales Channel/Region)
        • Sales Footprint
        • Strategy Overview
          • Marketing Strategy
          • Product Strategy
          • Channel Strategy
      • Fenty Beauty
        • Overview
        • Product Portfolio
        • Profitability by Market Segments (Product/Age /Sales Channel/Region)
        • Sales Footprint
        • Strategy Overview
          • Marketing Strategy
          • Product Strategy
          • Channel Strategy
      • Charlotte Tilbury
        • Overview
        • Product Portfolio
        • Profitability by Market Segments (Product/Age /Sales Channel/Region)
        • Sales Footprint
        • Strategy Overview
          • Marketing Strategy
          • Product Strategy
          • Channel Strategy
      • Sephora Collection
        • Overview
        • Product Portfolio
        • Profitability by Market Segments (Product/Age /Sales Channel/Region)
        • Sales Footprint
        • Strategy Overview
          • Marketing Strategy
          • Product Strategy
          • Channel Strategy
      • NYX Professional
        • Overview
        • Product Portfolio
        • Profitability by Market Segments (Product/Age /Sales Channel/Region)
        • Sales Footprint
        • Strategy Overview
          • Marketing Strategy
          • Product Strategy
          • Channel Strategy
      • Clinique
        • Overview
        • Product Portfolio
        • Profitability by Market Segments (Product/Age /Sales Channel/Region)
        • Sales Footprint
        • Strategy Overview
          • Marketing Strategy
          • Product Strategy
          • Channel Strategy
  19. Assumptions & Acronyms Used
  20. Research Methodology

List of Tables

  • Table 1: Global Market Value (USD Million) Forecast by Region, 2020-2035
  • Table 2: Global Market Volume (Units) Forecast by Region, 2020-2035
  • Table 3: Global Market Value (USD Million) Forecast by Product Type, 2020-2035
  • Table 4: Global Market Volume (Units) Forecast by Product Type, 2020-2035
  • Table 5: Global Market Value (USD Million) Forecast by Function, 2020-2035
  • Table 6: Global Market Volume (Units) Forecast by Function, 2020-2035
  • Table 7: Global Market Value (USD Million) Forecast by Channel, 2020-2035
  • Table 8: Global Market Volume (Units) Forecast by Channel, 2020-2035
  • Table 9: Global Market Value (USD Million) Forecast by End User, 2020-2035
  • Table 10: Global Market Volume (Units) Forecast by End User, 2020-2035
  • Table 11: North America Market Value (USD Million) Forecast by Country, 2020-2035
  • Table 12: North America Market Volume (Units) Forecast by Country, 2020-2035
  • Table 13: North America Market Value (USD Million) Forecast by Product Type, 2020-2035
  • Table 14: North America Market Volume (Units) Forecast by Product Type, 2020-2035
  • Table 15: North America Market Value (USD Million) Forecast by Function, 2020-2035
  • Table 16: North America Market Volume (Units) Forecast by Function, 2020-2035
  • Table 17: North America Market Value (USD Million) Forecast by Channel, 2020-2035
  • Table 18: North America Market Volume (Units) Forecast by Channel, 2020-2035
  • Table 19: North America Market Value (USD Million) Forecast by End User, 2020-2035
  • Table 20: North America Market Volume (Units) Forecast by End User, 2020-2035
  • Table 21: Latin America Market Value (USD Million) Forecast by Country, 2020-2035
  • Table 22: Latin America Market Volume (Units) Forecast by Country, 2020-2035
  • Table 23: Latin America Market Value (USD Million) Forecast by Product Type, 2020-2035
  • Table 24: Latin America Market Volume (Units) Forecast by Product Type, 2020-2035
  • Table 25: Latin America Market Value (USD Million) Forecast by Function, 2020-2035
  • Table 26: Latin America Market Volume (Units) Forecast by Function, 2020-2035
  • Table 27: Latin America Market Value (USD Million) Forecast by Channel, 2020-2035
  • Table 28: Latin America Market Volume (Units) Forecast by Channel, 2020-2035
  • Table 29: Latin America Market Value (USD Million) Forecast by End User, 2020-2035
  • Table 30: Latin America Market Volume (Units) Forecast by End User, 2020-2035
  • Table 31: Europe Market Value (USD Million) Forecast by Country, 2020-2035
  • Table 32: Europe Market Volume (Units) Forecast by Country, 2020-2035
  • Table 33: Europe Market Value (USD Million) Forecast by Product Type, 2020-2035
  • Table 34: Europe Market Volume (Units) Forecast by Product Type, 2020-2035
  • Table 35: Europe Market Value (USD Million) Forecast by Function, 2020-2035
  • Table 36: Europe Market Volume (Units) Forecast by Function, 2020-2035
  • Table 37: Europe Market Value (USD Million) Forecast by Channel, 2020-2035
  • Table 38: Europe Market Volume (Units) Forecast by Channel, 2020-2035
  • Table 39: Europe Market Value (USD Million) Forecast by End User, 2020-2035
  • Table 40: Europe Market Volume (Units) Forecast by End User, 2020-2035
  • Table 41: East Asia Market Value (USD Million) Forecast by Country, 2020-2035
  • Table 42: East Asia Market Volume (Units) Forecast by Country, 2020-2035
  • Table 43: East Asia Market Value (USD Million) Forecast by Product Type, 2020-2035
  • Table 44: East Asia Market Volume (Units) Forecast by Product Type, 2020-2035
  • Table 45: East Asia Market Value (USD Million) Forecast by Function, 2020-2035
  • Table 46: East Asia Market Volume (Units) Forecast by Function, 2020-2035
  • Table 47: East Asia Market Value (USD Million) Forecast by Channel, 2020-2035
  • Table 48: East Asia Market Volume (Units) Forecast by Channel, 2020-2035
  • Table 49: East Asia Market Value (USD Million) Forecast by End User, 2020-2035
  • Table 50: East Asia Market Volume (Units) Forecast by End User, 2020-2035
  • Table 51: South Asia & Pacific Market Value (USD Million) Forecast by Country, 2020-2035
  • Table 52: South Asia & Pacific Market Volume (Units) Forecast by Country, 2020-2035
  • Table 53: South Asia & Pacific Market Value (USD Million) Forecast by Product Type, 2020-2035
  • Table 54: South Asia & Pacific Market Volume (Units) Forecast by Product Type, 2020-2035
  • Table 55: South Asia & Pacific Market Value (USD Million) Forecast by Function, 2020-2035
  • Table 56: South Asia & Pacific Market Volume (Units) Forecast by Function, 2020-2035
  • Table 57: South Asia & Pacific Market Value (USD Million) Forecast by Channel, 2020-2035
  • Table 58: South Asia & Pacific Market Volume (Units) Forecast by Channel, 2020-2035
  • Table 59: South Asia & Pacific Market Value (USD Million) Forecast by End User, 2020-2035
  • Table 60: South Asia & Pacific Market Volume (Units) Forecast by End User, 2020-2035
  • Table 61: Middle East and Africa Market Value (USD Million) Forecast by Country, 2020-2035
  • Table 62: Middle East and Africa Market Volume (Units) Forecast by Country, 2020-2035
  • Table 63: Middle East and Africa Market Value (USD Million) Forecast by Product Type, 2020-2035
  • Table 64: Middle East and Africa Market Volume (Units) Forecast by Product Type, 2020-2035
  • Table 65: Middle East and Africa Market Value (USD Million) Forecast by Function, 2020-2035
  • Table 66: Middle East and Africa Market Volume (Units) Forecast by Function, 2020-2035
  • Table 67: Middle East and Africa Market Value (USD Million) Forecast by Channel, 2020-2035
  • Table 68: Middle East and Africa Market Volume (Units) Forecast by Channel, 2020-2035
  • Table 69: Middle East and Africa Market Value (USD Million) Forecast by End User, 2020-2035
  • Table 70: Middle East and Africa Market Volume (Units) Forecast by End User, 2020-2035

List of Figures

  • Figure 1: Global Market Value (USD Million) by Product Type, 2025-2035
  • Figure 2: Global Market Value (USD Million) by Function, 2025-2035
  • Figure 3: Global Market Value (USD Million) by Channel, 2025-2035
  • Figure 4: Global Market Value (USD Million) by End User, 2025-2035
  • Figure 5: Global Market Value (USD Million) by Region, 2025-2035
  • Figure 6: Global Market Value (USD Million) Analysis by Region, 2020-2035
  • Figure 7: Global Market Volume (Units) Analysis by Region, 2020-2035
  • Figure 8: Global Market Value Share (%) and BPS Analysis by Region, 2025-2035
  • Figure 9: Global Market Y-o-Y Growth (%) Projections by Region, 2025-2035
  • Figure 10: Global Market Value (USD Million) Analysis by Product Type, 2020-2035
  • Figure 11: Global Market Volume (Units) Analysis by Product Type, 2020-2035
  • Figure 12: Global Market Value Share (%) and BPS Analysis by Product Type, 2025-2035
  • Figure 13: Global Market Y-o-Y Growth (%) Projections by Product Type, 2025-2035
  • Figure 14: Global Market Value (USD Million) Analysis by Function, 2020-2035
  • Figure 15: Global Market Volume (Units) Analysis by Function, 2020-2035
  • Figure 16: Global Market Value Share (%) and BPS Analysis by Function, 2025-2035
  • Figure 17: Global Market Y-o-Y Growth (%) Projections by Function, 2025-2035
  • Figure 18: Global Market Value (USD Million) Analysis by Channel, 2020-2035
  • Figure 19: Global Market Volume (Units) Analysis by Channel, 2020-2035
  • Figure 20: Global Market Value Share (%) and BPS Analysis by Channel, 2025-2035
  • Figure 21: Global Market Y-o-Y Growth (%) Projections by Channel, 2025-2035
  • Figure 22: Global Market Value (USD Million) Analysis by End User, 2020-2035
  • Figure 23: Global Market Volume (Units) Analysis by End User, 2020-2035
  • Figure 24: Global Market Value Share (%) and BPS Analysis by End User, 2025-2035
  • Figure 25: Global Market Y-o-Y Growth (%) Projections by End User, 2025-2035
  • Figure 26: Global Market Attractiveness by Product Type, 2025-2035
  • Figure 27: Global Market Attractiveness by Function, 2025-2035
  • Figure 28: Global Market Attractiveness by Channel, 2025-2035
  • Figure 29: Global Market Attractiveness by End User, 2025-2035
  • Figure 30: Global Market Attractiveness by Region, 2025-2035
  • Figure 31: North America Market Value (USD Million) by Product Type, 2025-2035
  • Figure 32: North America Market Value (USD Million) by Function, 2025-2035
  • Figure 33: North America Market Value (USD Million) by Channel, 2025-2035
  • Figure 34: North America Market Value (USD Million) by End User, 2025-2035
  • Figure 35: North America Market Value (USD Million) by Country, 2025-2035
  • Figure 36: North America Market Value (USD Million) Analysis by Country, 2020-2035
  • Figure 37: North America Market Volume (Units) Analysis by Country, 2020-2035
  • Figure 38: North America Market Value Share (%) and BPS Analysis by Country, 2025-2035
  • Figure 39: North America Market Y-o-Y Growth (%) Projections by Country, 2025-2035
  • Figure 40: North America Market Value (USD Million) Analysis by Product Type, 2020-2035
  • Figure 41: North America Market Volume (Units) Analysis by Product Type, 2020-2035
  • Figure 42: North America Market Value Share (%) and BPS Analysis by Product Type, 2025-2035
  • Figure 43: North America Market Y-o-Y Growth (%) Projections by Product Type, 2025-2035
  • Figure 44: North America Market Value (USD Million) Analysis by Function, 2020-2035
  • Figure 45: North America Market Volume (Units) Analysis by Function, 2020-2035
  • Figure 46: North America Market Value Share (%) and BPS Analysis by Function, 2025-2035
  • Figure 47: North America Market Y-o-Y Growth (%) Projections by Function, 2025-2035
  • Figure 48: North America Market Value (USD Million) Analysis by Channel, 2020-2035
  • Figure 49: North America Market Volume (Units) Analysis by Channel, 2020-2035
  • Figure 50: North America Market Value Share (%) and BPS Analysis by Channel, 2025-2035
  • Figure 51: North America Market Y-o-Y Growth (%) Projections by Channel, 2025-2035
  • Figure 52: North America Market Value (USD Million) Analysis by End User, 2020-2035
  • Figure 53: North America Market Volume (Units) Analysis by End User, 2020-2035
  • Figure 54: North America Market Value Share (%) and BPS Analysis by End User, 2025-2035
  • Figure 55: North America Market Y-o-Y Growth (%) Projections by End User, 2025-2035
  • Figure 56: North America Market Attractiveness by Product Type, 2025-2035
  • Figure 57: North America Market Attractiveness by Function, 2025-2035
  • Figure 58: North America Market Attractiveness by Channel, 2025-2035
  • Figure 59: North America Market Attractiveness by End User, 2025-2035
  • Figure 60: North America Market Attractiveness by Country, 2025-2035
  • Figure 61: Latin America Market Value (USD Million) by Product Type, 2025-2035
  • Figure 62: Latin America Market Value (USD Million) by Function, 2025-2035
  • Figure 63: Latin America Market Value (USD Million) by Channel, 2025-2035
  • Figure 64: Latin America Market Value (USD Million) by End User, 2025-2035
  • Figure 65: Latin America Market Value (USD Million) by Country, 2025-2035
  • Figure 66: Latin America Market Value (USD Million) Analysis by Country, 2020-2035
  • Figure 67: Latin America Market Volume (Units) Analysis by Country, 2020-2035
  • Figure 68: Latin America Market Value Share (%) and BPS Analysis by Country, 2025-2035
  • Figure 69: Latin America Market Y-o-Y Growth (%) Projections by Country, 2025-2035
  • Figure 70: Latin America Market Value (USD Million) Analysis by Product Type, 2020-2035
  • Figure 71: Latin America Market Volume (Units) Analysis by Product Type, 2020-2035
  • Figure 72: Latin America Market Value Share (%) and BPS Analysis by Product Type, 2025-2035
  • Figure 73: Latin America Market Y-o-Y Growth (%) Projections by Product Type, 2025-2035
  • Figure 74: Latin America Market Value (USD Million) Analysis by Function, 2020-2035
  • Figure 75: Latin America Market Volume (Units) Analysis by Function, 2020-2035
  • Figure 76: Latin America Market Value Share (%) and BPS Analysis by Function, 2025-2035
  • Figure 77: Latin America Market Y-o-Y Growth (%) Projections by Function, 2025-2035
  • Figure 78: Latin America Market Value (USD Million) Analysis by Channel, 2020-2035
  • Figure 79: Latin America Market Volume (Units) Analysis by Channel, 2020-2035
  • Figure 80: Latin America Market Value Share (%) and BPS Analysis by Channel, 2025-2035
  • Figure 81: Latin America Market Y-o-Y Growth (%) Projections by Channel, 2025-2035
  • Figure 82: Latin America Market Value (USD Million) Analysis by End User, 2020-2035
  • Figure 83: Latin America Market Volume (Units) Analysis by End User, 2020-2035
  • Figure 84: Latin America Market Value Share (%) and BPS Analysis by End User, 2025-2035
  • Figure 85: Latin America Market Y-o-Y Growth (%) Projections by End User, 2025-2035
  • Figure 86: Latin America Market Attractiveness by Product Type, 2025-2035
  • Figure 87: Latin America Market Attractiveness by Function, 2025-2035
  • Figure 88: Latin America Market Attractiveness by Channel, 2025-2035
  • Figure 89: Latin America Market Attractiveness by End User, 2025-2035
  • Figure 90: Latin America Market Attractiveness by Country, 2025-2035
  • Figure 91: Europe Market Value (USD Million) by Product Type, 2025-2035
  • Figure 92: Europe Market Value (USD Million) by Function, 2025-2035
  • Figure 93: Europe Market Value (USD Million) by Channel, 2025-2035
  • Figure 94: Europe Market Value (USD Million) by End User, 2025-2035
  • Figure 95: Europe Market Value (USD Million) by Country, 2025-2035
  • Figure 96: Europe Market Value (USD Million) Analysis by Country, 2020-2035
  • Figure 97: Europe Market Volume (Units) Analysis by Country, 2020-2035
  • Figure 98: Europe Market Value Share (%) and BPS Analysis by Country, 2025-2035
  • Figure 99: Europe Market Y-o-Y Growth (%) Projections by Country, 2025-2035
  • Figure 100: Europe Market Value (USD Million) Analysis by Product Type, 2020-2035
  • Figure 101: Europe Market Volume (Units) Analysis by Product Type, 2020-2035
  • Figure 102: Europe Market Value Share (%) and BPS Analysis by Product Type, 2025-2035
  • Figure 103: Europe Market Y-o-Y Growth (%) Projections by Product Type, 2025-2035
  • Figure 104: Europe Market Value (USD Million) Analysis by Function, 2020-2035
  • Figure 105: Europe Market Volume (Units) Analysis by Function, 2020-2035
  • Figure 106: Europe Market Value Share (%) and BPS Analysis by Function, 2025-2035
  • Figure 107: Europe Market Y-o-Y Growth (%) Projections by Function, 2025-2035
  • Figure 108: Europe Market Value (USD Million) Analysis by Channel, 2020-2035
  • Figure 109: Europe Market Volume (Units) Analysis by Channel, 2020-2035
  • Figure 110: Europe Market Value Share (%) and BPS Analysis by Channel, 2025-2035
  • Figure 111: Europe Market Y-o-Y Growth (%) Projections by Channel, 2025-2035
  • Figure 112: Europe Market Value (USD Million) Analysis by End User, 2020-2035
  • Figure 113: Europe Market Volume (Units) Analysis by End User, 2020-2035
  • Figure 114: Europe Market Value Share (%) and BPS Analysis by End User, 2025-2035
  • Figure 115: Europe Market Y-o-Y Growth (%) Projections by End User, 2025-2035
  • Figure 116: Europe Market Attractiveness by Product Type, 2025-2035
  • Figure 117: Europe Market Attractiveness by Function, 2025-2035
  • Figure 118: Europe Market Attractiveness by Channel, 2025-2035
  • Figure 119: Europe Market Attractiveness by End User, 2025-2035
  • Figure 120: Europe Market Attractiveness by Country, 2025-2035
  • Figure 121: East Asia Market Value (USD Million) by Product Type, 2025-2035
  • Figure 122: East Asia Market Value (USD Million) by Function, 2025-2035
  • Figure 123: East Asia Market Value (USD Million) by Channel, 2025-2035
  • Figure 124: East Asia Market Value (USD Million) by End User, 2025-2035
  • Figure 125: East Asia Market Value (USD Million) by Country, 2025-2035
  • Figure 126: East Asia Market Value (USD Million) Analysis by Country, 2020-2035
  • Figure 127: East Asia Market Volume (Units) Analysis by Country, 2020-2035
  • Figure 128: East Asia Market Value Share (%) and BPS Analysis by Country, 2025-2035
  • Figure 129: East Asia Market Y-o-Y Growth (%) Projections by Country, 2025-2035
  • Figure 130: East Asia Market Value (USD Million) Analysis by Product Type, 2020-2035
  • Figure 131: East Asia Market Volume (Units) Analysis by Product Type, 2020-2035
  • Figure 132: East Asia Market Value Share (%) and BPS Analysis by Product Type, 2025-2035
  • Figure 133: East Asia Market Y-o-Y Growth (%) Projections by Product Type, 2025-2035
  • Figure 134: East Asia Market Value (USD Million) Analysis by Function, 2020-2035
  • Figure 135: East Asia Market Volume (Units) Analysis by Function, 2020-2035
  • Figure 136: East Asia Market Value Share (%) and BPS Analysis by Function, 2025-2035
  • Figure 137: East Asia Market Y-o-Y Growth (%) Projections by Function, 2025-2035
  • Figure 138: East Asia Market Value (USD Million) Analysis by Channel, 2020-2035
  • Figure 139: East Asia Market Volume (Units) Analysis by Channel, 2020-2035
  • Figure 140: East Asia Market Value Share (%) and BPS Analysis by Channel, 2025-2035
  • Figure 141: East Asia Market Y-o-Y Growth (%) Projections by Channel, 2025-2035
  • Figure 142: East Asia Market Value (USD Million) Analysis by End User, 2020-2035
  • Figure 143: East Asia Market Volume (Units) Analysis by End User, 2020-2035
  • Figure 144: East Asia Market Value Share (%) and BPS Analysis by End User, 2025-2035
  • Figure 145: East Asia Market Y-o-Y Growth (%) Projections by End User, 2025-2035
  • Figure 146: East Asia Market Attractiveness by Product Type, 2025-2035
  • Figure 147: East Asia Market Attractiveness by Function, 2025-2035
  • Figure 148: East Asia Market Attractiveness by Channel, 2025-2035
  • Figure 149: East Asia Market Attractiveness by End User, 2025-2035
  • Figure 150: East Asia Market Attractiveness by Country, 2025-2035
  • Figure 151: South Asia & Pacific Market Value (USD Million) by Product Type, 2025-2035
  • Figure 152: South Asia & Pacific Market Value (USD Million) by Function, 2025-2035
  • Figure 153: South Asia & Pacific Market Value (USD Million) by Channel, 2025-2035
  • Figure 154: South Asia & Pacific Market Value (USD Million) by End User, 2025-2035
  • Figure 155: South Asia & Pacific Market Value (USD Million) by Country, 2025-2035
  • Figure 156: South Asia & Pacific Market Value (USD Million) Analysis by Country, 2020-2035
  • Figure 157: South Asia & Pacific Market Volume (Units) Analysis by Country, 2020-2035
  • Figure 158: South Asia & Pacific Market Value Share (%) and BPS Analysis by Country, 2025-2035
  • Figure 159: South Asia & Pacific Market Y-o-Y Growth (%) Projections by Country, 2025-2035
  • Figure 160: South Asia & Pacific Market Value (USD Million) Analysis by Product Type, 2020-2035
  • Figure 161: South Asia & Pacific Market Volume (Units) Analysis by Product Type, 2020-2035
  • Figure 162: South Asia & Pacific Market Value Share (%) and BPS Analysis by Product Type, 2025-2035
  • Figure 163: South Asia & Pacific Market Y-o-Y Growth (%) Projections by Product Type, 2025-2035
  • Figure 164: South Asia & Pacific Market Value (USD Million) Analysis by Function, 2020-2035
  • Figure 165: South Asia & Pacific Market Volume (Units) Analysis by Function, 2020-2035
  • Figure 166: South Asia & Pacific Market Value Share (%) and BPS Analysis by Function, 2025-2035
  • Figure 167: South Asia & Pacific Market Y-o-Y Growth (%) Projections by Function, 2025-2035
  • Figure 168: South Asia & Pacific Market Value (USD Million) Analysis by Channel, 2020-2035
  • Figure 169: South Asia & Pacific Market Volume (Units) Analysis by Channel, 2020-2035
  • Figure 170: South Asia & Pacific Market Value Share (%) and BPS Analysis by Channel, 2025-2035
  • Figure 171: South Asia & Pacific Market Y-o-Y Growth (%) Projections by Channel, 2025-2035
  • Figure 172: South Asia & Pacific Market Value (USD Million) Analysis by End User, 2020-2035
  • Figure 173: South Asia & Pacific Market Volume (Units) Analysis by End User, 2020-2035
  • Figure 174: South Asia & Pacific Market Value Share (%) and BPS Analysis by End User, 2025-2035
  • Figure 175: South Asia & Pacific Market Y-o-Y Growth (%) Projections by End User, 2025-2035
  • Figure 176: South Asia & Pacific Market Attractiveness by Product Type, 2025-2035
  • Figure 177: South Asia & Pacific Market Attractiveness by Function, 2025-2035
  • Figure 178: South Asia & Pacific Market Attractiveness by Channel, 2025-2035
  • Figure 179: South Asia & Pacific Market Attractiveness by End User, 2025-2035
  • Figure 180: South Asia & Pacific Market Attractiveness by Country, 2025-2035
  • Figure 181: Middle East and Africa Market Value (USD Million) by Product Type, 2025-2035
  • Figure 182: Middle East and Africa Market Value (USD Million) by Function, 2025-2035
  • Figure 183: Middle East and Africa Market Value (USD Million) by Channel, 2025-2035
  • Figure 184: Middle East and Africa Market Value (USD Million) by End User, 2025-2035
  • Figure 185: Middle East and Africa Market Value (USD Million) by Country, 2025-2035
  • Figure 186: Middle East and Africa Market Value (USD Million) Analysis by Country, 2020-2035
  • Figure 187: Middle East and Africa Market Volume (Units) Analysis by Country, 2020-2035
  • Figure 188: Middle East and Africa Market Value Share (%) and BPS Analysis by Country, 2025-2035
  • Figure 189: Middle East and Africa Market Y-o-Y Growth (%) Projections by Country, 2025-2035
  • Figure 190: Middle East and Africa Market Value (USD Million) Analysis by Product Type, 2020-2035
  • Figure 191: Middle East and Africa Market Volume (Units) Analysis by Product Type, 2020-2035
  • Figure 192: Middle East and Africa Market Value Share (%) and BPS Analysis by Product Type, 2025-2035
  • Figure 193: Middle East and Africa Market Y-o-Y Growth (%) Projections by Product Type, 2025-2035
  • Figure 194: Middle East and Africa Market Value (USD Million) Analysis by Function, 2020-2035
  • Figure 195: Middle East and Africa Market Volume (Units) Analysis by Function, 2020-2035
  • Figure 196: Middle East and Africa Market Value Share (%) and BPS Analysis by Function, 2025-2035
  • Figure 197: Middle East and Africa Market Y-o-Y Growth (%) Projections by Function, 2025-2035
  • Figure 198: Middle East and Africa Market Value (USD Million) Analysis by Channel, 2020-2035
  • Figure 199: Middle East and Africa Market Volume (Units) Analysis by Channel, 2020-2035
  • Figure 200: Middle East and Africa Market Value Share (%) and BPS Analysis by Channel, 2025-2035
  • Figure 201: Middle East and Africa Market Y-o-Y Growth (%) Projections by Channel, 2025-2035
  • Figure 202: Middle East and Africa Market Value (USD Million) Analysis by End User, 2020-2035
  • Figure 203: Middle East and Africa Market Volume (Units) Analysis by End User, 2020-2035
  • Figure 204: Middle East and Africa Market Value Share (%) and BPS Analysis by End User, 2025-2035
  • Figure 205: Middle East and Africa Market Y-o-Y Growth (%) Projections by End User, 2025-2035
  • Figure 206: Middle East and Africa Market Attractiveness by Product Type, 2025-2035
  • Figure 207: Middle East and Africa Market Attractiveness by Function, 2025-2035
  • Figure 208: Middle East and Africa Market Attractiveness by Channel, 2025-2035
  • Figure 209: Middle East and Africa Market Attractiveness by End User, 2025-2035
  • Figure 210: Middle East and Africa Market Attractiveness by Country, 2025-2035

Frequently Asked Questions

How big is the Anti-Caking Makeup Products Market in 2025?

The Anti-Caking Makeup Products Market is estimated to be valued at USD 1,803.7 million in 2025.

What will be the size of the Anti-Caking Makeup Products Market in 2035?

The market size for the Anti-Caking Makeup Products Market is projected to reach USD 3,904.7 million by 2035.

How much will be the Anti-Caking Makeup Products Market growth between 2025 and 2035?

The Anti-Caking Makeup Products Market is expected to grow at a CAGR of 8.0% between 2025 and 2035.

What are the key product types in the Anti-Caking Makeup Products Market?

The key product types in the Anti-Caking Makeup Products Market are setting powders, primers, finishing sprays, and pressed powders.

Which function segment will contribute a significant share in the Anti-Caking Makeup Products Market in 2025?

In terms of function, the oil absorption & mattifying segment is expected to command 42.3% share in the Anti-Caking Makeup Products Market in 2025.

Explore Similar Insights

Future Market Insights

Anti-Caking Makeup Products Market

Chat With

MaRIA

Hi There, I am MaRIA, Your Market Research Intelligence Assistant. How may I help you?