Anti-Foaming Personal Care Products Market Size and Share Forecast Outlook 2025 to 2035

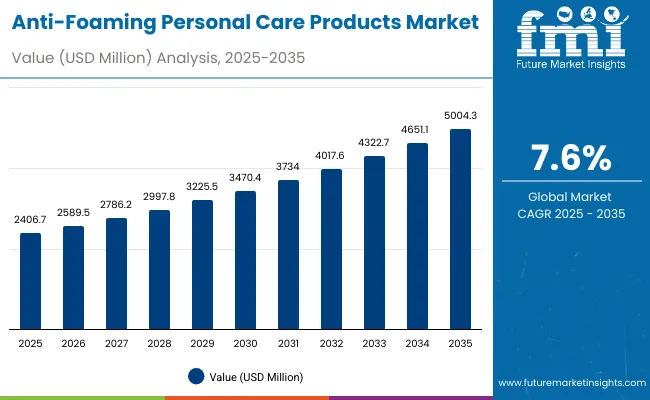
The Anti-Foaming Personal Care Products Market is expected to record a valuation of USD 2,406.7 million in 2025 and USD 5,004.3 million in 2035, with an increase of USD 2,597.6 million, which equals a growth of 193% over the decade. The overall expansion represents a CAGR of 7.6% and slightly more than a 2X increase in market size.
Quick Stats for Anti-Foaming Personal Care Products Market

  • Anti-Foaming Personal Care Products Market Value (2025): USD 2,406.7 million
  • Anti-Foaming Personal Care Products Market Forecast Value (2035): USD 5,004.3 million
  • Anti-Foaming Personal Care Products Market Forecast CAGR: 7.6%
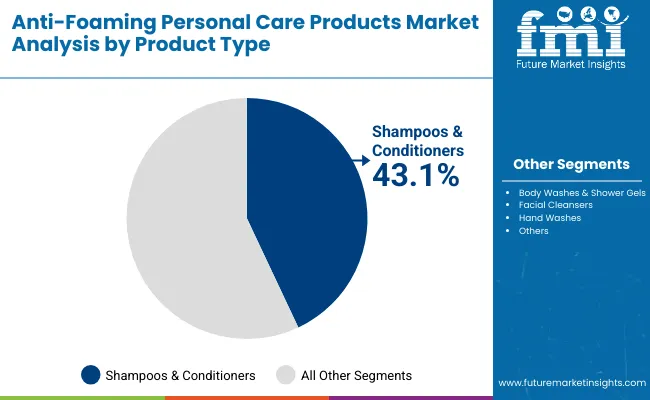
  • Leading Segment in Anti-Foaming Personal Care Products Market in 2025: Shampoos & conditioners (43.1%)
  • Key Growth Regions in the Anti-Foaming Personal Care Products Market: East Asia, South Asia & Pacific, Europe
  • Top Key Players in Anti-Foaming Personal Care Products Market: Procter & Gamble, Unilever, Johnson & Johnson, Colgate-Palmolive, Beiersdorf, L’Oréal, Henkel, Amorepacific, Shiseido, Kao Corporation

Anti Foaming Personal Care Products Market

Anti-Foaming Personal Care Products Market Key Takeaways

Metric Value
Anti-Foaming Personal Care Products Market Estimated Value in (2025E) USD 2,406.7 million
Anti-Foaming Personal Care Products Market Forecast Value in (2035F) USD 5,004.3 million
Forecast CAGR (2025 to 2035) 7.60%

During the first five-year period from 2025 to 2030, the market increases from USD 2,406.7 million to USD 3,470.4 million, adding USD 1,063.7 million, which accounts for over 40% of the total decade growth. This phase records steady adoption in shampoos, conditioners, and body wash formulations, driven by the need to reduce foam build-up while enhancing rinse-off and consumer sensory experience. Silicone-based defoamers dominate this period as they cater to over 46% of industrial and personal care applications, offering superior stability in liquid-based formulations. The rising penetration of natural oil-based defoamers is also noted, especially in premium cleansers targeting eco-conscious consumers.

The second half from 2030 to 2035 contributes USD 1,533.9 million, equal to nearly 60% of total growth, as the market jumps from USD 3,470.4 million to USD 5,004.3 million. This acceleration is powered by widespread deployment of AI-formulation platforms, ingredient innovation in polymer-based defoamers, and expansion of e-commerce channels driving premium sales. Markets such as India and China experience double-digit CAGRs, leading global demand. By the end of the decade, liquid and gel formats capture an even stronger share, while cream formulations gain momentum in niche facial care segments. Digital-first distribution models, such as subscription-based platforms and specialty personal care retail chains, emerge as key growth drivers, particularly in urban markets across Asia-Pacific.

From 2020 to 2024, the Anti-Foaming Personal Care Products Market expanded steadily from an estimated USD 1,800 million to over USD 2,300 million, driven by the dominance of traditional shampoos and conditioners where defoaming agents improved texture consistency. During this period, the competitive landscape was heavily influenced by multinational FMCG leaders controlling nearly 75% of revenue, with companies such as Procter & Gamble, Unilever, and L’Oréal focusing on hardware-centric segments like rinse-off care.

Competitive differentiation relied on formulation stability, consumer sensory experience, and product affordability, while clean-label and natural active claims were still emerging as secondary drivers. Service-led or digital-first personal care models contributed minimally to overall revenue, with e-commerce penetration below 15% of total market sales.

Demand for Anti-Foaming Personal Care Products will expand to USD 2,406.7 million in 2025, and the revenue mix will shift as natural oil-based and polymer-based defoamers grow in share beyond 53% of actives. Traditional leaders face rising competition from niche digital-first beauty brands offering sulfate-free and foam-controlled cleansers tailored for sensitive skin. Major personal care vendors are pivoting to hybrid strategies, integrating AI-based ingredient recommendation systems, cloud-driven consumer personalization, and subscription-based models to sustain market dominance.

Emerging entrants specializing in vegan-certified oils, eco-friendly formulations, and AR/VR-based virtual product trials are gaining share. The competitive advantage is moving away from low-cost, mass-market foaming solutions to ecosystem-driven offerings, digital channel presence, and clean-label claims that cater to evolving consumer lifestyles.

Why the Anti-Foaming Personal Care Products Market is growing?

Advances in formulation technology have improved stability, texture, and foam control, allowing for smoother consumer experiences across diverse product categories. Liquid formats have gained popularity due to their suitability for daily-use shampoos, conditioners, and hand washes. The rise of silicone-based defoamers has contributed to enhanced sensory profiles and real-time foam reduction during use. Industries such as hair care, skincare, and body wash formulations are driving demand for anti-foaming solutions that integrate seamlessly into existing personal care routines.

Expansion of e-commerce platforms and increased online product comparisons have fueled market growth, making niche anti-foaming formulations more visible to consumers. Innovations in natural oil-based defoamers, polymer blends, and dermatologically tested solutions are expected to open new premium application areas. Segment growth is expected to be led by shampoos & conditioners in product type, liquid formats in formulation, and silicone-based defoamers in active types due to their adaptability, proven efficacy, and ability to balance foam reduction with product sensory appeal.

Segmental Analysis

The market is segmented by product type, active type, formulation, channel, end user, and geography. Product types include shampoos & conditioners, body washes & shower gels, facial cleansers, and hand washes, highlighting the largest contributors to value growth. Active types cover silicone-based defoamers, natural oil-based defoamers, and polymer-based defoamers, catering to diverse consumer and regulatory demands. Based on formulation, the market spans liquid, gel, and cream, with liquid dominating due to widespread acceptance in rinse-off formats.

Distribution channels include supermarkets & hypermarkets, e-commerce, pharmacies & drugstores, and specialty personal care retail, which reflect evolving consumer buying behavior. End users cover adults, men, women, and children, with adult women holding a major share due to higher frequency of product adoption. Regionally, the scope spans North America, Latin America, Europe, East Asia, South Asia & Pacific, and the Middle East & Africa, with India and China emerging as the fastest-growing markets, recording CAGRs above 13%.
Insights into the Product Type Segment with Shampoos & Conditioners Leading in Market Share

Anti Foaming Personal Care Products Market By Product

Product Type Value Share% 2025
Shampoos & conditioners 43.1%
Others 56.9%

The shampoos & conditioners segment is projected to contribute 43.1% of the Anti-Foaming Personal Care Products Market revenue in 2025, maintaining its lead as the dominant product type category. This dominance is driven by consistent consumer reliance on hair care products where foam stability and control remain critical for user experience. Anti-foaming actives are increasingly being incorporated into shampoos and conditioners to prevent excessive sud formation, improve rinse-off, and reduce scalp irritation, especially in premium and dermatologically tested formulations.

The segment’s growth is further supported by rising innovations in silicone-based and natural oil-based defoamers that enhance product feel while maintaining cleansing efficacy. Compact packaging formats, premium salon lines, and increasing adoption of sulfate-free shampoos are reinforcing demand. With consumers becoming more conscious about the quality and sensory aspects of their hair care routines, shampoos & conditioners are expected to retain their position as the backbone of this market, shaping long-term revenue growth.
Insights into the Active Type Segment with Silicone-based Defoamers Dominating the Demand

Anti Foaming Personal Care Products Market By Active

Active Type Value Share% 2025
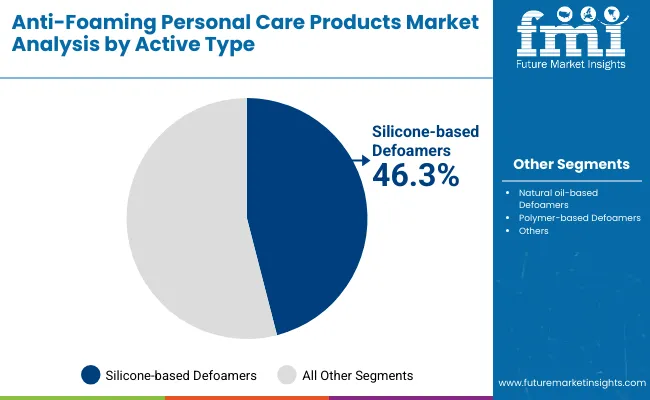
Silicone-based defoamers 46.3%
Others 53.7%

The silicone-based defoamers segment is forecasted to hold 46.3% of the market share in 2025, led by its application in shampoos, conditioners, and body washes where foam regulation is vital. These defoamers are favored for their high efficiency, chemical stability, and ability to suppress foam without impacting fragrance or formulation stability. Their compatibility with liquid and gel formats has made them essential in mass-market as well as premium product lines.

The segment’s growth is bolstered by technological advancements in silicone delivery systems that improve dispersibility and enhance long-lasting performance. Additionally, silicone-based actives are widely used in markets like the USA, Japan, and Europe where performance-driven personal care remains a priority. While natural oil-based and polymer-based alternatives are gaining ground due to sustainability preferences, silicone-based defoamers are expected to continue their dominance in the market, particularly within mainstream product categories.
Insights into the Formulation Segment with Liquid Products Leading in Market Share

Anti Foaming Personal Care Products Market By Formulation

Formulation Value Share% 2025
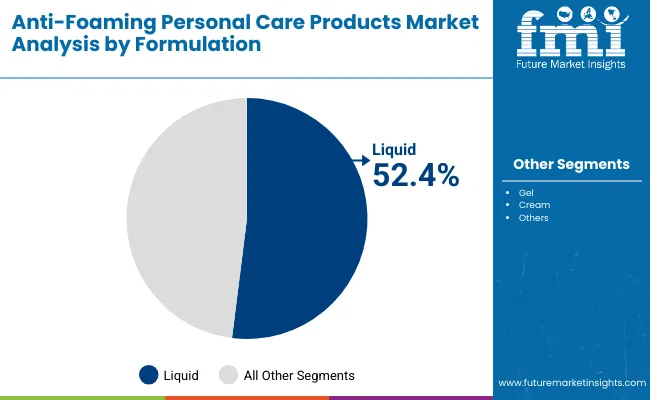
Liquid 52.4%
Others 47.6%

The liquid formulation segment is projected to account for 52.4% of the Anti-Foaming Personal Care Products Market revenue in 2025, establishing it as the leading formulation type. Liquid products are preferred due to their ease of application, wide compatibility with anti-foaming actives, and strong penetration across daily-use categories such as shampoos, conditioners, and hand washes.

The popularity of liquid formats is reinforced by their adaptability for both mass retail and e-commerce distribution, as well as their effectiveness in incorporating both silicone-based and natural oil-based defoamers. Their dominance is further strengthened by consumer trust in traditional liquid personal care products, especially in emerging markets where affordability and familiarity remain key purchase drivers. With continued innovation in natural surfactant bases and clean-label formulations, liquid formats are expected to retain leadership in the formulation segment, while gels and creams serve specialized and premium niches.

What are the Drivers, Restraints, and Key Trends of the Anti-Foaming Personal Care Products Market?

Drivers

Rising Demand for Controlled-Foam Hair Care Solutions

The strongest driver for the Anti-Foaming Personal Care Products Market is the growing consumer demand for shampoos and conditioners with controlled foam levels. Excessive foam has long been associated with residue buildup, scalp irritation, and inefficient rinse-off, especially in urban markets with hard water conditions. Brands are increasingly reformulating hair care products with silicone-based and natural oil-based defoamers to provide a balanced lather that satisfies consumer expectations while minimizing side effects. The emphasis on scalp health, sulfate-free formulations, and salon-quality product experiences has made anti-foaming actives a central differentiator in premium hair care. With shampoos & conditioners already contributing 43.1% of total value in 2025, this driver will continue to reinforce the segment’s market leadership.

E-commerce Expansion Driving Premium and Niche Product Uptake

Another driver is the rapid growth of e-commerce channels, which allow smaller, niche brands to position anti-foaming personal care products directly to consumers. Platforms such as Amazon, Tmall, and specialty beauty e-commerce sites are enabling global consumers to access low-foam facial cleansers, body washes, and dermatologically tested hand washes that may not be widely available in supermarkets. Unlike mass retail shelves, online platforms encourage ingredient transparency and highlight claims such as "foam-controlled," "sensitive-skin safe," and "clean-label." This has made it easier for polymer-based and natural oil-based defoamers to gain visibility against traditional silicone-based actives. With e-commerce forecasted to be one of the fastest-growing channels over the next decade, it is a critical growth enabler for product diversification.

Restraints

Consumer Misconception Linking Foam with Cleanliness

A major restraint in this market is the persistent consumer perception that more foam equates to better cleansing performance. In regions such as India and parts of Southeast Asia, foaming shampoos and body washes are considered more effective because of visible lather. This cultural association creates hesitation in adopting anti-foaming products, especially in price-sensitive segments where education and premium positioning are limited. While awareness is improving through dermatological recommendations and influencer campaigns, the barrier still slows adoption in markets that prioritize visual foam over long-term scalp or skin health benefits.

Regulatory Scrutiny on Silicone-based Formulations

Another restraint stems from tightening regulatory frameworks in Europe and Japan targeting silicones used in rinse-off products. Concerns about bioaccumulation of certain silicone compounds in water systems are leading to stricter guidelines on ingredient concentrations and disposal. This adds compliance costs for manufacturers and forces reformulation in markets where silicone-based defoamers currently dominate with 46.3% share in 2025. As clean-label and eco-friendly positioning becomes a competitive necessity, companies relying heavily on silicones face increased R&D pressure, which can slow scalability in cost-sensitive categories such as hand washes and mass-market body washes.

Key Trends

Shift Toward Natural Oil-Based and Polymer Alternatives

One of the most significant trends is the rising penetration of natural oil-based and polymer-based defoamers. Consumers are increasingly seeking vegan, organic-certified, and eco-friendly personal care products, leading brands to replace silicones with alternatives derived from coconut oil, sunflower oil, or biopolymer blends. These options provide defoaming benefits while aligning with sustainability and clean-label demands. Natural oil-based actives also appeal to markets such as Europe and North America, where consumers are highly ingredient-conscious. This trend is expected to reshape the market mix by 2035, with alternatives gaining share against traditional silicones, especially in facial cleansers and children’s products.

Country-Level Acceleration in India and China

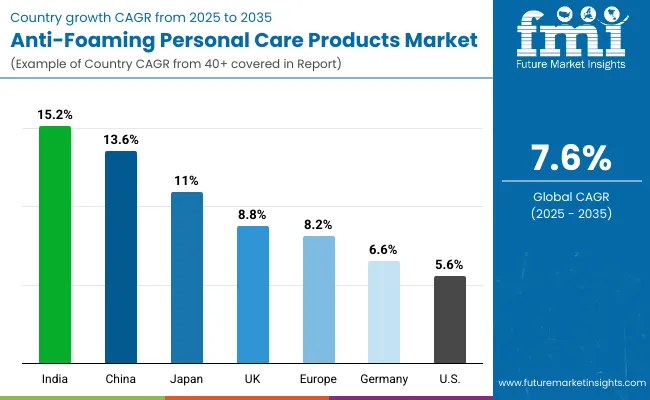
Another defining trend is the rapid acceleration in India (CAGR 15.2%) and China (CAGR 13.6%), which significantly outpaces the USA and European markets. In India, rising disposable income and urbanization are pushing consumers toward premium shampoos and sulfate-free cleansers, fueling adoption of anti-foaming solutions. In China, consumer demand is more technology-driven, with growing interest in polymer-based defoamers integrated into liquid facial cleansers and gels. Together, these two markets are transforming the global growth profile, shifting industry focus from mature Western regions to Asia-Pacific as the innovation and consumption hub. This trend underscores how geographic demand will shape product development pipelines and brand strategies across the next decade.
Analysis of Anti-Foaming Personal Care Products Market By Key Countries

Anti Foaming Personal Care Products Market By Country

Countries Estimated CAGR (2025 to 2035)
China 13.6%
USA 5.6%
India 15.2%
UK 8.8%
Germany 6.6%
Japan 11.0%
Europe 8.2%

The country-wise growth outlook of the Anti-Foaming Personal Care Products Market highlights strong divergence between mature and emerging economies. India (15.2% CAGR) and China (13.6% CAGR) stand out as the fastest-growing markets, driven by rapid urbanization, increasing disposable incomes, and heightened consumer interest in premium and sulfate-free shampoos, body washes, and facial cleansers.

Indian consumers are shifting toward dermatologically tested and low-foam solutions as awareness of scalp and skin health expands, while Chinese consumers demonstrate a preference for technologically advanced formulations, particularly those incorporating polymer-based defoamers in liquid and gel formats. Japan (11.0% CAGR) also represents a high-growth market, supported by its sophisticated beauty and personal care culture where consumers are willing to invest in innovative, foam-controlled facial cleansers and skincare-driven wash products.

In contrast, Western markets such as the USA (5.6%), Germany (6.6%), and the UK (8.8%) are expanding at slower but steady rates, reflecting the maturity of their personal care industries. Growth in these regions is largely tied to innovation in clean-label and eco-friendly product claims, regulatory compliance for silicone-based actives, and the rise of e-commerce in specialty categories. Europe as a whole is projected to record 8.2% CAGR, benefiting from sustainability-led product reformulation and consumer migration toward natural oil-based defoamers. While growth rates are modest compared to Asia-Pacific, Western markets remain highly profitable due to premium positioning, brand loyalty, and established distribution channels, ensuring they retain significant global revenue share through 2035.
Sales Outlook for Anti-Foaming Personal Care Products in the United States

Anti Foaming Personal Care Products Market Usa

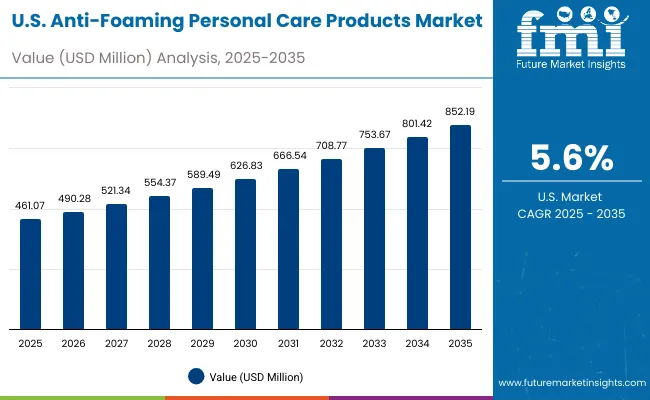
Year USA Anti-Foaming Personal Care Products Market (USD Million)
2025 461.07
2026 490.28
2027 521.34
2028 554.37
2029 589.49
2030 626.83
2031 666.54
2032 708.77
2033 753.67
2034 801.42
2035 852.19

The Anti-Foaming Personal Care Products Market in the United States is projected to grow at a CAGR of 5.6%, led by steady consumer adoption across shampoos, conditioners, and body wash categories. A key factor driving this growth is heightened demand for scalp-care-focused hair products where controlled foam levels deliver both cleansing efficiency and a smoother rinse-off.

Dermatological recommendations and consumer education campaigns are encouraging the use of low-foam facial cleansers and hand washes, which are increasingly preferred by sensitive-skin consumers. The dominance of silicone-based defoamers is visible in mainstream formats, though e-commerce-driven natural oil-based alternatives are beginning to penetrate the market. Bundling of anti-foaming formulations with clean-label, sulfate-free, and premium hair care launches is shaping competitive strategies.

  • Shampoos and conditioners account for over 42% of the market value in 2025.
  • Sensitive-skin facial cleansers are gaining visibility through dermatology-backed claims.
  • Premium brands are bundling foam-control with sulfate-free and clean-label positioning.

Growth and Expansion Outlook for Anti-Foaming Personal Care Products in the United Kingdom

The Anti-Foaming Personal Care Products Market in the United Kingdom is expected to grow at a CAGR of 8.8%, supported by strong demand for premium hair and skincare products. The UK consumer base places high importance on formulation transparency, driving increased usage of natural oil-based and polymer-based defoamers in shampoos, shower gels, and cleansers. Growth is further supported by the retail channel mix, where specialty beauty retail chains and pharmacies emphasize dermatologically tested, foam-controlled formulations. Heritage-rich personal care brands are introducing cleaner, low-foam options to meet evolving sustainability and wellness preferences.

  • Specialty beauty retailers highlight foam-controlled products for sensitive skin.
  • Premium haircare launches leverage anti-foaming agents for salon-quality performance.
  • Sustainability and clean-label claims are central to product acceptance and marketing.

Growth and Expansion Outlook for Anti-Foaming Personal Care Products in India

India is witnessing rapid growth in the Anti-Foaming Personal Care Products Market, which is forecast to expand at a CAGR of 15.2% through 2035, the highest globally. This acceleration is driven by urban middle-class consumers adopting premium shampoos and conditioners, especially those with sulfate-free and scalp-friendly claims. Rapid digital penetration and e-commerce expansion across tier-2 and tier-3 cities are allowing niche brands to scale quickly. Automotive-scale distribution networks of FMCG giants also play a role in bringing low-foam products to mass-market retail. Rising awareness about scalp irritation from excessive lather is further boosting demand.
  • Tier-2 and tier-3 city consumers are accessing low-foam products through e-commerce.
  • Premium shampoos and conditioners lead growth, supported by scalp health claims.
  • Digital-first brands are rapidly scaling with dermatologist-endorsed low-foam products.

Sales Outlook for Anti-Foaming Personal Care Products in China

Anti Foaming Personal Care Products Market China

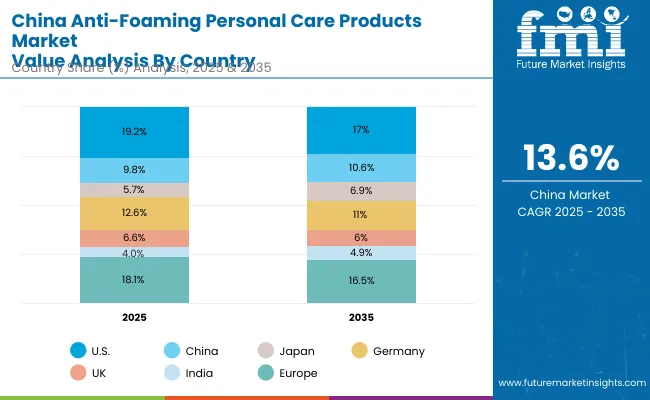
Countries 2025 Share (%)
USA 19.2%
China 9.8%
Japan 5.7%
Germany 12.6%
UK 6.6%
India 4.0%
Europe 18.1%
Countries 2035 Share (%)
USA 17.0%
China 10.6%
Japan 6.9%
Germany 11.0%
UK 6.0%
India 4.9%
Europe 16.5%

The Anti-Foaming Personal Care Products Market in China is expected to grow at a CAGR of 13.6%, among the highest worldwide. Growth momentum is driven by polymer-based and silicone-based defoamers used in facial cleansers, gels, and liquid body washes. China’s rapidly expanding premium skincare market is embracing low-foam solutions, supported by local innovation and strong digital retail ecosystems such as Tmall and JD.com. Municipal initiatives on ingredient safety and sustainability are encouraging greater adoption of natural oil-based defoamers in children’s and sensitive-skin products. Domestic companies are innovating aggressively with competitive pricing, while multinationals are focusing on premium positioning and dermatologist-backed claims.
  • Liquid facial cleansers with foam-control actives are seeing accelerated adoption.
  • Local manufacturers are competitively pricing polymer-based defoamer products.
  • E-commerce platforms enable premium and niche anti-foaming products to scale rapidly.

Growth Outlook for Anti-Foaming Personal Care Products Market in the United States

Anti Foaming Personal Care Products Market Usa 2

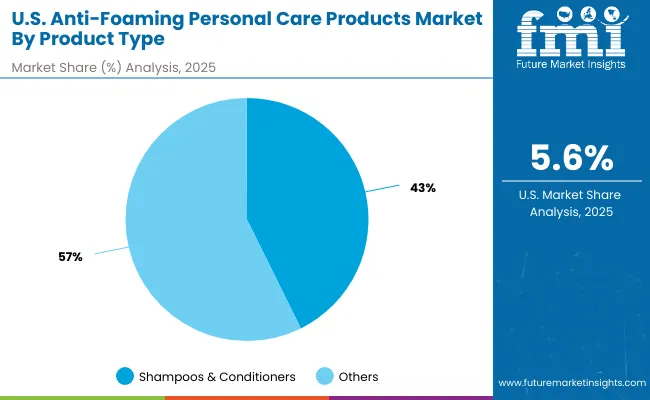
USA By Product Type Value Share% 2025
Shampoos & conditioners 42.7%
Others 57.3%

The Anti-Foaming Personal Care Products Market in the United States is projected at USD 461.07 million in 2025, with shampoos & conditioners contributing 42.7% and other formats accounting for 57.3%. This reflects the dominance of hair care products as a key revenue stream, where foam control is central to enhancing scalp comfort and product usability. Unlike traditional high-lather products, USA consumers are shifting toward balanced foam shampoos and low-foam cleansers that reduce irritation and align with dermatologist-backed claims. This shift is closely tied to rising adoption of sulfate-free and clean-label formulations across both mass retail and premium categories.

Growth in the USA is also influenced by digital-first consumer channels where e-commerce has created space for niche, foam-controlled brands to scale quickly. The incorporation of silicone-based defoamers in mainstream haircare is supported by their proven stability and performance, but natural oil-based alternatives are gaining recognition due to sustainability preferences. Over the forecast period, bundling anti-foaming features with scalp-health claims and AI-personalized recommendations is expected to reinforce competitiveness in the USA market.
  • Market in the USA contributes 19.2% global share in 2025.
  • Shampoos & conditioners dominate at 42.7% of value.
  • Growth supported by sulfate-free launches and dermatology-led awareness campaigns.

Opportunity Analysis of Anti-Foaming Personal Care Products Market in China

Anti Foaming Personal Care Products Market China 2

China By Active Type Value Share% 2025
Silicone-based defoamers 39.2%
Others 60.8%

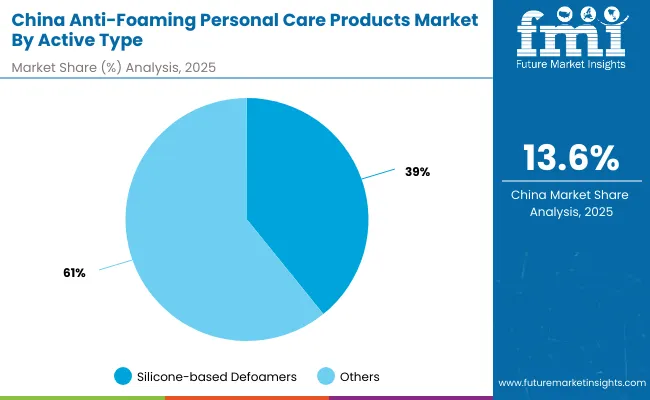
The Anti-Foaming Personal Care Products Market in China is valued at approximately USD 235-240 million in 2025, with silicone-based defoamers contributing 39.2% and other actives accounting for 60.8%. The higher share of non-silicone solutions demonstrates China’s accelerating preference for natural and polymer-based defoamers, particularly in facial cleansers and body washes marketed toward sensitive-skin users. This transition reflects the country’s growing consumer sophistication, where ingredient awareness and sustainability concerns influence purchase decisions.

China’s market momentum is further supported by e-commerce ecosystems like Tmall and JD.com, which amplify the reach of premium and niche low-foam products. Competitive local players are also disrupting the market with affordable, polymer-based innovations, making anti-foaming products more accessible to middle-class consumers. As Chinese cities advance digital-first retail and ingredient-safety regulations, the market is expected to achieve double-digit CAGR of 13.6%, driven by both premium skincare adoption and cost-effective local innovation.
  • Market size for China in 2025 is over USD 235 million.
  • Global market share is approximately 9.8% in 2025, rising to 10.6% by 2035.
  • Natural and polymer-based defoamers lead at 60.8% due to consumer demand for clean-label options.

Competitive Landscape of Anti-Foaming Personal Care Products Market

Anti Foaming Personal Care Products Market By Company

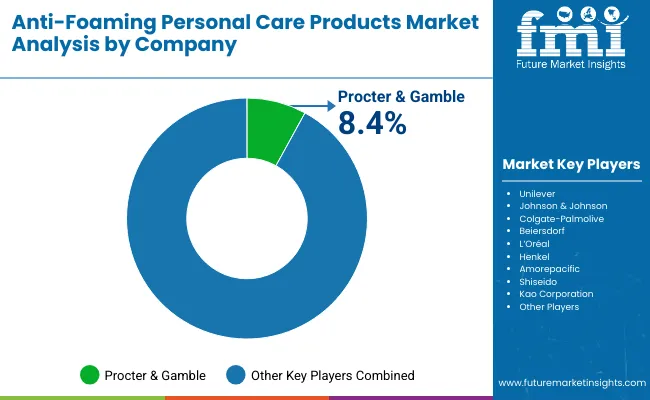
The Anti-Foaming Personal Care Products Market is moderately fragmented, with global FMCG giants, mid-sized innovators, and regional specialists competing across diverse product categories. Procter & Gamble, the global leader, holds 8.4% share in 2025, leveraging its dominance in shampoos and conditioners with sulfate-free, foam-controlled formulations. Other multinational players such as Unilever, Johnson & Johnson, Colgate-Palmolive, Beiersdorf, L’Oréal, Henkel, Amorepacific, Shiseido, and Kao Corporation collectively account for the majority of remaining global share, with strong regional portfolios. Their strategies increasingly emphasize ingredient transparency, dermatology-led claims, and digital-first product rollouts.

Mid-sized innovators are carving niches in natural oil-based and polymer-based defoamer categories, capitalizing on consumer shifts toward sustainability. Their strength lies in localized ingredient sourcing and rapid formulation turnaround, making them competitive in Asia-Pacific markets. Regional specialists in India and China are focusing on affordability and distribution expansion, particularly through pharmacies, specialty retail, and e-commerce platforms.

Competitive differentiation is shifting away from generic foaming performance toward ecosystem-driven strategies: sustainability-backed ingredient portfolios, subscription-based e-commerce models, and AI-powered personalization are now key value drivers. The competitive landscape is expected to become more dynamic as traditional leaders defend their positions against agile, clean-label entrants.

Key Developments in Anti-Foaming Personal Care Products Market

  • On March 7, 2024, Procter & Gamble reformulated its Head & Shoulders shampoo line in North America with silicone-based defoamers to deliver smoother rinse-off and reduce scalp irritation. The update was marketed as part of its "Scalp Science" campaign emphasizing foam balance and dermatologist validation.
  • On June 12, 2024, Unilever launched a new Dove body wash and shower gel series in Europe featuring natural oil-based defoamers. The line targeted eco-conscious consumers, with claims of reduced foam intensity, sulfate-free bases, and improved skin hydration.

Scope of the Report

Item Value
Quantitative Units USD Million
Product Type Shampoos & conditioners, Body washes & shower gels, Facial cleansers, Hand washes
Active Type Silicone-based defoamers, Natural oil-based defoamers, Polymer-based defoamers
Formulation Liquid, Gel, Cream
Channel Supermarkets & hypermarkets, E-commerce, Pharmacies & drugstores, Specialty personal care retail
End User Adults, Men, Women, Children
Regions Covered North America, Europe, East Asia, South Asia & Pacific, Latin America, Middle East & Africa
Country Covered United States, Canada, Germany, France, United Kingdom, China, Japan, India, Brazil, South Africa
Key Companies Profiled Procter & Gamble, Unilever, Johnson & Johnson, Colgate-Palmolive, Beiersdorf, L’Oréal, Henkel, Amorepacific, Shiseido, Kao Corporation
Additional Attributes Dollar sales by product type and active type, adoption trends in shampoos & conditioners and facial cleansers, rising demand for liquid and low-foam formats, sector-specific growth in premium haircare, skincare, and hygiene products, channel expansion through e-commerce and specialty retail, software-like recurring revenue from subscription-based D2C models, integration with AI-personalized skincare tools, regional trends led by India and China, and innovations in silicone-based, polymer-based, and natural oil-based defoamer technologies.

Key Segments

By Product Type:

  • Shampoos & conditioners
  • Body washes & shower gels
  • Facial cleansers
  • Hand washes

By Active Type:

  • Silicone-based defoamers
  • Natural oil-based defoamers
  • Polymer-based defoamers

By Channel:

  • E-commerce
  • Supermarkets & hypermarkets
  • Pharmacies & drugstores
  • Specialty personal care retail

By End User:

  • Adults
  • Women
  • Children
  • Men

By Formulation:

  • Liquid
  • Gel
  • Cream

By Region:

  • North America
  • Latin America
  • Europe
  • East Asia
  • South Asia & Pacific
  • Middle East and Africa

Table of Content

  1. Executive Summary
    • Global Market Outlook
    • Demand-side Trends
    • Supply-side Trends
    • Technology Roadmap Analysis
    • Analysis and Recommendations
  2. Market Overview
    • Market Coverage / Taxonomy
    • Market Definition / Scope / Limitations
  3. Market Background
    • Market Dynamics
      • Drivers
      • Restraints
      • Opportunity
      • Trends
    • Scenario Forecast
      • Demand in Optimistic Scenario
      • Demand in Likely Scenario
      • Demand in Conservative Scenario
    • Opportunity Map Analysis
    • Product Life Cycle Analysis
    • Supply Chain Analysis
      • Supply Side Participants and their Roles
        • Producers
        • Mid-Level Participants (Traders/ Agents/ Brokers)
        • Wholesalers and Distributors
      • Value Added and Value Created at Node in the Supply Chain
      • List of Raw Material Suppliers
      • List of Existing and Potential Buyer’s
    • Investment Feasibility Matrix
    • Value Chain Analysis
      • Profit Margin Analysis
      • Wholesalers and Distributors
      • Retailers
    • PESTLE and Porter’s Analysis
    • Regulatory Landscape
      • By Key Regions
      • By Key Countries
    • Regional Parent Market Outlook
    • Production and Consumption Statistics
    • Import and Export Statistics
  4. Global Market Analysis 2020 to 2024 and Forecast, 2025 to 2035
    • Historical Market Size Value (USD Million) & Volume (Units) Analysis, 2020 to 2024
    • Current and Future Market Size Value (USD Million) & Volume (Units) Projections, 2025 to 2035
      • Y-o-Y Growth Trend Analysis
      • Absolute $ Opportunity Analysis
  5. Global Market Analysis 2020 to 2024 and Forecast 2025 to 2035, By Product Type
    • Introduction / Key Findings
    • Historical Market Size Value (USD Million) & Volume (Units) Analysis By Product Type, 2020 to 2024
    • Current and Future Market Size Value (USD Million) & Volume (Units) Analysis and Forecast By Product Type, 2025 to 2035
      • Shampoos & conditioners
      • Body washes & shower gels
      • Facial cleansers
      • Hand washes
    • Y-o-Y Growth Trend Analysis By Product Type, 2020 to 2024
    • Absolute $ Opportunity Analysis By Product Type, 2025 to 2035
  6. Global Market Analysis 2020 to 2024 and Forecast 2025 to 2035, By Active Type
    • Introduction / Key Findings
    • Historical Market Size Value (USD Million) & Volume (Units) Analysis By Active Type, 2020 to 2024
    • Current and Future Market Size Value (USD Million) & Volume (Units) Analysis and Forecast By Active Type, 2025 to 2035
      • Silicone-based defoamers
      • Natural oil-based defoamers
      • Polymer-based defoamers
    • Y-o-Y Growth Trend Analysis By Active Type, 2020 to 2024
    • Absolute $ Opportunity Analysis By Active Type, 2025 to 2035
  7. Global Market Analysis 2020 to 2024 and Forecast 2025 to 2035, By Channel
    • Introduction / Key Findings
    • Historical Market Size Value (USD Million) & Volume (Units) Analysis By Channel, 2020 to 2024
    • Current and Future Market Size Value (USD Million) & Volume (Units) Analysis and Forecast By Channel, 2025 to 2035
      • E-commerce
      • Supermarkets & hypermarkets
      • Pharmacies & drugstores
      • Specialty personal care retail
    • Y-o-Y Growth Trend Analysis By Channel, 2020 to 2024
    • Absolute $ Opportunity Analysis By Channel, 2025 to 2035
  8. Global Market Analysis 2020 to 2024 and Forecast 2025 to 2035, By End User
    • Introduction / Key Findings
    • Historical Market Size Value (USD Million) & Volume (Units) Analysis By End User, 2020 to 2024
    • Current and Future Market Size Value (USD Million) & Volume (Units) Analysis and Forecast By End User, 2025 to 2035
      • Adults
      • Women
      • Children
      • Men
    • Y-o-Y Growth Trend Analysis By End User, 2020 to 2024
    • Absolute $ Opportunity Analysis By End User, 2025 to 2035
  9. Global Market Analysis 2020 to 2024 and Forecast 2025 to 2035, By Formulation
    • Introduction / Key Findings
    • Historical Market Size Value (USD Million) & Volume (Units) Analysis By Formulation, 2020 to 2024
    • Current and Future Market Size Value (USD Million) & Volume (Units) Analysis and Forecast By Formulation, 2025 to 2035
      • Liquid
      • Gel
      • Cream
    • Y-o-Y Growth Trend Analysis By Formulation, 2020 to 2024
    • Absolute $ Opportunity Analysis By Formulation, 2025 to 2035
  10. Global Market Analysis 2020 to 2024 and Forecast 2025 to 2035, By Region
    • Introduction
    • Historical Market Size Value (USD Million) & Volume (Units) Analysis By Region, 2020 to 2024
    • Current Market Size Value (USD Million) & Volume (Units) Analysis and Forecast By Region, 2025 to 2035
      • North America
      • Latin America
      • Europe
      • East Asia
      • South Asia & Pacific
      • Middle East and Africa
    • Market Attractiveness Analysis By Region
  11. North America Market Analysis 2020 to 2024 and Forecast 2025 to 2035, By Country
    • Historical Market Size Value (USD Million) & Volume (Units) Trend Analysis By Market Taxonomy, 2020 to 2024
    • Market Size Value (USD Million) & Volume (Units) Forecast By Market Taxonomy, 2025 to 2035
      • By Country
        • USA
        • Canada
      • By Product Type
      • By Active Type
      • By Channel
      • By End User
      • By Formulation
    • Market Attractiveness Analysis
      • By Country
      • By Product Type
      • By Active Type
      • By Channel
      • By End User
      • By Formulation
    • Key Takeaways
  12. Latin America Market Analysis 2020 to 2024 and Forecast 2025 to 2035, By Country
    • Historical Market Size Value (USD Million) & Volume (Units) Trend Analysis By Market Taxonomy, 2020 to 2024
    • Market Size Value (USD Million) & Volume (Units) Forecast By Market Taxonomy, 2025 to 2035
      • By Country
        • Brazil
        • Mexico
        • Colombia
        • Rest of Latin America
      • By Product Type
      • By Active Type
      • By Channel
      • By End User
      • By Formulation
    • Market Attractiveness Analysis
      • By Country
      • By Product Type
      • By Active Type
      • By Channel
      • By End User
      • By Formulation
    • Key Takeaways
  13. Europe Market Analysis 2020 to 2024 and Forecast 2025 to 2035, By Country
    • Historical Market Size Value (USD Million) & Volume (Units) Trend Analysis By Market Taxonomy, 2020 to 2024
    • Market Size Value (USD Million) & Volume (Units) Forecast By Market Taxonomy, 2025 to 2035
      • By Country
        • Germany
        • UK
        • France
        • Italy
        • Spain
        • Belgium
        • Netherlands
        • Nordic
        • Switzerland
        • Russia
        • Poland
        • Rest of Europe
      • By Product Type
      • By Active Type
      • By Channel
      • By End User
      • By Formulation
    • Market Attractiveness Analysis
      • By Country
      • By Product Type
      • By Active Type
      • By Channel
      • By End User
      • By Formulation
    • Key Takeaways
  14. East Asia Market Analysis 2020 to 2024 and Forecast 2025 to 2035, By Country
    • Historical Market Size Value (USD Million) & Volume (Units) Trend Analysis By Market Taxonomy, 2020 to 2024
    • Market Size Value (USD Million) & Volume (Units) Forecast By Market Taxonomy, 2025 to 2035
      • By Country
        • China
        • Japan
        • South Korea
      • By Product Type
      • By Active Type
      • By Channel
      • By End User
      • By Formulation
    • Market Attractiveness Analysis
      • By Country
      • By Product Type
      • By Active Type
      • By Channel
      • By End User
      • By Formulation
    • Key Takeaways
  15. South Asia & Pacific Market Analysis 2020 to 2024 and Forecast 2025 to 2035, By Country
    • Historical Market Size Value (USD Million) & Volume (Units) Trend Analysis By Market Taxonomy, 2020 to 2024
    • Market Size Value (USD Million) & Volume (Units) Forecast By Market Taxonomy, 2025 to 2035
      • By Country
        • India
        • Thailand
        • Malaysia
        • Indonesia
        • Singapore
        • Vietnam
        • Australia
        • New Zealand
        • Rest of South Asia
      • By Product Type
      • By Active Type
      • By Channel
      • By End User
      • By Formulation
    • Market Attractiveness Analysis
      • By Country
      • By Product Type
      • By Active Type
      • By Channel
      • By End User
      • By Formulation
    • Key Takeaways
  16. Middle East and Africa Market Analysis 2020 to 2024 and Forecast 2025 to 2035, By Country
    • Historical Market Size Value (USD Million) & Volume (Units) Trend Analysis By Market Taxonomy, 2020 to 2024
    • Market Size Value (USD Million) & Volume (Units) Forecast By Market Taxonomy, 2025 to 2035
      • By Country
        • Turkey
        • UAE
        • Saudi Arabia
        • Israel
        • Other GCC Countries
        • North Africa
        • South Africa
      • By Product Type
      • By Active Type
      • By Channel
      • By End User
      • By Formulation
    • Market Attractiveness Analysis
      • By Country
      • By Product Type
      • By Active Type
      • By Channel
      • By End User
      • By Formulation
    • Key Takeaways
  17. Key Countries Market Analysis
    • USA
      • Pricing Analysis
      • Market Share Analysis, 2024
        • By Product Type
        • By Active Type
        • By Channel
        • By End User
        • By Formulation
    • Canada
      • Pricing Analysis
      • Market Share Analysis, 2024
        • By Product Type
        • By Active Type
        • By Channel
        • By End User
        • By Formulation
    • Brazil
      • Pricing Analysis
      • Market Share Analysis, 2024
        • By Product Type
        • By Active Type
        • By Channel
        • By End User
        • By Formulation
    • Mexico
      • Pricing Analysis
      • Market Share Analysis, 2024
        • By Product Type
        • By Active Type
        • By Channel
        • By End User
        • By Formulation
    • Colombia
      • Pricing Analysis
      • Market Share Analysis, 2024
        • By Product Type
        • By Active Type
        • By Channel
        • By End User
        • By Formulation
    • Germany
      • Pricing Analysis
      • Market Share Analysis, 2024
        • By Product Type
        • By Active Type
        • By Channel
        • By End User
        • By Formulation
    • UK
      • Pricing Analysis
      • Market Share Analysis, 2024
        • By Product Type
        • By Active Type
        • By Channel
        • By End User
        • By Formulation
    • France
      • Pricing Analysis
      • Market Share Analysis, 2024
        • By Product Type
        • By Active Type
        • By Channel
        • By End User
        • By Formulation
    • Italy
      • Pricing Analysis
      • Market Share Analysis, 2024
        • By Product Type
        • By Active Type
        • By Channel
        • By End User
        • By Formulation
    • Spain
      • Pricing Analysis
      • Market Share Analysis, 2024
        • By Product Type
        • By Active Type
        • By Channel
        • By End User
        • By Formulation
    • Belgium
      • Pricing Analysis
      • Market Share Analysis, 2024
        • By Product Type
        • By Active Type
        • By Channel
        • By End User
        • By Formulation
    • Netherlands
      • Pricing Analysis
      • Market Share Analysis, 2024
        • By Product Type
        • By Active Type
        • By Channel
        • By End User
        • By Formulation
    • Nordic
      • Pricing Analysis
      • Market Share Analysis, 2024
        • By Product Type
        • By Active Type
        • By Channel
        • By End User
        • By Formulation
    • Switzerland
      • Pricing Analysis
      • Market Share Analysis, 2024
        • By Product Type
        • By Active Type
        • By Channel
        • By End User
        • By Formulation
    • Russia
      • Pricing Analysis
      • Market Share Analysis, 2024
        • By Product Type
        • By Active Type
        • By Channel
        • By End User
        • By Formulation
    • Poland
      • Pricing Analysis
      • Market Share Analysis, 2024
        • By Product Type
        • By Active Type
        • By Channel
        • By End User
        • By Formulation
    • China
      • Pricing Analysis
      • Market Share Analysis, 2024
        • By Product Type
        • By Active Type
        • By Channel
        • By End User
        • By Formulation
    • Japan
      • Pricing Analysis
      • Market Share Analysis, 2024
        • By Product Type
        • By Active Type
        • By Channel
        • By End User
        • By Formulation
    • South Korea
      • Pricing Analysis
      • Market Share Analysis, 2024
        • By Product Type
        • By Active Type
        • By Channel
        • By End User
        • By Formulation
    • India
      • Pricing Analysis
      • Market Share Analysis, 2024
        • By Product Type
        • By Active Type
        • By Channel
        • By End User
        • By Formulation
    • Thailand
      • Pricing Analysis
      • Market Share Analysis, 2024
        • By Product Type
        • By Active Type
        • By Channel
        • By End User
        • By Formulation
    • Indonesia
      • Pricing Analysis
      • Market Share Analysis, 2024
        • By Product Type
        • By Active Type
        • By Channel
        • By End User
        • By Formulation
    • Australia
      • Pricing Analysis
      • Market Share Analysis, 2024
        • By Product Type
        • By Active Type
        • By Channel
        • By End User
        • By Formulation
    • New Zealand
      • Pricing Analysis
      • Market Share Analysis, 2024
        • By Product Type
        • By Active Type
        • By Channel
        • By End User
        • By Formulation
    • Turkey
      • Pricing Analysis
      • Market Share Analysis, 2024
        • By Product Type
        • By Active Type
        • By Channel
        • By End User
        • By Formulation
    • UAE
      • Pricing Analysis
      • Market Share Analysis, 2024
        • By Product Type
        • By Active Type
        • By Channel
        • By End User
        • By Formulation
    • Saudi Arabia
      • Pricing Analysis
      • Market Share Analysis, 2024
        • By Product Type
        • By Active Type
        • By Channel
        • By End User
        • By Formulation
    • Israel
      • Pricing Analysis
      • Market Share Analysis, 2024
        • By Product Type
        • By Active Type
        • By Channel
        • By End User
        • By Formulation
    • North Africa
      • Pricing Analysis
      • Market Share Analysis, 2024
        • By Product Type
        • By Active Type
        • By Channel
        • By End User
        • By Formulation
    • South Africa
      • Pricing Analysis
      • Market Share Analysis, 2024
        • By Product Type
        • By Active Type
        • By Channel
        • By End User
        • By Formulation
  18. Market Structure Analysis
    • Competition Dashboard
    • Competition Benchmarking
    • Market Share Analysis of Top Players
      • By Regional
      • By Product Type
      • By Active Type
      • By Channel
      • By End User
      • By Formulation
  19. Competition Analysis
    • Competition Deep Dive
      • Procter & Gamble
        • Overview
        • Product Portfolio
        • Profitability by Market Segments (Product/Age /Sales Channel/Region)
        • Sales Footprint
        • Strategy Overview
          • Marketing Strategy
          • Product Strategy
          • Channel Strategy
      • Unilever
        • Overview
        • Product Portfolio
        • Profitability by Market Segments (Product/Age /Sales Channel/Region)
        • Sales Footprint
        • Strategy Overview
          • Marketing Strategy
          • Product Strategy
          • Channel Strategy
      • Johnson & Johnson
        • Overview
        • Product Portfolio
        • Profitability by Market Segments (Product/Age /Sales Channel/Region)
        • Sales Footprint
        • Strategy Overview
          • Marketing Strategy
          • Product Strategy
          • Channel Strategy
      • Colgate-Palmolive
        • Overview
        • Product Portfolio
        • Profitability by Market Segments (Product/Age /Sales Channel/Region)
        • Sales Footprint
        • Strategy Overview
          • Marketing Strategy
          • Product Strategy
          • Channel Strategy
      • Beiersdorf
        • Overview
        • Product Portfolio
        • Profitability by Market Segments (Product/Age /Sales Channel/Region)
        • Sales Footprint
        • Strategy Overview
          • Marketing Strategy
          • Product Strategy
          • Channel Strategy
      • L’Oréal
        • Overview
        • Product Portfolio
        • Profitability by Market Segments (Product/Age /Sales Channel/Region)
        • Sales Footprint
        • Strategy Overview
          • Marketing Strategy
          • Product Strategy
          • Channel Strategy
      • Henkel
        • Overview
        • Product Portfolio
        • Profitability by Market Segments (Product/Age /Sales Channel/Region)
        • Sales Footprint
        • Strategy Overview
          • Marketing Strategy
          • Product Strategy
          • Channel Strategy
      • Amorepacific
        • Overview
        • Product Portfolio
        • Profitability by Market Segments (Product/Age /Sales Channel/Region)
        • Sales Footprint
        • Strategy Overview
          • Marketing Strategy
          • Product Strategy
          • Channel Strategy
      • Shiseido
        • Overview
        • Product Portfolio
        • Profitability by Market Segments (Product/Age /Sales Channel/Region)
        • Sales Footprint
        • Strategy Overview
          • Marketing Strategy
          • Product Strategy
          • Channel Strategy
      • Kao Corporation
        • Overview
        • Product Portfolio
        • Profitability by Market Segments (Product/Age /Sales Channel/Region)
        • Sales Footprint
        • Strategy Overview
          • Marketing Strategy
          • Product Strategy
          • Channel Strategy
  20. Assumptions & Acronyms Used
  21. Research Methodology

List of Tables

  • Table 1: Global Market Value (USD Million) Forecast by Region, 2020-2035
  • Table 2: Global Market Volume (Units) Forecast by Region, 2020-2035
  • Table 3: Global Market Value (USD Million) Forecast by Product Type, 2020-2035
  • Table 4: Global Market Volume (Units) Forecast by Product Type, 2020-2035
  • Table 5: Global Market Value (USD Million) Forecast by Active Type, 2020-2035
  • Table 6: Global Market Volume (Units) Forecast by Active Type, 2020-2035
  • Table 7: Global Market Value (USD Million) Forecast by Channel, 2020-2035
  • Table 8: Global Market Volume (Units) Forecast by Channel, 2020-2035
  • Table 9: Global Market Value (USD Million) Forecast by End User, 2020-2035
  • Table 10: Global Market Volume (Units) Forecast by End User, 2020-2035
  • Table 11: Global Market Value (USD Million) Forecast by Formulation, 2020-2035
  • Table 12: Global Market Volume (Units) Forecast by Formulation, 2020-2035
  • Table 13: North America Market Value (USD Million) Forecast by Country, 2020-2035
  • Table 14: North America Market Volume (Units) Forecast by Country, 2020-2035
  • Table 15: North America Market Value (USD Million) Forecast by Product Type, 2020-2035
  • Table 16: North America Market Volume (Units) Forecast by Product Type, 2020-2035
  • Table 17: North America Market Value (USD Million) Forecast by Active Type, 2020-2035
  • Table 18: North America Market Volume (Units) Forecast by Active Type, 2020-2035
  • Table 19: North America Market Value (USD Million) Forecast by Channel, 2020-2035
  • Table 20: North America Market Volume (Units) Forecast by Channel, 2020-2035
  • Table 21: North America Market Value (USD Million) Forecast by End User, 2020-2035
  • Table 22: North America Market Volume (Units) Forecast by End User, 2020-2035
  • Table 23: North America Market Value (USD Million) Forecast by Formulation, 2020-2035
  • Table 24: North America Market Volume (Units) Forecast by Formulation, 2020-2035
  • Table 25: Latin America Market Value (USD Million) Forecast by Country, 2020-2035
  • Table 26: Latin America Market Volume (Units) Forecast by Country, 2020-2035
  • Table 27: Latin America Market Value (USD Million) Forecast by Product Type, 2020-2035
  • Table 28: Latin America Market Volume (Units) Forecast by Product Type, 2020-2035
  • Table 29: Latin America Market Value (USD Million) Forecast by Active Type, 2020-2035
  • Table 30: Latin America Market Volume (Units) Forecast by Active Type, 2020-2035
  • Table 31: Latin America Market Value (USD Million) Forecast by Channel, 2020-2035
  • Table 32: Latin America Market Volume (Units) Forecast by Channel, 2020-2035
  • Table 33: Latin America Market Value (USD Million) Forecast by End User, 2020-2035
  • Table 34: Latin America Market Volume (Units) Forecast by End User, 2020-2035
  • Table 35: Latin America Market Value (USD Million) Forecast by Formulation, 2020-2035
  • Table 36: Latin America Market Volume (Units) Forecast by Formulation, 2020-2035
  • Table 37: Europe Market Value (USD Million) Forecast by Country, 2020-2035
  • Table 38: Europe Market Volume (Units) Forecast by Country, 2020-2035
  • Table 39: Europe Market Value (USD Million) Forecast by Product Type, 2020-2035
  • Table 40: Europe Market Volume (Units) Forecast by Product Type, 2020-2035
  • Table 41: Europe Market Value (USD Million) Forecast by Active Type, 2020-2035
  • Table 42: Europe Market Volume (Units) Forecast by Active Type, 2020-2035
  • Table 43: Europe Market Value (USD Million) Forecast by Channel, 2020-2035
  • Table 44: Europe Market Volume (Units) Forecast by Channel, 2020-2035
  • Table 45: Europe Market Value (USD Million) Forecast by End User, 2020-2035
  • Table 46: Europe Market Volume (Units) Forecast by End User, 2020-2035
  • Table 47: Europe Market Value (USD Million) Forecast by Formulation, 2020-2035
  • Table 48: Europe Market Volume (Units) Forecast by Formulation, 2020-2035
  • Table 49: East Asia Market Value (USD Million) Forecast by Country, 2020-2035
  • Table 50: East Asia Market Volume (Units) Forecast by Country, 2020-2035
  • Table 51: East Asia Market Value (USD Million) Forecast by Product Type, 2020-2035
  • Table 52: East Asia Market Volume (Units) Forecast by Product Type, 2020-2035
  • Table 53: East Asia Market Value (USD Million) Forecast by Active Type, 2020-2035
  • Table 54: East Asia Market Volume (Units) Forecast by Active Type, 2020-2035
  • Table 55: East Asia Market Value (USD Million) Forecast by Channel, 2020-2035
  • Table 56: East Asia Market Volume (Units) Forecast by Channel, 2020-2035
  • Table 57: East Asia Market Value (USD Million) Forecast by End User, 2020-2035
  • Table 58: East Asia Market Volume (Units) Forecast by End User, 2020-2035
  • Table 59: East Asia Market Value (USD Million) Forecast by Formulation, 2020-2035
  • Table 60: East Asia Market Volume (Units) Forecast by Formulation, 2020-2035
  • Table 61: South Asia & Pacific Market Value (USD Million) Forecast by Country, 2020-2035
  • Table 62: South Asia & Pacific Market Volume (Units) Forecast by Country, 2020-2035
  • Table 63: South Asia & Pacific Market Value (USD Million) Forecast by Product Type, 2020-2035
  • Table 64: South Asia & Pacific Market Volume (Units) Forecast by Product Type, 2020-2035
  • Table 65: South Asia & Pacific Market Value (USD Million) Forecast by Active Type, 2020-2035
  • Table 66: South Asia & Pacific Market Volume (Units) Forecast by Active Type, 2020-2035
  • Table 67: South Asia & Pacific Market Value (USD Million) Forecast by Channel, 2020-2035
  • Table 68: South Asia & Pacific Market Volume (Units) Forecast by Channel, 2020-2035
  • Table 69: South Asia & Pacific Market Value (USD Million) Forecast by End User, 2020-2035
  • Table 70: South Asia & Pacific Market Volume (Units) Forecast by End User, 2020-2035
  • Table 71: South Asia & Pacific Market Value (USD Million) Forecast by Formulation, 2020-2035
  • Table 72: South Asia & Pacific Market Volume (Units) Forecast by Formulation, 2020-2035
  • Table 73: Middle East and Africa Market Value (USD Million) Forecast by Country, 2020-2035
  • Table 74: Middle East and Africa Market Volume (Units) Forecast by Country, 2020-2035
  • Table 75: Middle East and Africa Market Value (USD Million) Forecast by Product Type, 2020-2035
  • Table 76: Middle East and Africa Market Volume (Units) Forecast by Product Type, 2020-2035
  • Table 77: Middle East and Africa Market Value (USD Million) Forecast by Active Type, 2020-2035
  • Table 78: Middle East and Africa Market Volume (Units) Forecast by Active Type, 2020-2035
  • Table 79: Middle East and Africa Market Value (USD Million) Forecast by Channel, 2020-2035
  • Table 80: Middle East and Africa Market Volume (Units) Forecast by Channel, 2020-2035
  • Table 81: Middle East and Africa Market Value (USD Million) Forecast by End User, 2020-2035
  • Table 82: Middle East and Africa Market Volume (Units) Forecast by End User, 2020-2035
  • Table 83: Middle East and Africa Market Value (USD Million) Forecast by Formulation, 2020-2035
  • Table 84: Middle East and Africa Market Volume (Units) Forecast by Formulation, 2020-2035

List of Figures

  • Figure 1: Global Market Value (USD Million) by Product Type, 2025-2035
  • Figure 2: Global Market Value (USD Million) by Active Type, 2025-2035
  • Figure 3: Global Market Value (USD Million) by Channel, 2025-2035
  • Figure 4: Global Market Value (USD Million) by End User, 2025-2035
  • Figure 5: Global Market Value (USD Million) by Formulation, 2025-2035
  • Figure 6: Global Market Value (USD Million) by Region, 2025-2035
  • Figure 7: Global Market Value (USD Million) Analysis by Region, 2020-2035
  • Figure 8: Global Market Volume (Units) Analysis by Region, 2020-2035
  • Figure 9: Global Market Value Share (%) and BPS Analysis by Region, 2025-2035
  • Figure 10: Global Market Y-o-Y Growth (%) Projections by Region, 2025-2035
  • Figure 11: Global Market Value (USD Million) Analysis by Product Type, 2020-2035
  • Figure 12: Global Market Volume (Units) Analysis by Product Type, 2020-2035
  • Figure 13: Global Market Value Share (%) and BPS Analysis by Product Type, 2025-2035
  • Figure 14: Global Market Y-o-Y Growth (%) Projections by Product Type, 2025-2035
  • Figure 15: Global Market Value (USD Million) Analysis by Active Type, 2020-2035
  • Figure 16: Global Market Volume (Units) Analysis by Active Type, 2020-2035
  • Figure 17: Global Market Value Share (%) and BPS Analysis by Active Type, 2025-2035
  • Figure 18: Global Market Y-o-Y Growth (%) Projections by Active Type, 2025-2035
  • Figure 19: Global Market Value (USD Million) Analysis by Channel, 2020-2035
  • Figure 20: Global Market Volume (Units) Analysis by Channel, 2020-2035
  • Figure 21: Global Market Value Share (%) and BPS Analysis by Channel, 2025-2035
  • Figure 22: Global Market Y-o-Y Growth (%) Projections by Channel, 2025-2035
  • Figure 23: Global Market Value (USD Million) Analysis by End User, 2020-2035
  • Figure 24: Global Market Volume (Units) Analysis by End User, 2020-2035
  • Figure 25: Global Market Value Share (%) and BPS Analysis by End User, 2025-2035
  • Figure 26: Global Market Y-o-Y Growth (%) Projections by End User, 2025-2035
  • Figure 27: Global Market Value (USD Million) Analysis by Formulation, 2020-2035
  • Figure 28: Global Market Volume (Units) Analysis by Formulation, 2020-2035
  • Figure 29: Global Market Value Share (%) and BPS Analysis by Formulation, 2025-2035
  • Figure 30: Global Market Y-o-Y Growth (%) Projections by Formulation, 2025-2035
  • Figure 31: Global Market Attractiveness by Product Type, 2025-2035
  • Figure 32: Global Market Attractiveness by Active Type, 2025-2035
  • Figure 33: Global Market Attractiveness by Channel, 2025-2035
  • Figure 34: Global Market Attractiveness by End User, 2025-2035
  • Figure 35: Global Market Attractiveness by Formulation, 2025-2035
  • Figure 36: Global Market Attractiveness by Region, 2025-2035
  • Figure 37: North America Market Value (USD Million) by Product Type, 2025-2035
  • Figure 38: North America Market Value (USD Million) by Active Type, 2025-2035
  • Figure 39: North America Market Value (USD Million) by Channel, 2025-2035
  • Figure 40: North America Market Value (USD Million) by End User, 2025-2035
  • Figure 41: North America Market Value (USD Million) by Formulation, 2025-2035
  • Figure 42: North America Market Value (USD Million) by Country, 2025-2035
  • Figure 43: North America Market Value (USD Million) Analysis by Country, 2020-2035
  • Figure 44: North America Market Volume (Units) Analysis by Country, 2020-2035
  • Figure 45: North America Market Value Share (%) and BPS Analysis by Country, 2025-2035
  • Figure 46: North America Market Y-o-Y Growth (%) Projections by Country, 2025-2035
  • Figure 47: North America Market Value (USD Million) Analysis by Product Type, 2020-2035
  • Figure 48: North America Market Volume (Units) Analysis by Product Type, 2020-2035
  • Figure 49: North America Market Value Share (%) and BPS Analysis by Product Type, 2025-2035
  • Figure 50: North America Market Y-o-Y Growth (%) Projections by Product Type, 2025-2035
  • Figure 51: North America Market Value (USD Million) Analysis by Active Type, 2020-2035
  • Figure 52: North America Market Volume (Units) Analysis by Active Type, 2020-2035
  • Figure 53: North America Market Value Share (%) and BPS Analysis by Active Type, 2025-2035
  • Figure 54: North America Market Y-o-Y Growth (%) Projections by Active Type, 2025-2035
  • Figure 55: North America Market Value (USD Million) Analysis by Channel, 2020-2035
  • Figure 56: North America Market Volume (Units) Analysis by Channel, 2020-2035
  • Figure 57: North America Market Value Share (%) and BPS Analysis by Channel, 2025-2035
  • Figure 58: North America Market Y-o-Y Growth (%) Projections by Channel, 2025-2035
  • Figure 59: North America Market Value (USD Million) Analysis by End User, 2020-2035
  • Figure 60: North America Market Volume (Units) Analysis by End User, 2020-2035
  • Figure 61: North America Market Value Share (%) and BPS Analysis by End User, 2025-2035
  • Figure 62: North America Market Y-o-Y Growth (%) Projections by End User, 2025-2035
  • Figure 63: North America Market Value (USD Million) Analysis by Formulation, 2020-2035
  • Figure 64: North America Market Volume (Units) Analysis by Formulation, 2020-2035
  • Figure 65: North America Market Value Share (%) and BPS Analysis by Formulation, 2025-2035
  • Figure 66: North America Market Y-o-Y Growth (%) Projections by Formulation, 2025-2035
  • Figure 67: North America Market Attractiveness by Product Type, 2025-2035
  • Figure 68: North America Market Attractiveness by Active Type, 2025-2035
  • Figure 69: North America Market Attractiveness by Channel, 2025-2035
  • Figure 70: North America Market Attractiveness by End User, 2025-2035
  • Figure 71: North America Market Attractiveness by Formulation, 2025-2035
  • Figure 72: North America Market Attractiveness by Country, 2025-2035
  • Figure 73: Latin America Market Value (USD Million) by Product Type, 2025-2035
  • Figure 74: Latin America Market Value (USD Million) by Active Type, 2025-2035
  • Figure 75: Latin America Market Value (USD Million) by Channel, 2025-2035
  • Figure 76: Latin America Market Value (USD Million) by End User, 2025-2035
  • Figure 77: Latin America Market Value (USD Million) by Formulation, 2025-2035
  • Figure 78: Latin America Market Value (USD Million) by Country, 2025-2035
  • Figure 79: Latin America Market Value (USD Million) Analysis by Country, 2020-2035
  • Figure 80: Latin America Market Volume (Units) Analysis by Country, 2020-2035
  • Figure 81: Latin America Market Value Share (%) and BPS Analysis by Country, 2025-2035
  • Figure 82: Latin America Market Y-o-Y Growth (%) Projections by Country, 2025-2035
  • Figure 83: Latin America Market Value (USD Million) Analysis by Product Type, 2020-2035
  • Figure 84: Latin America Market Volume (Units) Analysis by Product Type, 2020-2035
  • Figure 85: Latin America Market Value Share (%) and BPS Analysis by Product Type, 2025-2035
  • Figure 86: Latin America Market Y-o-Y Growth (%) Projections by Product Type, 2025-2035
  • Figure 87: Latin America Market Value (USD Million) Analysis by Active Type, 2020-2035
  • Figure 88: Latin America Market Volume (Units) Analysis by Active Type, 2020-2035
  • Figure 89: Latin America Market Value Share (%) and BPS Analysis by Active Type, 2025-2035
  • Figure 90: Latin America Market Y-o-Y Growth (%) Projections by Active Type, 2025-2035
  • Figure 91: Latin America Market Value (USD Million) Analysis by Channel, 2020-2035
  • Figure 92: Latin America Market Volume (Units) Analysis by Channel, 2020-2035
  • Figure 93: Latin America Market Value Share (%) and BPS Analysis by Channel, 2025-2035
  • Figure 94: Latin America Market Y-o-Y Growth (%) Projections by Channel, 2025-2035
  • Figure 95: Latin America Market Value (USD Million) Analysis by End User, 2020-2035
  • Figure 96: Latin America Market Volume (Units) Analysis by End User, 2020-2035
  • Figure 97: Latin America Market Value Share (%) and BPS Analysis by End User, 2025-2035
  • Figure 98: Latin America Market Y-o-Y Growth (%) Projections by End User, 2025-2035
  • Figure 99: Latin America Market Value (USD Million) Analysis by Formulation, 2020-2035
  • Figure 100: Latin America Market Volume (Units) Analysis by Formulation, 2020-2035
  • Figure 101: Latin America Market Value Share (%) and BPS Analysis by Formulation, 2025-2035
  • Figure 102: Latin America Market Y-o-Y Growth (%) Projections by Formulation, 2025-2035
  • Figure 103: Latin America Market Attractiveness by Product Type, 2025-2035
  • Figure 104: Latin America Market Attractiveness by Active Type, 2025-2035
  • Figure 105: Latin America Market Attractiveness by Channel, 2025-2035
  • Figure 106: Latin America Market Attractiveness by End User, 2025-2035
  • Figure 107: Latin America Market Attractiveness by Formulation, 2025-2035
  • Figure 108: Latin America Market Attractiveness by Country, 2025-2035
  • Figure 109: Europe Market Value (USD Million) by Product Type, 2025-2035
  • Figure 110: Europe Market Value (USD Million) by Active Type, 2025-2035
  • Figure 111: Europe Market Value (USD Million) by Channel, 2025-2035
  • Figure 112: Europe Market Value (USD Million) by End User, 2025-2035
  • Figure 113: Europe Market Value (USD Million) by Formulation, 2025-2035
  • Figure 114: Europe Market Value (USD Million) by Country, 2025-2035
  • Figure 115: Europe Market Value (USD Million) Analysis by Country, 2020-2035
  • Figure 116: Europe Market Volume (Units) Analysis by Country, 2020-2035
  • Figure 117: Europe Market Value Share (%) and BPS Analysis by Country, 2025-2035
  • Figure 118: Europe Market Y-o-Y Growth (%) Projections by Country, 2025-2035
  • Figure 119: Europe Market Value (USD Million) Analysis by Product Type, 2020-2035
  • Figure 120: Europe Market Volume (Units) Analysis by Product Type, 2020-2035
  • Figure 121: Europe Market Value Share (%) and BPS Analysis by Product Type, 2025-2035
  • Figure 122: Europe Market Y-o-Y Growth (%) Projections by Product Type, 2025-2035
  • Figure 123: Europe Market Value (USD Million) Analysis by Active Type, 2020-2035
  • Figure 124: Europe Market Volume (Units) Analysis by Active Type, 2020-2035
  • Figure 125: Europe Market Value Share (%) and BPS Analysis by Active Type, 2025-2035
  • Figure 126: Europe Market Y-o-Y Growth (%) Projections by Active Type, 2025-2035
  • Figure 127: Europe Market Value (USD Million) Analysis by Channel, 2020-2035
  • Figure 128: Europe Market Volume (Units) Analysis by Channel, 2020-2035
  • Figure 129: Europe Market Value Share (%) and BPS Analysis by Channel, 2025-2035
  • Figure 130: Europe Market Y-o-Y Growth (%) Projections by Channel, 2025-2035
  • Figure 131: Europe Market Value (USD Million) Analysis by End User, 2020-2035
  • Figure 132: Europe Market Volume (Units) Analysis by End User, 2020-2035
  • Figure 133: Europe Market Value Share (%) and BPS Analysis by End User, 2025-2035
  • Figure 134: Europe Market Y-o-Y Growth (%) Projections by End User, 2025-2035
  • Figure 135: Europe Market Value (USD Million) Analysis by Formulation, 2020-2035
  • Figure 136: Europe Market Volume (Units) Analysis by Formulation, 2020-2035
  • Figure 137: Europe Market Value Share (%) and BPS Analysis by Formulation, 2025-2035
  • Figure 138: Europe Market Y-o-Y Growth (%) Projections by Formulation, 2025-2035
  • Figure 139: Europe Market Attractiveness by Product Type, 2025-2035
  • Figure 140: Europe Market Attractiveness by Active Type, 2025-2035
  • Figure 141: Europe Market Attractiveness by Channel, 2025-2035
  • Figure 142: Europe Market Attractiveness by End User, 2025-2035
  • Figure 143: Europe Market Attractiveness by Formulation, 2025-2035
  • Figure 144: Europe Market Attractiveness by Country, 2025-2035
  • Figure 145: East Asia Market Value (USD Million) by Product Type, 2025-2035
  • Figure 146: East Asia Market Value (USD Million) by Active Type, 2025-2035
  • Figure 147: East Asia Market Value (USD Million) by Channel, 2025-2035
  • Figure 148: East Asia Market Value (USD Million) by End User, 2025-2035
  • Figure 149: East Asia Market Value (USD Million) by Formulation, 2025-2035
  • Figure 150: East Asia Market Value (USD Million) by Country, 2025-2035
  • Figure 151: East Asia Market Value (USD Million) Analysis by Country, 2020-2035
  • Figure 152: East Asia Market Volume (Units) Analysis by Country, 2020-2035
  • Figure 153: East Asia Market Value Share (%) and BPS Analysis by Country, 2025-2035
  • Figure 154: East Asia Market Y-o-Y Growth (%) Projections by Country, 2025-2035
  • Figure 155: East Asia Market Value (USD Million) Analysis by Product Type, 2020-2035
  • Figure 156: East Asia Market Volume (Units) Analysis by Product Type, 2020-2035
  • Figure 157: East Asia Market Value Share (%) and BPS Analysis by Product Type, 2025-2035
  • Figure 158: East Asia Market Y-o-Y Growth (%) Projections by Product Type, 2025-2035
  • Figure 159: East Asia Market Value (USD Million) Analysis by Active Type, 2020-2035
  • Figure 160: East Asia Market Volume (Units) Analysis by Active Type, 2020-2035
  • Figure 161: East Asia Market Value Share (%) and BPS Analysis by Active Type, 2025-2035
  • Figure 162: East Asia Market Y-o-Y Growth (%) Projections by Active Type, 2025-2035
  • Figure 163: East Asia Market Value (USD Million) Analysis by Channel, 2020-2035
  • Figure 164: East Asia Market Volume (Units) Analysis by Channel, 2020-2035
  • Figure 165: East Asia Market Value Share (%) and BPS Analysis by Channel, 2025-2035
  • Figure 166: East Asia Market Y-o-Y Growth (%) Projections by Channel, 2025-2035
  • Figure 167: East Asia Market Value (USD Million) Analysis by End User, 2020-2035
  • Figure 168: East Asia Market Volume (Units) Analysis by End User, 2020-2035
  • Figure 169: East Asia Market Value Share (%) and BPS Analysis by End User, 2025-2035
  • Figure 170: East Asia Market Y-o-Y Growth (%) Projections by End User, 2025-2035
  • Figure 171: East Asia Market Value (USD Million) Analysis by Formulation, 2020-2035
  • Figure 172: East Asia Market Volume (Units) Analysis by Formulation, 2020-2035
  • Figure 173: East Asia Market Value Share (%) and BPS Analysis by Formulation, 2025-2035
  • Figure 174: East Asia Market Y-o-Y Growth (%) Projections by Formulation, 2025-2035
  • Figure 175: East Asia Market Attractiveness by Product Type, 2025-2035
  • Figure 176: East Asia Market Attractiveness by Active Type, 2025-2035
  • Figure 177: East Asia Market Attractiveness by Channel, 2025-2035
  • Figure 178: East Asia Market Attractiveness by End User, 2025-2035
  • Figure 179: East Asia Market Attractiveness by Formulation, 2025-2035
  • Figure 180: East Asia Market Attractiveness by Country, 2025-2035
  • Figure 181: South Asia & Pacific Market Value (USD Million) by Product Type, 2025-2035
  • Figure 182: South Asia & Pacific Market Value (USD Million) by Active Type, 2025-2035
  • Figure 183: South Asia & Pacific Market Value (USD Million) by Channel, 2025-2035
  • Figure 184: South Asia & Pacific Market Value (USD Million) by End User, 2025-2035
  • Figure 185: South Asia & Pacific Market Value (USD Million) by Formulation, 2025-2035
  • Figure 186: South Asia & Pacific Market Value (USD Million) by Country, 2025-2035
  • Figure 187: South Asia & Pacific Market Value (USD Million) Analysis by Country, 2020-2035
  • Figure 188: South Asia & Pacific Market Volume (Units) Analysis by Country, 2020-2035
  • Figure 189: South Asia & Pacific Market Value Share (%) and BPS Analysis by Country, 2025-2035
  • Figure 190: South Asia & Pacific Market Y-o-Y Growth (%) Projections by Country, 2025-2035
  • Figure 191: South Asia & Pacific Market Value (USD Million) Analysis by Product Type, 2020-2035
  • Figure 192: South Asia & Pacific Market Volume (Units) Analysis by Product Type, 2020-2035
  • Figure 193: South Asia & Pacific Market Value Share (%) and BPS Analysis by Product Type, 2025-2035
  • Figure 194: South Asia & Pacific Market Y-o-Y Growth (%) Projections by Product Type, 2025-2035
  • Figure 195: South Asia & Pacific Market Value (USD Million) Analysis by Active Type, 2020-2035
  • Figure 196: South Asia & Pacific Market Volume (Units) Analysis by Active Type, 2020-2035
  • Figure 197: South Asia & Pacific Market Value Share (%) and BPS Analysis by Active Type, 2025-2035
  • Figure 198: South Asia & Pacific Market Y-o-Y Growth (%) Projections by Active Type, 2025-2035
  • Figure 199: South Asia & Pacific Market Value (USD Million) Analysis by Channel, 2020-2035
  • Figure 200: South Asia & Pacific Market Volume (Units) Analysis by Channel, 2020-2035
  • Figure 201: South Asia & Pacific Market Value Share (%) and BPS Analysis by Channel, 2025-2035
  • Figure 202: South Asia & Pacific Market Y-o-Y Growth (%) Projections by Channel, 2025-2035
  • Figure 203: South Asia & Pacific Market Value (USD Million) Analysis by End User, 2020-2035
  • Figure 204: South Asia & Pacific Market Volume (Units) Analysis by End User, 2020-2035
  • Figure 205: South Asia & Pacific Market Value Share (%) and BPS Analysis by End User, 2025-2035
  • Figure 206: South Asia & Pacific Market Y-o-Y Growth (%) Projections by End User, 2025-2035
  • Figure 207: South Asia & Pacific Market Value (USD Million) Analysis by Formulation, 2020-2035
  • Figure 208: South Asia & Pacific Market Volume (Units) Analysis by Formulation, 2020-2035
  • Figure 209: South Asia & Pacific Market Value Share (%) and BPS Analysis by Formulation, 2025-2035
  • Figure 210: South Asia & Pacific Market Y-o-Y Growth (%) Projections by Formulation, 2025-2035
  • Figure 211: South Asia & Pacific Market Attractiveness by Product Type, 2025-2035
  • Figure 212: South Asia & Pacific Market Attractiveness by Active Type, 2025-2035
  • Figure 213: South Asia & Pacific Market Attractiveness by Channel, 2025-2035
  • Figure 214: South Asia & Pacific Market Attractiveness by End User, 2025-2035
  • Figure 215: South Asia & Pacific Market Attractiveness by Formulation, 2025-2035
  • Figure 216: South Asia & Pacific Market Attractiveness by Country, 2025-2035
  • Figure 217: Middle East and Africa Market Value (USD Million) by Product Type, 2025-2035
  • Figure 218: Middle East and Africa Market Value (USD Million) by Active Type, 2025-2035
  • Figure 219: Middle East and Africa Market Value (USD Million) by Channel, 2025-2035
  • Figure 220: Middle East and Africa Market Value (USD Million) by End User, 2025-2035
  • Figure 221: Middle East and Africa Market Value (USD Million) by Formulation, 2025-2035
  • Figure 222: Middle East and Africa Market Value (USD Million) by Country, 2025-2035
  • Figure 223: Middle East and Africa Market Value (USD Million) Analysis by Country, 2020-2035
  • Figure 224: Middle East and Africa Market Volume (Units) Analysis by Country, 2020-2035
  • Figure 225: Middle East and Africa Market Value Share (%) and BPS Analysis by Country, 2025-2035
  • Figure 226: Middle East and Africa Market Y-o-Y Growth (%) Projections by Country, 2025-2035
  • Figure 227: Middle East and Africa Market Value (USD Million) Analysis by Product Type, 2020-2035
  • Figure 228: Middle East and Africa Market Volume (Units) Analysis by Product Type, 2020-2035
  • Figure 229: Middle East and Africa Market Value Share (%) and BPS Analysis by Product Type, 2025-2035
  • Figure 230: Middle East and Africa Market Y-o-Y Growth (%) Projections by Product Type, 2025-2035
  • Figure 231: Middle East and Africa Market Value (USD Million) Analysis by Active Type, 2020-2035
  • Figure 232: Middle East and Africa Market Volume (Units) Analysis by Active Type, 2020-2035
  • Figure 233: Middle East and Africa Market Value Share (%) and BPS Analysis by Active Type, 2025-2035
  • Figure 234: Middle East and Africa Market Y-o-Y Growth (%) Projections by Active Type, 2025-2035
  • Figure 235: Middle East and Africa Market Value (USD Million) Analysis by Channel, 2020-2035
  • Figure 236: Middle East and Africa Market Volume (Units) Analysis by Channel, 2020-2035
  • Figure 237: Middle East and Africa Market Value Share (%) and BPS Analysis by Channel, 2025-2035
  • Figure 238: Middle East and Africa Market Y-o-Y Growth (%) Projections by Channel, 2025-2035
  • Figure 239: Middle East and Africa Market Value (USD Million) Analysis by End User, 2020-2035
  • Figure 240: Middle East and Africa Market Volume (Units) Analysis by End User, 2020-2035
  • Figure 241: Middle East and Africa Market Value Share (%) and BPS Analysis by End User, 2025-2035
  • Figure 242: Middle East and Africa Market Y-o-Y Growth (%) Projections by End User, 2025-2035
  • Figure 243: Middle East and Africa Market Value (USD Million) Analysis by Formulation, 2020-2035
  • Figure 244: Middle East and Africa Market Volume (Units) Analysis by Formulation, 2020-2035
  • Figure 245: Middle East and Africa Market Value Share (%) and BPS Analysis by Formulation, 2025-2035
  • Figure 246: Middle East and Africa Market Y-o-Y Growth (%) Projections by Formulation, 2025-2035
  • Figure 247: Middle East and Africa Market Attractiveness by Product Type, 2025-2035
  • Figure 248: Middle East and Africa Market Attractiveness by Active Type, 2025-2035
  • Figure 249: Middle East and Africa Market Attractiveness by Channel, 2025-2035
  • Figure 250: Middle East and Africa Market Attractiveness by End User, 2025-2035
  • Figure 251: Middle East and Africa Market Attractiveness by Formulation, 2025-2035
  • Figure 252: Middle East and Africa Market Attractiveness by Country, 2025-2035

Frequently Asked Questions

How big is the Anti-Foaming Personal Care Products Market in 2025?

The Anti-Foaming Personal Care Products Market is estimated to be valued at USD 2,406.7 million in 2025.

What will be the size of the Anti-Foaming Personal Care Products Market in 2035?

The market size for the Anti-Foaming Personal Care Products Market is projected to reach USD 5,004.3 million by 2035.

How much will be the Anti-Foaming Personal Care Products Market growth between 2025 and 2035?

The Anti-Foaming Personal Care Products Market is expected to grow at a 7.6% CAGR between 2025 and 2035.

What are the key product types in the Anti-Foaming Personal Care Products Market?

The key product types in the Anti-Foaming Personal Care Products Market are shampoos & conditioners, body washes & shower gels, facial cleansers, and hand washes.

Which active type segment will contribute significant share in the Anti-Foaming Personal Care Products Market in 2025?

In terms of active type, silicone-based defoamers are projected to command 46.3% share in 2025 in the Anti-Foaming Personal Care Products Market.

Explore Similar Insights

Future Market Insights

Anti-Foaming Personal Care Products Market

Chat With

MaRIA

Hi There, I am MaRIA, Your Market Research Intelligence Assistant. How may I help you?