The arthrogryposis management market is estimated to be valued at USD 502.7 million in 2025 and is projected to reach USD 900.3 million by 2035, registering a compound annual growth rate (CAGR) of 6.0% over the forecast period.
The market encompasses therapeutic interventions, medical devices, and specialized care protocols designed to address the complex mobility and functional challenges associated with congenital joint contracture conditions. Healthcare systems worldwide allocate resources toward multidisciplinary treatment approaches that combine orthopedic interventions, physical therapy equipment, adaptive devices, and surgical instruments specifically engineered for pediatric and adult populations affected by various arthrogryposis subtypes.
Medical device manufacturers collaborate with orthopedic specialists, rehabilitation engineers, and physiotherapy professionals to develop solutions that address joint mobility limitations, muscle weakness patterns, and functional independence goals across different severity classifications.
Treatment protocols typically involve staged interventions beginning in early infancy, requiring specialized pediatric equipment designed for small anatomical structures and developing musculoskeletal systems. Neonatal intensive care units maintain inventories of positioning devices, splinting materials, and range-of-motion apparatus that accommodate the unique needs of newborns presenting with multiple joint contractures.
Supply chains for these medical products involve manufacturers who understand the precision requirements for pediatric applications while managing production volumes that reflect the relatively low incidence rates of arthrogryposis conditions. Healthcare procurement departments balance cost considerations against the specialized nature of required equipment, often establishing relationships with suppliers who provide training and technical support alongside product delivery.
Surgical intervention markets center on corrective procedures performed by orthopedic surgeons with subspecialty training in congenital limb deformities and joint reconstruction techniques. Operating rooms require specialized instrumentation sets designed for tendon transfers, joint releases, and osteotomy procedures that address the mechanical constraints imposed by contractured joints.
Medical device companies invest in research and development programs focused on creating surgical tools that accommodate the anatomical variations present in arthrogryposis patients, while ensuring compatibility with standard operating room sterilization and storage protocols. Training programs for surgical staff emphasize the unique considerations involved in arthrogryposis procedures, creating demand for educational materials and simulation equipment.
Rehabilitation equipment markets serve long-term management needs through adaptive mobility devices, exercise apparatus, and daily living aids that promote functional independence despite persistent joint limitations. Physical therapy clinics maintain specialized equipment inventories including standing frames, gait training devices, and strengthening apparatus modified for patients with limited joint mobility.
Occupational therapy departments require adaptive tools for hand function training, writing aids, and environmental control systems that accommodate reduced upper extremity range of motion. Insurance reimbursement policies significantly influence equipment selection decisions, with providers navigating approval processes that vary across different healthcare systems and coverage plans.
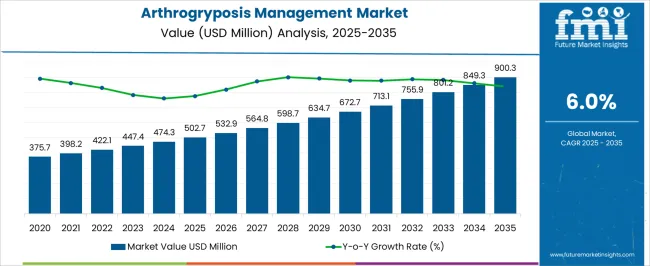
| Metric | Value |
|---|---|
| Arthrogryposis Management Market Estimated Value in (2025 E) | USD 502.7 million |
| Arthrogryposis Management Market Forecast Value in (2035 F) | USD 900.3 million |
| Forecast CAGR (2025 to 2035) | 6.0% |
The arthrogryposis management market is experiencing steady progress as awareness of congenital joint contractures increases and demand for multidisciplinary treatment approaches strengthens. Rising diagnosis rates in pediatric populations and growing availability of rehabilitative care programs are fostering adoption of comprehensive therapies.
Advancements in orthotic devices, physiotherapy techniques, and surgical interventions are further improving patient outcomes. Healthcare systems are placing emphasis on early detection and intervention to enhance mobility, independence, and quality of life for affected individuals.
Supportive government policies, improved clinical infrastructure, and rising focus on rare disease management are reinforcing market expansion. The outlook remains positive as increasing collaboration between specialists, rehabilitation centers, and patient advocacy groups continues to drive innovation and accessibility in arthrogryposis care worldwide.
The market is segmented by Treatment Type and Distribution Channel and region. By Treatment Type, the market is divided into Occupational Therapies, Physical Therapy, Surgery, Imaging Diagnostics, and CT Scan. In terms of Distribution Channel, the market is classified into Hospital Pharmacies, Retail Pharmacies, and Online Pharmacies. Regionally, the market is classified into North America, Latin America, Western Europe, Eastern Europe, Balkan & Baltic Countries, Russia & Belarus, Central Asia, East Asia, South Asia & Pacific, and the Middle East & Africa.
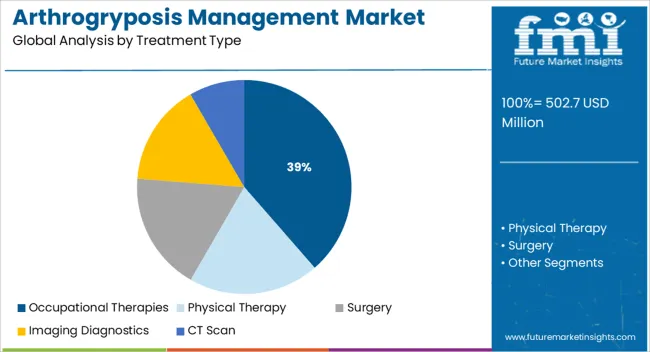
The occupational therapies segment is projected to hold 38.60% of total revenue by 2025 within the treatment type category, establishing it as the leading segment. Its prominence is linked to the effectiveness of tailored interventions that improve daily living skills, mobility, and independence in patients with arthrogryposis.
Therapists provide customized assistive devices and adaptive strategies that enable individuals to better perform essential tasks, thereby enhancing overall quality of life. Growing emphasis on patient centric care models and long term rehabilitative programs has supported wider adoption of occupational therapies.
Moreover, the integration of advanced therapeutic tools and techniques into care practices has strengthened their role as a primary treatment choice, positioning this segment at the forefront of market growth.
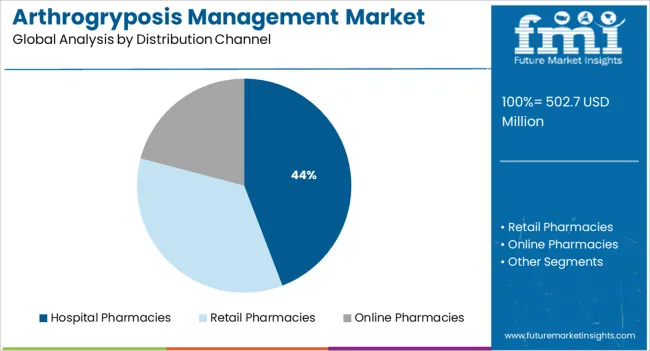
The hospital pharmacies segment is expected to account for 44.20% of market revenue by 2025 under the distribution channel category, making it the most dominant segment. This leadership is supported by the extensive reliance of patients and caregivers on hospital settings for access to specialized treatments, orthotic devices, and prescription medicines associated with arthrogryposis management.
Hospital pharmacies ensure availability of a wide range of therapeutic solutions while maintaining compliance with stringent quality and safety standards. Their integration within multidisciplinary treatment pathways allows patients to receive coordinated and timely access to medications and rehabilitation aids.
The central role of hospital based care in managing complex and rare conditions has reinforced the importance of hospital pharmacies as the leading distribution channel.
According to market research and competitive intelligence provider Future Market Insights- the market for arthrogryposis management reflected a value of 4% during the historical period, 2020 to 2025. Urban lifestyles and degrading habits are expected to increase the demand for Arthrogryposis Management and treatment facilities. Due to the hectic life patterns of the citizens working in cities, there has been an observed increase in stress and sleeplessness. These challenges are emerging as the main factor for the deteriorating health of the urban population.
Arthrogryposis is a rare disorder that occurs in 1 out of every 3000 live births. The number of males and females affected by AMC is approximately equal. The condition has been reported in individuals of Asian, African, and European descent. Isolated congenital contractures affect about 1 in 500 individuals in the general population.
The rise of emerging markets in developing countries is an opportunity that is projected to bolster market growth. In the years to come, increasing focus by government organizations and private agencies like WHO and pharmaceutical companies to create awareness of Arthrogryposis is fuelling the market growth. Thus, the market for Arthrogryposis Management is expected to register a CAGR of 6% in the forecast period 2025 to 2035.
Increased Incidence of Arthrogryposis Cases to Push the Market Growth
In recent years, factors such as increased incidence of arthrogryposis cases, rise in geriatric population, increasing number of government initiatives, ease of purchase, investment by research and development in pharmaceutical companies, increased demand for early diagnosis for arthrogryposis treatment are predicted to drive the market growth.
The expanding senior population, as well as the increased prevalence of osteoarthritis and occurrences of orthopedic injury, are driving market development. In the forthcoming years, the frequency of bone injuries, diabetes, and obesity is expected to climb, bolstering the market.
One of the most common orthopedic operations is total knee arthroplasty (TKA), often known as total knee replacement. In addition, multiple studies have shown that after knee arthroplasty, the obese population's functionality improves.
The investments in healthcare infrastructure have given the market leaders in the market an opportunity to create their mark and stand out and take over the majority of revenue share. According to the Centers for Disease Control and Prevention, an estimated 34.6 million adults will have arthritis-related activity limitations by 2040. This has resulted in a growing preference for active and healthy lifestyles, creating a demand for faster injury-healing processes.
Expensive Cost of Treatment to restrict Market Growth
The expensive treatment of Arthrogryposis Management, less awareness of Arthrogryposis Management disease, and insubstantial treatment options are hampering the market growth.
Furthermore, lack of health remuneration policies, rise in cost, and side effects associated with the use of antibiotics are expected to hinder the market growth.
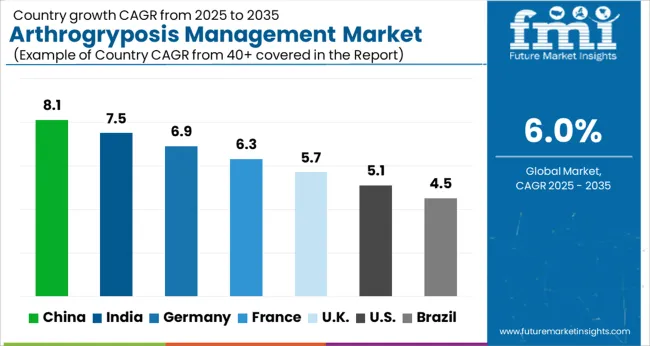
Improvement in healthcare spending propelling the growth of Arthrogryposis Management in Asia Pacific
The Asia Pacific is expected to exhibit the significant growth rate of all regions over the forecast period, at a CAGR of 5% during the forecast period. The growth is owed to increased awareness, significant increases in healthcare spending, and a rising frequency of arthrogryposis management in the region.
Asia Pacific is an emerging market due to the increase in point of care approach to health & care. An increasing number of hospitals in India and China makes a promising market for the treatment market worldwide.
Technological Advancements Shaping Landscape for Arthrogryposis Management in North America
North America is anticipated to acquire a market share of about 25% in the forecast period. This growth is attributable to the rising prevalence of the condition in the region.
An increasing number of surgeries and the presence of leading technological advancements in the healthcare sector along with the rising medical tourism, high patient awareness levels, an increasing number of accidents, and the growing popularity of minimally invasive surgeries are also widening prospects across the continent.
Furthermore, due to the presence of leading technological advancements in the healthcare sector and healthcare facilities with the advancements in technology, efficient treatments are being introduced.
Surgery as an Effective Treatment to drive the market
According to a study, in some cases, surgery may be necessary to achieve better positioning and increase the range of motion in certain joints, especially the ankles, knees, hips, elbows, or wrists. In rare cases, tendon transfers have been performed to improve muscle function.
Furthermore, according to FMI’s analysis, in order to achieve desirable and long-term results a multidisciplinary approach is required. This includes pediatricians, neurologists, orthopedists, rehabilitation physicians and therapists, and medical geneticists. Genetic counseling may be recommended for affected individuals and their families. Other treatments are symptomatic and supportive.
Hospital Pharmacies to take the lead and drive market growth
The distribution segment has been divided into Hospital Pharmacies, Retail Pharmacies, and Online Pharmacies. According to the FMI analysis, Hospital pharmacies account for the largest market share.
The requirement for several hospital stays and visits during the Arthrogryposis Management Market facilitates the growth of this segment. Hospitals are also emphasizing the delivery of various comprehensive programs with personalized and professional support in the management of target diseases.
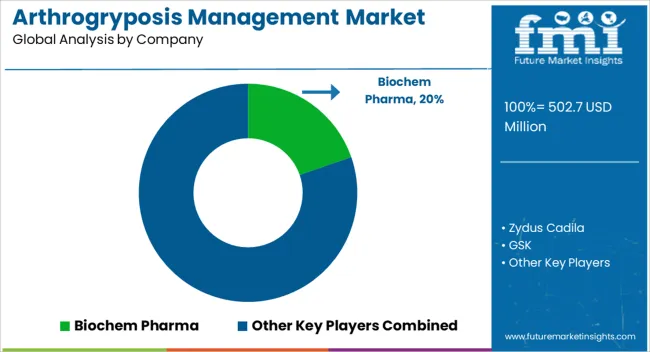
The arthrogryposis management market is characterized by a mix of pharmaceutical leaders, biotechnology innovators, and medical device companies developing targeted therapies, diagnostic tools, and supportive treatments for musculoskeletal disorders. Pfizer Inc., Sanofi S.A., and GSK plc lead the segment through their portfolios in neuromuscular and orthopedic therapies, investing in research addressing congenital joint contractures and related mobility impairments. Johnson & Johnson Services Inc. and Abbott Laboratories contribute advanced orthopedic devices, surgical tools, and rehabilitation technologies that improve functional outcomes for affected patients.
Zydus Cadila and Biochem Pharma focus on affordable therapeutic formulations and supportive drugs to enhance muscle tone and joint flexibility, particularly in emerging healthcare markets. F. Hoffmann-La Roche Ltd. and Viatris Inc. engage in neuromuscular research and pain management therapies that support comprehensive care approaches. Galderma Laboratories L.P. and Medimetriks Pharmaceuticals Inc. extend treatment coverage to dermatologic complications and skin integrity associated with prolonged immobilization.
On the diagnostics and genomic front, Illumina Inc., Thermo Fisher Scientific Inc., and Takara Bio Inc. provide genetic sequencing and biomarker identification technologies that enable early diagnosis and personalized intervention strategies. Vernalis Ltd. supports drug discovery collaborations targeting rare musculoskeletal conditions. The market’s competitiveness centers on innovation in therapeutic design, early genetic screening, and multi-disciplinary rehabilitation integration.
| Report Attribute | Details |
|---|---|
| Market Value in 2025 | USD 502.7 million |
| Market Value in 2035 | USD 900.3 million |
| Growth Rate | CAGR of 6% from 2025 to 2035 |
| Base Year for Estimation | 2025 |
| Historical Data | 2020 to 2025 |
| Forecast Period | 2025 to 2035 |
| Quantitative Units | Revenue in USD Million and CAGR from 2025 to 2035 |
| Report Coverage | Revenue Forecast, Volume Forecast, Company Ranking, Competitive Landscape, Growth Factors, Trends, and Pricing Analysis |
| Segments Covered | Treatment Type, Distribution Channel, Region |
| Regions Covered | North America; Latin America; Europe; Asia Pacific; Middle East & Africa (MEA) |
| Key Countries Profiled | USA, Canada, Brazil, Mexico, Germany, UK, France, Spain, Italy, China, Japan, South Korea, Thailand, Indonesia, Singapore, Australia, New Zealand, GCC Countries, South Africa, Israel |
| Key Companies Profiled | Biochem Pharma, Zydus Cadila, GSK plc, Vernalis Ltd., Sanofi S.A., Pfizer Inc., Galderma Laboratories L.P., Viatris Inc., Johnson & Johnson Services Inc., Medimetriks Pharmaceuticals Inc., F. Hoffmann-La Roche Ltd., Illumina Inc., Thermo Fisher Scientific Inc., Takara Bio Inc., and Abbott Laboratories. |
| Customization | Available Upon Request |
The global arthrogryposis management market is estimated to be valued at USD 502.7 million in 2025.
The market size for the arthrogryposis management market is projected to reach USD 900.3 million by 2035.
The arthrogryposis management market is expected to grow at a 6.0% CAGR between 2025 and 2035.
The key product types in arthrogryposis management market are occupational therapies, physical therapy, surgery, imaging diagnostics and ct scan.
In terms of distribution channel, hospital pharmacies segment to command 44.2% share in the arthrogryposis management market in 2025.


Full Research Suite comprises of:
Market outlook & trends analysis
Interviews & case studies
Strategic recommendations
Vendor profiles & capabilities analysis
5-year forecasts
8 regions and 60+ country-level data splits
Market segment data splits
12 months of continuous data updates
DELIVERED AS:
PDF EXCEL ONLINE
Tax Management Market Size and Share Forecast Outlook 2025 to 2035
Key Management as a Service Market
Cash Management Supplies Packaging Market Size and Share Forecast Outlook 2025 to 2035
Fuel Management Software Market Size and Share Forecast Outlook 2025 to 2035
Risk Management Market Size and Share Forecast Outlook 2025 to 2035
SBOM Management and Software Supply Chain Compliance Market Analysis - Size, Share, and Forecast Outlook 2025 to 2035
Case Management Software (CMS) Market Size and Share Forecast Outlook 2025 to 2035
Farm Management Software Market Size and Share Forecast Outlook 2025 to 2035
Lead Management Market Size and Share Forecast Outlook 2025 to 2035
Pain Management Devices Market Growth - Trends & Forecast 2025 to 2035
Data Management Platforms Market Analysis and Forecast 2025 to 2035, By Type, End User, and Region
Cash Management Services Market – Trends & Forecast 2025 to 2035
CAPA Management (Corrective Action / Preventive Action) Market
Exam Management Software Market
Light Management System Market Size and Share Forecast Outlook 2025 to 2035
Labor Management System In Retail Market Size and Share Forecast Outlook 2025 to 2035
Waste Management Carbon Credit Market Size and Share Forecast Outlook 2025 to 2035
Waste Management Market Size and Share Forecast Outlook 2025 to 2035
Stool Management System Market Analysis - Size, Share, and Forecast Outlook 2025 to 2035
Power Management System Market Analysis - Size, Share, and Forecast Outlook 2025 to 2035

Thank you!
You will receive an email from our Business Development Manager. Please be sure to check your SPAM/JUNK folder too.
Chat With
MaRIA