Reports
- Global Locations -
Headquarters
Future Market Insights, Inc.
Christiana Corporate, 200
Continental Drive, Suite 401,
Newark, Delaware - 19713,
United States
Americas
Future Market Insights, Inc.
616 Corporate Way, Suite 2-9018,
Valley Cottage, NY 10989, United States
MEA
Future Market Insights
1602-6 Jumeirah Bay X2 Tower, Plot No: JLT-PH2-X2A,
Jumeirah Lakes Towers, Dubai,
United Arab Emirates
Europe
Future Market Insights
3rd Floor, 207 Regent Street,
W1B 3HH London
United Kingdom
Asia Pacific
Future Market Insights
Office No. 401-A, 4th Floor,
VANTAGE 9, S.No. 36/1/1,
Baner, Pune 411045, India
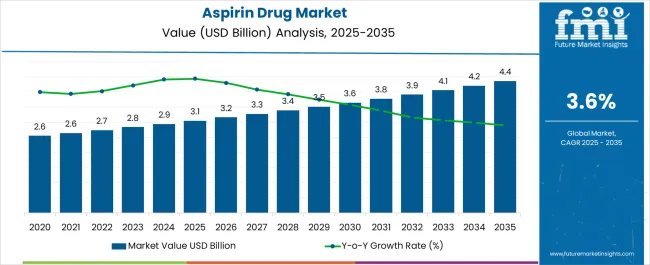
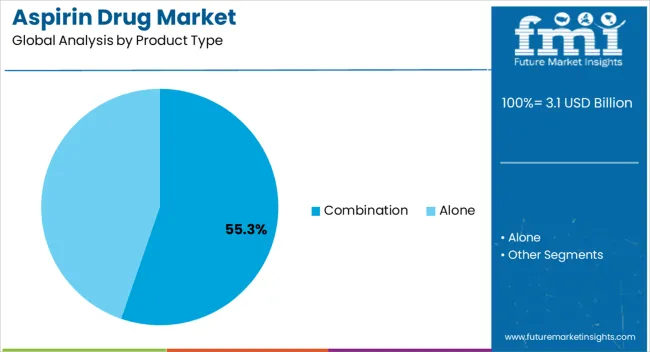
The global aspirin drug market share is expected to account for US$ 2,938.2 million in 2024 and expand at a consistent CAGR of 3.8% to reach a valuation of US$ 4,236.9 million by 2034. According to a recent study by Future Market Insights, a combination aspirin drug is leading the market with a share of about 68% in 2023 within the global market.
Growth in the aspirin industry could be attributed to an increase in conditions like arthritis, pain, and inflammation. The rising incidence of chronic conditions like renal disorders, cardiovascular diseases, and brain strokes among people is driving the aspirin drug market forward. The initiative taken by public and private organizations to spread awareness about myocardial infarction is expected to elevate the market scope further.
Data Points | Market Insights |
---|---|
Aspirin Drug Market Size, 2023 | US$ 2,831.8 million |
Aspirin Drug Market Size, 2024 | US$ 2,938.2 million |
Aspirin Drug Market Size, 2034 | US$ 4,236.9 million |
CAGR 2024 to 2034 | 3.8% |
Don't pay for what you don't need
Customize your report by selecting specific countries or regions and save 30%!
Attributes | Details |
---|---|
Aspirin Drug Market Size (2019) | US$ 2,471.6 million |
Aspirin Drug Market Size (2023) | US$ 2,831.8 million |
Aspirin Drug Market CAGR % (2019 to 2023) | 3.4% |
The market value for aspirin drugs was around 18.6% of the overall US$ 15.1 billion of the global non-steroidal anti-inflammatory drugs (NSAIDs) market in 2023.
The sale of aspirin drugs expanded at a CAGR of 3.4% from 2019 to 2023 owing to rising diseases like pain, fever, inflammation, rheumatoid arthritis, and systemic lupus erythematosus. This can be attributed to the consumption of aspirin as a blood-thinning agent in treating chronic diseases. Further, it reduces the risk of blood clot formation and treats minor pain and aches.
The aspirin drug market continues to expand due to new drug research, commercial use, and development breakthroughs. For instance, in July 2019, Dr Reddy's Laboratories launched rosuvastatin, aspirin, and clopidogrel FDC under Rozat Gold.
Over the forecast period, the market is projected to be driven by the pharmaceutical industry's rising efforts in discovering novel treatments to treat chronic diseases. The global aspirin drug market is expected to register a CAGR of 3.8% from 2024 to 2034.
Historical CAGR % (2019 to 2023) | 3.4% |
---|---|
Forecast CAGR % (2024 to 2034) | 3.8% |
The table below gives a broad idea of the aspirin drug, the drug formulation market, and the empty capsule market. Key insights emerging from this table include key drivers, opportunities, and trends for their respective needs.
Aspirin Drug Market:
Attributes | Aspirin Drug Market |
---|---|
CAGR (2024 to 2034) | 3.8% |
Growth Factor | The pervasive use of aspirin drugs in the treatment of various diseases. |
Future Opportunities | Constant research and development efforts for aspirin drug development. |
Market Trends | Increasing efforts to ramp up the production of aspiring drugs. |
Drug Formulation Market:
Attributes | Drug Formulation Market |
---|---|
CAGR (2024 to 2034) | 5.6% |
Growth Factor | Growing demand for oral formulations. |
Future Opportunities | Continuous breakthroughs in personalized medicine open avenues for future growth. |
Market Trends | Surging utilization of affordable manufacturing technologies. |
Empty Capsule Market:
Attributes | Empty Capsule Market |
---|---|
CAGR (2024 to 2034) | 7.9% |
Growth Factor | Surging popularity of capsules over other drug delivery formats. |
Future Opportunities | The growing interest in gelatin capsules is expected to increase opportunities for market players. |
Market Trends | The increasing geriatric population is seeking easy-to-use drug forms. |
Country | The United States |
---|---|
CAGR (2024 to 2034) | 3.9% |
The United States is expected to seize a 25.7% global market share in 2024. Recent market projections indicate continued profitable prospects in North America. The primary driver of the target market is the increasing need for aspirin to manage chronic pain. Chronic pain, especially in adults, is rising in the United States due to sitting for an extended time. Aspirin drug acts as a painkiller for chronic pain. For instance, in a report published by the Centers for Disease Control and Prevention, a prevalence of chronic pain as well as high-impact chronic pain was found among United States adults, with 4% (50.0 million) suffering from chronic pain and 8.0% (19.6 million) from high-impact chronic pain, respectively. These are key driving factors propelling this region's demand for aspirin drugs.
Country | Germany |
---|---|
CAGR (2024 to 2034) | 3.1% |
In Europe, Germany is anticipated to acquire a significant share of 26.5% of the aspirin drug market in 2024. In 2024, the German aspirin drug market is predicted to reach US$ 187.8 million, followed by a CAGR of 3.1% through 2034.
Country | The United Kingdom |
---|---|
CAGR (2024 to 2034) | 3.2% |
The aspirin drug market in the United Kingdom is expected to acquire a mere 3.2% global market share in 2024. In Europe, the market share is estimated to be a notable 21.1%. After attaining a market value of US$ 88.2 million in 2024, the market is expected to record a CAGR of 3.2% through 2034. The following factors support the regional growth:
Country | India |
---|---|
CAGR (2024 to 2034) | 3.4% |
The aspirin drug market in India is set to exhibit a CAGR of 3.4% in 2034. In India, substantial financing and the launch of several healthcare programs, like Pradhan Mantri Jan Arogya Yojana and Ayushman Bharat, which offer accessible healthcare facilities and reimbursement options to patients receiving healthcare treatment, are boosting the product demand. Other factors leading to product sales are:
Country | China |
---|---|
CAGR (2024 to 2034) | 3.6% |
China holds around 5.4% share in the global market in 2023, owing to the prevalence of increasing cardiovascular diseases like stroke or heart attack. China is one of the leading producers of aspirin drugs. Around two-thirds of aspirin is now produced in China. Drug development of aspirin drugs is significantly increasing in China due to rising research funding. These factors are predicted to drive sales of aspirin drugs in China. Additionally, due to the increase in the production and export of APIs, which accounts for 20% of global output, China is considered one of the top leaders in the region.
Get the data you need at a Fraction of the cost
Personalize your report by choosing insights you need
and save 40%!
Leading Product Type | Combination |
---|---|
CAGR | 4% |
The combination is anticipated to account for 68% value share in 2024. The segment is expected to display a CAGR of 4.0% through 2034. Antiplatelet agents are a class of drugs that include extended-release dipyridamole and a combination of aspirin. A combination of aspirin prevents excessive blood clotting, leading to widespread adoption.
Leading Dosage Form | Tablets |
---|---|
Market Share % (2024) | 3.4% |
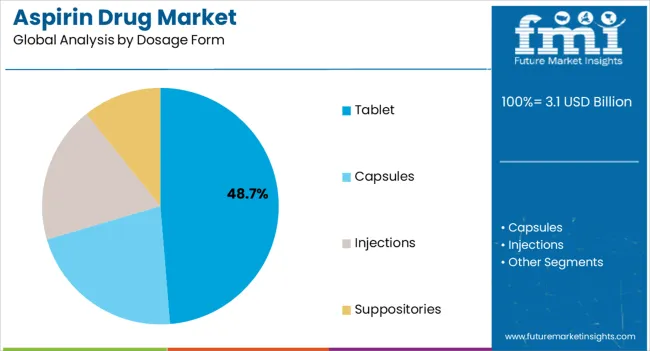
The tablets segment is anticipated to hold a market share of 44.8% in 2024. Over the forecast period, the segment is expected to grow gradually, with an estimated CAGR of 3.4% through 2034. Tablets are the easiest and safest way to consume the drug. Further, it helps to alleviate fever and relieve pain from conditions such as toothaches, muscle aches, and the common cold. These factors are increasing the sales of aspirin drugs in tablet form.
Leading Route of Administration | Oral |
---|---|
CAGR | 3.5% |
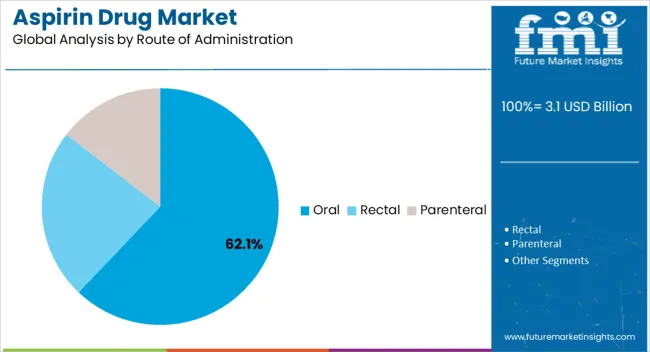
The oral route of administration usage is more as compared to rectal and parenteral. Topical holds a prominent market share value of 49.8% in 2024, followed by a CAGR of 3.5% through 2034. Owing to its advantages, such as patient compliance, non-invasiveness, and convenience of drug administration, the oral route of administration is the favored method.
Leading Age Group | Pediatric |
---|---|
CAGR | 56.2% |
Pediatrics is projected to hold a market share of 56.2% in 2024. The segment is expected to grow gradually over the forecast period, with an estimated CAGR of 3.8% through 2034. Aspirin drug dosage is quite effective in pediatric populations suffering from diseases like chicken pox and flu-like symptoms. The weak immune system of the pediatric population makes them an easy target for these diseases. Hence, aspirin drug is commonly used in the medicine of the pediatric population.
Leading Distribution Channel | Retail Pharmacies |
---|---|
CAGR | 3.4% |
Retail Pharmacies are anticipated to register a prominent share of 44.0% in the aspirin drug market in 2024, with a CAGR of 3.4% through 2034. The easy availability of drugs in all forms in retail pharmacies supports the increasing purchases of medicines from these pharmacies.
The market for the production of aspirin drugs is fragmented, with several competitors. These businesses are employing strategies including collaborations, partnerships, mergers and acquisitions, and new drug releases to meet consumer demand and amplify their client base. Governments across the globe are also taking initiatives to invest in life-saving drugs like aspirin.
Similarly, the team at Future Market Insights has tracked recent developments related to pharmaceutical companies manufacturing aspirin drugs, which are available in the full report.
1. Executive Summary 1.1. Global Market Outlook 1.2. Demand Side Trends 1.3. Supply-Side Trends 1.4. Analysis and Recommendations 2. Market Overview 2.1. Market Coverage / Taxonomy 2.2. Market Definition / Scope / Limitations 2.3. Inclusions and Exclusions 3. Key Market Trends 3.1. Key Trends Impacting the Market 3.2. Development/Innovation Trends 4. Key Success Factors 4.1. Product Adoption / Usage Analysis 4.2. New Product Launches 4.3. Technology Roadmap 4.4. PESTEL Analysis 4.5. Porter’s Analysis 4.6. Key Promotional Strategies, By Key Manufacturers 4.7. Regulatory Landscape 5. Market Background 5.1. Macro-Economic Factors 5.1.1. Global GDP Growth Outlook 5.1.2. Global Healthcare Expenditure 5.2. Forecast Factors - Relevance & Impact 5.2.1. Key Player’s Historic Growth 5.2.2. Market Consolidation Activities 5.2.3. Formulation and Development 5.2.4. Rising Prevalence of Cardiovascular Disease 5.2.5. Growing Preference of Aspirin Drugs 5.2.6. Rising Pain and Inflammation 5.2.7. Regulatory Imposition 5.3. Market Dynamics 5.3.1. Drivers 5.3.2. Restraints 5.3.3. Opportunity Analysis 6. Global Market Demand Value or Size (in US$ Million) Analysis 2017 to 2022 and Forecast, 2023 to 2033 6.1. Historical Market Value (US$ Million) Analysis, 2017 to 2022 6.2. Current and Future Market Value (US$ Million) Projections, 2023 to 2033 6.2.1. Y-o-Y Growth Trend Analysis 6.2.2. Absolute $ Opportunity Analysis 7. Global Market Analysis 2017 to 2022 and Forecast 2023 to 2033, By Product 7.1. Introduction / Key Findings 7.2. Historical Market Size (US$ Million) Analysis By Product, 2017 to 2022 7.3. Current and Future Market Size (US$ Million) Analysis and Forecast By Product, 2023 to 2033 7.3.1. Alone 7.3.2. Combination 7.4. Market Attractiveness Analysis By Product 8. Global Market Analysis 2017 to 2022 and Forecast 2023 to 2033, By Dosage Form 8.1. Introduction / Key Findings 8.2. Historical Market Size (US$ Million) By Dosage Form, 2017 to 2022 8.3. Current and Future Market Size (US$ Million) Analysis and Forecast By Dosage Form, 2023 to 2033 8.3.1. Tablet 8.3.2. Capsules 8.3.3. Injections 8.3.4. Suppositories 8.4. Market Attractiveness Analysis By Dosage Form 9. Global Market Analysis 2017 to 2022 and Forecast 2023 to 2033, By Route of Administration 9.1. Introduction / Key Findings 9.2. Historical Market Size (US$ Million) Analysis By Route of Administration, 2017 to 2022 9.3. Current and Future Market Size (US$ Million) Analysis and Forecast By Route of Administration, 2023 to 2033 9.3.1. Oral 9.3.1. Rectal 9.3.1. Parentral 9.4. Market Attractiveness Analysis By Route of Administration 10. Global Market Analysis 2017 to 2022 and Forecast 2023 to 2033, By Age 10.1. Introduction / Key Findings 10.2. Historical Market Size (US$ Million) Analysis By Age, 2017 to 2022 10.3. Current and Future Market Size (US$ Million) Analysis and Forecast By Age, 2023 to 2033 10.3.1. Adult 10.3.2. Pediatric 10.4. Market Attractiveness Analysis By Age 11. Global Market Analysis 2017 to 2022 and Forecast 2023 to 2033, By Distribution Channel 11.1. Introduction / Key Findings 11.2. Historical Market Size (US$ Million) By Distribution Channel, 2017 to 2022 11.3. Current and Future Market Size (US$ Million) Analysis and Forecast By Distribution Channel, 2023 to 2033 11.3.1. Retail Pharmacies 11.3.2. Hospital Pharmacies 11.3.3. Online Pharmacies 11.4. Market Attractiveness Analysis By Distribution Channel 12. Global Market Analysis 2017 to 2022 and Forecast 2023 to 2033, By Region 12.1. Introduction 12.2. Historical Market Size (US$ Million) Analysis by Region, 2017 to 2022 12.3. Current Market Size (US$ Million) Analysis and Forecast by Region, 2023 to 2033 12.3.1. North America 12.3.2. Latin America 12.3.3. Europe 12.3.4. East Asia 12.3.5. South Asia 12.3.6. Oceania 12.3.7. Middle East and Africa (MEA) 12.4. Market Attractiveness Analysis By Region 13. North America Market Analysis 2017 to 2022 and Forecast 2023 to 2033 13.1. Introduction 13.2. Historical Market Size (US$ Million) Trend Analysis by Market Taxonomy, 2017 to 2022 13.3. Current and Future Market Size (US$ Million) Analysis and Forecast by Market Taxonomy, 2023 to 2033 13.3.1. By Country 13.3.1.1. USA 13.3.1.2. Canada 13.3.2. By Product 13.3.3. By Dosage Form 13.3.4. By Route of Administration 13.3.5. By Age 13.3.6. By Distribution Channel 13.4. Market Attractiveness Analysis 13.4.1. By Country 13.4.2. By Product 13.4.3. By Dosage Form 13.4.4. By Route of Administration 13.4.5. By Age 13.4.6. By Distribution Channel 13.5. Market Trends 13.6. Key Market Participants - Intensity Mapping 13.7. Drivers and Restraints - Impact Analysis 13.8. Country Level Analysis & Forecast 13.8.1. USA. Market Analysis 13.8.1.1. Introduction 13.8.1.2. Market Analysis and Forecast by Market Taxonomy 13.8.1.2.1. By Product 13.8.1.2.2. By Dosage Form 13.8.1.2.3. By Route of Administration 13.8.1.2.4. By Age 13.8.1.2.5. By Distribution Channel 13.8.2. Canada Market Analysis 13.8.2.1. Introduction 13.8.2.2. Market Analysis and Forecast by Market Taxonomy 13.8.2.2.1. By Product 13.8.2.2.2. By Dosage Form 13.8.2.2.3. By Route of Administration 13.8.2.2.4. By Age 13.8.2.2.5. By Distribution Channel 14. Latin America Market Analysis 2017 to 2022 and Forecast 2023 to 2033 14.1. Introduction 14.2. Historical Market Size (US$ Million) Trend Analysis by Market Taxonomy, 2017 to 2022 14.3. Current and Future Market Size (US$ Million) Analysis and Forecast by Market Taxonomy, 2023 to 2033 14.3.1. By Country 14.3.1.1. Mexico 14.3.1.2. Brazil 14.3.1.3. Argentina 14.3.1.4. Rest of Latin America 14.3.2. By Product 14.3.3. By Dosage Form 14.3.4. By Route of Administration 14.3.5. By Age 14.3.6. By Distribution Channel 14.4. Market Attractiveness Analysis 14.4.1. By Country 14.4.2. By Product 14.4.3. By Dosage Form 14.4.4. By Route of Administration 14.4.5. By Age 14.4.6. By Distribution Channel 14.5. Market Trends 14.6. Key Market Participants - Intensity Mapping 14.7. Drivers and Restraints - Impact Analysis 14.8. Country Level Analysis & Forecast 14.8.1. Mexico Market Analysis 14.8.1.1. Introduction 14.8.1.2. Market Analysis and Forecast by Market Taxonomy 14.8.1.2.1. By Product 14.8.1.2.2. By Dosage Form 14.8.1.2.3. By Route of Administration 14.8.1.2.4. By Age 14.8.1.2.5. By Distribution Channel 14.8.2. Brazil Market Analysis 14.8.2.1. Introduction 14.8.2.2. Market Analysis and Forecast by Market Taxonomy 14.8.2.2.1. By Product 14.8.2.2.2. By Dosage Form 14.8.2.2.3. By Route of Administration 14.8.2.2.4. By Age 14.8.2.2.5. By Distribution Channel 14.8.3. Argentina Market Analysis 14.8.3.1. Introduction 14.8.3.2. Market Analysis and Forecast by Market Taxonomy 14.8.3.2.1. By Product 14.8.3.2.2. By Dosage Form 14.8.3.2.3. By Route of Administration 14.8.3.2.4. By Age 14.8.3.2.5. By Distribution Channel 15. Europe Market Analysis 2017 to 2022 and Forecast 2023 to 2033 15.1. Introduction 15.2. Historical Market Size (US$ Million) Trend Analysis by Market Taxonomy, 2017 to 2022 15.3. Current and Future Market Size (US$ Million) Analysis and Forecast by Market Taxonomy, 2023 to 2033 15.3.1. By Country 15.3.1.1. UK 15.3.1.2. Germany 15.3.1.3. Italy 15.3.1.4. France 15.3.1.5. Spain 15.3.1.6. Russia 15.3.1.7. BENELUX 15.3.1.8. Rest of Europe 15.3.2. By Product 15.3.3. By Dosage Form 15.3.4. By Route of Administration 15.3.5. By Age 15.3.6. By Distribution Channel 15.4. Market Attractiveness Analysis 15.4.1. By Country 15.4.2. By Product 15.4.3. By Dosage Form 15.4.4. By Route of Administration 15.4.5. By Age 15.4.6. By Distribution Channel 15.5. Market Trends 15.6. Key Market Participants - Intensity Mapping 15.7. Drivers and Restraints - Impact Analysis 15.8. Country Level Analysis & Forecast 15.8.1. UK Market Analysis 15.8.1.1. Introduction 15.8.1.2. Market Analysis and Forecast by Market Taxonomy 15.8.1.2.1. By Product 15.8.1.2.2. By Dosage Form 15.8.1.2.3. By Route of Administration 15.8.1.2.4. By Age 15.8.1.2.5. By Distribution Channel 15.8.2. Germany Market Analysis 15.8.2.1. Introduction 15.8.2.2. Market Analysis and Forecast by Market Taxonomy 15.8.2.2.1. By Product 15.8.2.2.2. By Dosage Form 15.8.2.2.3. By Route of Administration 15.8.2.2.4. By Age 15.8.2.2.5. By Distribution Channel 15.8.3. Italy Market Analysis 15.8.3.1. Introduction 15.8.3.2. Market Analysis and Forecast by Market Taxonomy 15.8.3.2.1. By Product 15.8.3.2.2. By Dosage Form 15.8.3.2.3. By Route of Administration 15.8.3.2.4. By Age 15.8.3.2.5. By Distribution Channel 15.8.4. France Market Analysis 15.8.4.1. Introduction 15.8.4.2. Market Analysis and Forecast by Market Taxonomy 15.8.4.2.1. By Product 15.8.4.2.2. By Dosage Form 15.8.4.2.3. By Route of Administration 15.8.4.2.4. By Age 15.8.4.2.5. By Distribution Channel 15.8.5. Spain Market Analysis 15.8.5.1. Introduction 15.8.5.2. Market Analysis and Forecast by Market Taxonomy 15.8.5.2.1. By Product 15.8.5.2.2. By Dosage Form 15.8.5.2.3. By Route of Administration 15.8.5.2.4. By Age 15.8.5.2.5. By Distribution Channel 15.8.6. Russia Market Analysis 15.8.6.1. Introduction 15.8.6.2. Market Analysis and Forecast by Market Taxonomy 15.8.6.2.1. By Product 15.8.6.2.2. By Dosage Form 15.8.6.2.3. By Route of Administration 15.8.6.2.4. By Age 15.8.6.2.5. By Distribution Channel 15.8.7. BENELUX Market Analysis 15.8.7.1. Introduction 15.8.7.2. Market Analysis and Forecast by Market Taxonomy 15.8.7.2.1. By Product 15.8.7.2.2. By Dosage Form 15.8.7.2.3. By Route of Administration 15.8.7.2.4. By Age 15.8.7.2.5. By Distribution Channel 16. East Asia Market Analysis 2017 to 2022 and Forecast 2023 to 2033 16.1. Introduction 16.2. Historical Market Size (US$ Million) Trend Analysis by Market Taxonomy, 2017 to 2022 16.3. Current and Future Market Size (US$ Million) Analysis and Forecast by Market Taxonomy, 2023 to 2033 16.3.1. By Country 16.3.1.1. China 16.3.1.2. Japan 16.3.1.3. South Korea 16.3.2. By Product 16.3.3. By Dosage Form 16.3.4. By Route of Administration 16.3.5. By Age 16.3.6. By Distribution Channel 16.4. Market Attractiveness Analysis 16.4.1. By Country 16.4.2. By Product 16.4.3. By Dosage Form 16.4.4. By Route of Administration 16.4.5. By Age 16.4.6. By Distribution Channel 16.5. Market Trends 16.6. Key Market Participants - Intensity Mapping 16.7. Drivers and Restraints - Impact Analysis 16.8. Country Level Analysis & Forecast 16.8.1. China Market Analysis 16.8.1.1. Introduction 16.8.1.2. Market Analysis and Forecast by Market Taxonomy 16.8.1.2.1. By Product 16.8.1.2.2. By Dosage Form 16.8.1.2.3. By Route of Administration 16.8.1.2.4. By Age 16.8.1.2.5. By Distribution Channel 16.8.2. Japan Market Analysis 16.8.2.1. Introduction 16.8.2.2. Market Analysis and Forecast by Market Taxonomy 16.8.2.2.1. By Product 16.8.2.2.2. By Dosage Form 16.8.2.2.3. By Route of Administration 16.8.2.2.4. By Age 16.8.2.2.5. By Distribution Channel 16.8.3. South Korea Market Analysis 16.8.3.1. Introduction 16.8.3.2. Market Analysis and Forecast by Market Taxonomy 16.8.3.2.1. By Product 16.8.3.2.2. By Dosage Form 16.8.3.2.3. By Route of Administration 16.8.3.2.4. By Age 16.8.3.2.5. By Distribution Channel 17. South Asia Market Analysis 2017 to 2022 and Forecast 2023 to 2033 17.1. Introduction 17.2. Historical Market Size (US$ Million) Trend Analysis by Market Taxonomy, 2017 to 2022 17.3. Current and Future Market Size (US$ Million) Analysis and Forecast by Market Taxonomy, 2023 to 2033 17.3.1. By Country 17.3.1.1. India 17.3.1.2. Indonesia 17.3.1.3. Malaysia 17.3.1.4. Thailand 17.3.1.5. Rest of South Asia 17.3.2. By Product 17.3.3. By Dosage Form 17.3.4. By Route of Administration 17.3.5. By Age 17.3.6. By Distribution Channel 17.4. Market Attractiveness Analysis 17.4.1. By Country 17.4.2. By Product 17.4.3. By Dosage Form 17.4.4. By Route of Administration 17.4.5. By Age 17.4.6. By Distribution Channel 17.5. Market Trends 17.6. Key Market Participants - Intensity Mapping 17.7. Drivers and Restraints - Impact Analysis 17.8. Country Level Analysis & Forecast 17.8.1. India Market Analysis 17.8.1.1. Introduction 17.8.1.2. Market Analysis and Forecast by Market Taxonomy 17.8.1.2.1. By Product 17.8.1.2.2. By Dosage Form 17.8.1.2.3. By Route of Administration 17.8.1.2.4. By Age 17.8.1.2.5. By Distribution Channel 17.8.2. Indonesia Market Analysis 17.8.2.1. Introduction 17.8.2.2. Market Analysis and Forecast by Market Taxonomy 17.8.2.2.1. By Product 17.8.2.2.2. By Dosage Form 17.8.2.2.3. By Route of Administration 17.8.2.2.4. By Age 17.8.2.2.5. By Distribution Channel 17.8.3. Malaysia Market Analysis 17.8.3.1. Introduction 17.8.3.2. Market Analysis and Forecast by Market Taxonomy 17.8.3.2.1. By Product 17.8.3.2.2. By Dosage Form 17.8.3.2.3. By Route of Administration 17.8.3.2.4. By Age 17.8.3.2.5. By Distribution Channel 17.8.4. Thailand Market Analysis 17.8.4.1. Introduction 17.8.4.2. Market Analysis and Forecast by Market Taxonomy 17.8.4.2.1. By Product 17.8.4.2.2. By Dosage Form 17.8.4.2.3. By Route of Administration 17.8.4.2.4. By Age 17.8.4.2.5. By Distribution Channel 18. Oceania Market2017-2022 and Forecast 2023-2033 18.1. Introduction 18.2. Historical Market Size (US$ Million) Analysis by Market Taxonomy, 2017 to 2022 18.3. Current and Future Market Size (US$ Million) Analysis and Forecast by Market Taxonomy, 2023 to 2033 18.3.1. By Country 18.3.1.1. Australia 18.3.1.2. New Zealand 18.3.2. By Product 18.3.3. By Dosage Form 18.3.4. By Route of Administration 18.3.5. By Age 18.3.6. By Distribution Channel 18.4. Market Attractiveness Analysis 18.4.1. By Country 18.4.2. By Product 18.4.3. By Dosage Form 18.4.4. By Route of Administration 18.4.5. By Age 18.4.6. By Distribution Channel 18.5. Market Trends 18.6. Key Market Participants - Intensity Mapping 18.7. Drivers and Restraints - Impact Analysis 18.8. Country Level Analysis & Forecast 18.8.1. Australia Market Analysis 18.8.1.1. Introduction 18.8.1.2. Market Analysis and Forecast by Market Taxonomy 18.8.1.2.1. By Product 18.8.1.2.2. By Dosage Form 18.8.1.2.3. By Route of Administration 18.8.1.2.4. By Age 18.8.1.2.5. By Distribution Channel 18.8.2. New Zealand Market Analysis 18.8.2.1. Introduction 18.8.2.2. Market Analysis and Forecast by Market Taxonomy 18.8.2.2.1. By Product 18.8.2.2.2. By Dosage Form 18.8.2.2.3. By Route of Administration 18.8.2.2.4. By Age 18.8.2.2.5. By Distribution Channel 19. Middle East and Africa (MEA) Market Analysis 2017 to 2022 and Forecast 2023 to 2033 19.1. Introduction 19.2. Historical Market Size (US$ Million) Trend Analysis by Market Taxonomy, 2017 to 2022 19.3. Current and Future Market Size (US$ Million) Analysis and Forecast by Market Taxonomy, 2023 to 2033 19.3.1. By Country 19.3.1.1. GCC Countries 19.3.1.2. Türkiye 19.3.1.3. South Africa 19.3.1.4. North Africa 19.3.1.5. Rest of Middle East and Africa 19.3.2. By Product 19.3.3. By Dosage Form 19.3.4. By Route of Administration 19.3.5. By Age 19.3.6. By Distribution Channel 19.4. Market Attractiveness Analysis 19.4.1. By Country 19.4.2. By Product 19.4.3. By Dosage Form 19.4.4. By Route of Administration 19.4.5. By Age 19.4.6. By Distribution Channel 19.5. Market Trends 19.6. Key Market Participants - Intensity Mapping 19.7. Drivers and Restraints - Impact Analysis 19.8. Country Level Analysis & Forecast 19.8.1. GCC Countries Market Analysis 19.8.1.1. Introduction 19.8.1.2. Market Analysis and Forecast by Market Taxonomy 19.8.1.2.1. By Product 19.8.1.2.2. By Dosage Form 19.8.1.2.3. By Route of Administration 19.8.1.2.4. By Age 19.8.1.2.5. By Distribution Channel 19.8.2. Türkiye Market Analysis 19.8.2.1. Introduction 19.8.2.2. Market Analysis and Forecast by Market Taxonomy 19.8.2.2.1. By Product 19.8.2.2.2. By Dosage Form 19.8.2.2.3. By Route of Administration 19.8.2.2.4. By Age 19.8.2.2.5. By Distribution Channel 19.8.3. South Africa Market Analysis 19.8.3.1. Introduction 19.8.3.2. Market Analysis and Forecast by Market Taxonomy 19.8.3.2.1. By Product 19.8.3.2.2. By Dosage Form 19.8.3.2.3. By Route of Administration 19.8.3.2.4. By Age 19.8.3.2.5. By Distribution Channel 19.8.4. North Africa Market Analysis 19.8.4.1. Introduction 19.8.4.2. Market Analysis and Forecast by Market Taxonomy 19.8.4.2.1. By Product 19.8.4.2.2. By Dosage Form 19.8.4.2.3. By Route of Administration 19.8.4.2.4. By Age 19.8.4.2.5. By Distribution Channel 20. Market Structure Analysis 20.1. Market Analysis by Tier of Companies 20.2. Market Share Analysis of Top Players (%) 20.3. Market Presence Analysis 20.3.1. By Regional Footprint of Players 20.3.2. Product Footprint of Players 20.3.3. Channel Footprint of Players 21. Competition Analysis 21.1. Competition Dashboard 21.2. Competition Benchmarking 21.3. Competition Deep Dive 21.3.1. Bayer AG 21.3.1.1. Overview 21.3.1.2. Product & Services Portfolio 21.3.1.3. Key Financials 21.3.1.4. SWOT Analysis 21.3.1.5. Key Developments 21.3.1.6. Sales Footprint 21.3.1.7. Strategy Overview 21.3.1.7.1. Marketing Strategy 21.3.1.7.2. Product Strategy 21.3.1.7.3. Channel Strategy 21.3.2. Dr Reddy's Laboratories 21.3.3. Sanofi S.A 21.3.4. Abbott Laboratories 21.3.5. Sunshine Laboratories India Limited 21.3.6. ANI Pharmaceuticals, Inc 21.3.7. Thermo Fisher Scientefic, 21.3.8. Advance Pharmaceutical Inc. 21.3.9. Allegiant Health, 21.3.10. KEM Pharma LLC 21.3.11. Globalimporter Inc. 21.3.12. Par Pharmaceutical, 21.3.13. Industria Quimica Andina Y Cia Sa, 21.3.14. Cardinal Health 21.3.15. Nanjing pharmaceutical factory Co, ltd. 21.3.16. JQC (Huayin) Pharmaceutical Co., Ltd. 21.3.17. LNK International, Inc. 21.3.18. Perrigo Company plc 21.3.19. Zhenjiang Gaopeng Pharmaceutical CO,.Ltd. 21.3.20. J.M. Loveridge Ltd 21.3.21. Mayne Pharma Group Limited 21.3.22. Eli Lilly and Company 21.3.23. Shandong Xinhua Pharmaceutical Co Ltd 21.3.24. Zhongnan Pharmaceutical 21.3.25. Jilin Pharmaceutical 22. Assumptions and Acronyms Used 23. Research Methodology
Don't pay for what you don't need
Customize your report by selecting specific countries or regions and save 30%!
Table 01: Global Market Analysis 2017 to 2022 and Forecast 2023 to 2033, by Product Table 02: Global Market Analysis 2017 to 2022 and Forecast 2023 to 2033, by Dosage Form Table 03: Global Market Analysis 2017 to 2022 and Forecast 2023 to 2033, by Route of Administration Table 04: Global Market Analysis 2017 to 2022 and Forecast 2023 to 2033, by Age Table 05: Global Market Analysis 2017 to 2022 and Forecast 2023 to 2033, by Distribution Channel Table 06: Global Market Analysis 2017 to 2022 and Forecast 2023 to 2033, by Region Table 07: North America Market Value (US$ Million) Analysis 2017 to 2022 and Forecast 2023 to 2033, by Country Table 08: North America Market Value (US$ Million) Analysis 2017 to 2022 and Forecast 2023 to 2033, by Product Table 09: North America Market Value (US$ Million) Analysis 2017 to 2022 and Forecast 2023 to 2033, by Dosage Form Table 10: North America Market Value (US$ Million) Analysis 2017 to 2022 and Forecast 2023 to 2033, by Route of Administration Table 11: North America Market Value (US$ Million) Analysis 2017 to 2022 and Forecast 2023 to 2033, by Age Table 12: North America Market Value (US$ Million) Analysis 2017 to 2022 and Forecast 2023 to 2033, by Distribution Channel Table 13: Latin America Market Value (US$ Million) Analysis 2017 to 2022 and Forecast 2023 to 2033, by Country Table 14: Latin America Market Value (US$ Million) Analysis 2017 to 2022 and Forecast 2023 to 2033, by Product Table 15: Latin America Market Value (US$ Million) Analysis 2017 to 2022 and Forecast 2023 to 2033, by Dosage Form Table 16: Latin America Market Value (US$ Million) Analysis 2017 to 2022 and Forecast 2023 to 2033, by Route of Administration Table 17: Latin America Market Value (US$ Million) Analysis 2017 to 2022 and Forecast 2023 to 2033, by Age Table 18: Latin America Market Value (US$ Million) Analysis 2017 to 2022 and Forecast 2023 to 2033, by Distribution Channel Table 19: Europe Market Value (US$ Million) Analysis 2017 to 2022 and Forecast 2023 to 2033, by Country Table 20: Europe Market Value (US$ Million) Analysis 2017 to 2022 and Forecast 2023 to 2033, by Product Table 21: Europe Market Analysis 2017 to 2022 and Forecast 2023 to 2033, by Dosage Form Table 22: Europe Market Analysis 2017 to 2022 and Forecast 2023 to 2033, by Route of Administration Table 23: Europe Market Analysis 2017 to 2022 and Forecast 2023 to 2033, by Age Table 24: Europe Market Analysis 2017 to 2022 and Forecast 2023 to 2033, by Distribution Channel Table 25: East Asia Market Value (US$ Million) Analysis 2017 to 2022 and Forecast 2023 to 2033, by Country Table 26: East Asia Market Value (US$ Million) Analysis 2017 to 2022 and Forecast 2023 to 2033, by Product Table 27: East Asia Market Value (US$ Million) Analysis 2017 to 2022 and Forecast 2023 to 2033, by Dosage Form Table 28: East Asia Market Value (US$ Million) Analysis 2017 to 2022 and Forecast 2023 to 2033, by Route of Administration Table 29: East Asia Market Value (US$ Million) Analysis 2017 to 2022 and Forecast 2023 to 2033, by Age Table 30: East Asia Market Value (US$ Million) Analysis 2017 to 2022 and Forecast 2023 to 2033, by Distribution Channel Table 31: South Asia Market Value (US$ Million) Analysis 2017 to 2022 and Forecast 2023 to 2033, by Country Table 32: South Asia Market Value (US$ Million) Analysis 2017 to 2022 and Forecast 2023 to 2033, by Product Table 33: South Asia Market Value (US$ Million) Analysis 2017 to 2022 and Forecast 2023 to 2033, by Dosage Form Table 34: South Asia Market Value (US$ Million) Analysis 2017 to 2022 and Forecast 2023 to 2033, by Route of Administration Table 35: South Asia Market Value (US$ Million) Analysis 2017 to 2022 and Forecast 2023 to 2033, by Age Table 36: South Asia Market Value (US$ Million) Analysis 2017 to 2022 and Forecast 2023 to 2033, by Distribution Channel Table 37: Oceania Market Value (US$ Million) Analysis 2017 to 2022 and Forecast 2023 to 2033, by Country Table 38: Oceania Market Value (US$ Million) Analysis 2017 to 2022 and Forecast 2023 to 2033, by Product Table 39: Oceania Market Analysis 2017 to 2022 and Forecast 2023 to 2033, by Dosage Form Table 40: Oceania Market Analysis 2017 to 2022 and Forecast 2023 to 2033, by Route of Administration Table 41: Oceania Market Analysis 2017 to 2022 and Forecast 2023 to 2033, by Age Table 42: Oceania Market Analysis 2017 to 2022 and Forecast 2023 to 2033, by Distribution Channel Table 43: Middle East & Africa Market Value (US$ Million) Analysis 2017 to 2022 and Forecast 2023 to 2033, by Country Table 44: Middle East & Africa Market Value (US$ Million) Analysis 2017 to 2022 and Forecast 2023 to 2033, by Product Table 45: Middle East & Africa Market Analysis 2017 to 2022 and Forecast 2023 to 2033, by Dosage Form Table 46: Middle East & Africa Market Analysis 2017 to 2022 and Forecast 2023 to 2033, by Route of Administration Table 47: Middle East & Africa Market Analysis 2017 to 2022 and Forecast 2023 to 2033, by Age Table 48: Middle East & Africa Market Analysis 2017 to 2022 and Forecast 2023 to 2033, by Distribution Channel
Figure 01: Global Market Value (US$ Million) Analysis, 2017 to 2022 Figure 02: Global Market Forecast & Y-o-Y Growth, 2023 to 2033 Figure 03: Global Market Absolute $ Opportunity (US$ Million) Analysis, 2022–2033 Figure 04: Global Market Value Share (%) Analysis 2023 and 2033, by Product Figure 05: Global Market Y-o-Y Growth (%) Analysis 2022-2033, by Product Figure 06: Global Market Attractiveness Analysis 2023 to 2033, by Product Figure 07: Global Market Value Share (%) Analysis 2023 and 2033, by Dosage Form Figure 08: Global Market Y-o-Y Growth (%) Analysis 2022-2033, by Dosage Form Figure 09: Global Market Attractiveness Analysis 2023 to 2033, by Dosage Form Figure 10: Global Market Value Share (%) Analysis 2023 and 2033, by Route of Administration Figure 11: Global Market Y-o-Y Growth (%) Analysis 2022-2033, by Route of Administration Figure 12: Global Market Attractiveness Analysis 2023 to 2033, by Route of Administration Figure 13: Global Market Value Share (%) Analysis 2023 and 2033, by Age Figure 14: Global Market Y-o-Y Growth (%) Analysis 2022-2033, by Age Figure 15: Global Market Attractiveness Analysis 2023 to 2033, by Age Figure 16: Global Market Value Share (%) Analysis 2023 and 2033, by Distribution Channel Figure 17: Global Market Y-o-Y Growth (%) Analysis 2022-2033, by Distribution Channel Figure 18: Global Market Attractiveness Analysis 2023 to 2033, by Distribution Channel Figure 19: Global Market Value Share (%) Analysis 2023 and 2033, by Region Figure 20: Global Market Y-o-Y Growth (%) Analysis 2022-2033, by Region Figure 21: Global Market Attractiveness Analysis 2023 to 2033, by Region Figure 22: North America Market Value (US$ Million) Analysis, 2017 to 2022 Figure 23: North America Market Value (US$ Million) Forecast, 2023 to 2033 Figure 24: North America Market Value Share, by Product (2023 E) Figure 25: North America Market Value Share, by Dosage Form (2023 E) Figure 26: North America Market Value Share, by Route of Administration (2023 E) Figure 27: North America Market Value Share, by Age (2023 E) Figure 28: North America Market Value Share, by Distribution Channel (2023 E) Figure 29: North America Market Value Share, by Country (2023 E) Figure 30: North America Market Attractiveness Analysis by Product, 2023 to 2033 Figure 31: North America Market Attractiveness Analysis by Dosage Form, 2023 to 2033 Figure 32: North America Market Attractiveness Analysis by Route of Administration, 2023 to 2033 Figure 33: North America Market Attractiveness Analysis by Age, 2023 to 2033 Figure 34: North America Market Attractiveness Analysis by Distribution Channel, 2023 to 2033 Figure 35: North America Market Attractiveness Analysis by Country, 2023 to 2033 Figure 36: USA. Market Value Proportion Analysis, 2022 Figure 37: Global Vs. USA. Growth Comparison Figure 38: USA. Market Share Analysis (%) by Product, 2022 to 2033 Figure 39: USA. Market Share Analysis (%) by Dosage Form, 2022 to 2033 Figure 40: USA. Market Share Analysis (%) by Route of Administration, 2022 to 2033 Figure 41: USA. Market Share Analysis (%) by Age, 2022 to 2033 Figure 42: USA. Market Share Analysis (%) by Distribution Channel, 2022 to 2033 Figure 43: Canada Market Value Proportion Analysis, 2022 Figure 44: Global Vs. Canada. Growth Comparison Figure 45: Canada Market Share Analysis (%) by Product, 2022 to 2033 Figure 46: Canada Market Share Analysis (%) by Dosage Form, 2022 to 2033 Figure 47: Canada Market Share Analysis (%) by Route of Administration, 2022 to 2033 Figure 48: Canada Market Share Analysis (%) by Age, 2022 to 2033 Figure 49: Canada Market Share Analysis (%) by Distribution Channel, 2022 to 2033 Figure 50: Latin America Market Value (US$ Million) Analysis, 2017 to 2022 Figure 51: Latin America Market Value (US$ Million) Forecast, 2023 to 2033 Figure 52: Latin America Market Value Share, by Product (2023 E) Figure 53: Latin America Market Value Share, by Dosage Form (2023 E) Figure 54: Latin America Market Value Share, by Route of Administration (2023 E) Figure 55: Latin America Market Value Share, by Age (2023 E) Figure 56: Latin America Market Value Share, by Distribution Channel (2023 E) Figure 57: Latin America Market Value Share, by Country (2023 E) Figure 58: Latin America Market Attractiveness Analysis by Product, 2023 to 2033 Figure 59: Latin America Market Attractiveness Analysis by Dosage Form, 2023 to 2033 Figure 60: Latin America Market Attractiveness Analysis by Route of Administration, 2023 to 2033 Figure 61: Latin America Market Attractiveness Analysis by Age, 2023 to 2033 Figure 62: Latin America Market Attractiveness Analysis by Distribution Channel, 2023 to 2033 Figure 63: Latin America Market Attractiveness Analysis by Country, 2023 to 2033 Figure 64: Mexico Market Value Proportion Analysis, 2022 Figure 65: Global Vs Mexico Growth Comparison Figure 66: Mexico Market Share Analysis (%) by Product, 2022 to 2033 Figure 67: Mexico Market Share Analysis (%) by Dosage Form, 2022 to 2033 Figure 68: Mexico Market Share Analysis (%) by Route of Administration, 2022 to 2033 Figure 69: Mexico Market Share Analysis (%) by Age, 2022 to 2033 Figure 70: Mexico Market Share Analysis (%) by Distribution Channel, 2022 to 2033 Figure 71: Brazil Market Value Proportion Analysis, 2022 Figure 72: Global Vs. Brazil. Growth Comparison Figure 73: Brazil Market Share Analysis (%) by Product, 2022 to 2033 Figure 74: Brazil Market Share Analysis (%) by Dosage Form, 2022 to 2033 Figure 75: Brazil Market Share Analysis (%) by Route of Administration, 2022 to 2033 Figure 76: Brazil Market Share Analysis (%) by Age, 2022 to 2033 Figure 77: Brazil Market Share Analysis (%) by Distribution Channel, 2022 to 2033 Figure 78: Argentina Market Value Proportion Analysis, 2022 Figure 79: Global Vs Argentina Growth Comparison Figure 80: Argentina Market Share Analysis (%) by Product, 2022 to 2033 Figure 81: Argentina Market Share Analysis (%) by Dosage Form, 2022 to 2033 Figure 82: Argentina Market Share Analysis (%) by Route of Administration, 2022 to 2033 Figure 83: Argentina Market Share Analysis (%) by Age, 2022 to 2033 Figure 84: Argentina Market Share Analysis (%) by Distribution Channel, 2022 to 2033 Figure 85: Europe Market Value (US$ Million) Analysis, 2017 to 2022 Figure 86: Europe Market Value (US$ Million) Forecast, 2023 to 2033 Figure 87: Europe Market Value Share, by Product (2023 E) Figure 88: Europe Market Value Share, by Dosage Form (2023 E) Figure 89: Europe Market Value Share, by Route of Administration (2023 E) Figure 90: Europe Market Value Share, by Age (2023 E) Figure 91: Europe Market Value Share, by Distribution Channel (2023 E) Figure 92: Europe Market Value Share, by Country (2023 E) Figure 93: Europe Market Attractiveness Analysis by Product, 2023 to 2033 Figure 94: Europe Market Attractiveness Analysis by Dosage Form, 2023 to 2033 Figure 95: Europe Market Attractiveness Analysis by Route of Administration, 2023 to 2033 Figure 96: Europe Market Attractiveness Analysis by Age, 2023 to 2033 Figure 97: Europe Market Attractiveness Analysis by Distribution Channel, 2023 to 2033 Figure 98: Europe Market Attractiveness Analysis by Country, 2023 to 2033 Figure 99: UK Market Value Proportion Analysis, 2022 Figure 100: Global Vs. UK Growth Comparison Figure 101: UK Market Share Analysis (%) by Product, 2022 to 2033 Figure 102: UK Market Share Analysis (%) by Dosage Form, 2022 to 2033 Figure 103: UK Market Share Analysis (%) by Route of Administration, 2022 to 2033 Figure 104: UK Market Share Analysis (%) by Age, 2022 to 2033 Figure 105: UK Market Share Analysis (%) by Distribution Channel, 2022 to 2033 Figure 106: Germany Market Value Proportion Analysis, 2022 Figure 107: Global Vs. Germany Growth Comparison Figure 108: Germany Market Share Analysis (%) by Product, 2022 to 2033 Figure 109: Germany Market Share Analysis (%) by Dosage Form, 2022 to 2033 Figure 110: Germany Market Share Analysis (%) by Route of Administration, 2022 to 2033 Figure 111: Germany Market Share Analysis (%) by Age, 2022 to 2033 Figure 112: Germany Market Share Analysis (%) by Distribution Channel, 2022 to 2033 Figure 113: Italy Market Value Proportion Analysis, 2022 Figure 114: Global Vs. Italy Growth Comparison Figure 115: Italy Market Share Analysis (%) by Product, 2022 to 2033 Figure 116: Italy Market Share Analysis (%) by Dosage Form, 2022 to 2033 Figure 117: Italy Market Share Analysis (%) by Route of Administration, 2022 to 2033 Figure 118: Italy Market Share Analysis (%) by Age, 2022 to 2033 Figure 119: Italy Market Share Analysis (%) by Distribution Channel, 2022 to 2033 Figure 120: France Market Value Proportion Analysis, 2022 Figure 121: Global Vs France Growth Comparison Figure 122: France Market Share Analysis (%) by Product, 2022 to 2033 Figure 123: France Market Share Analysis (%) by Dosage Form, 2022 to 2033 Figure 124: France Market Share Analysis (%) by Route of Administration, 2022 to 2033 Figure 125: France Market Share Analysis (%) by Age, 2022 to 2033 Figure 126: France Market Share Analysis (%) by Distribution Channel, 2022 to 2033 Figure 127: Spain Market Value Proportion Analysis, 2022 Figure 128: Global Vs Spain Growth Comparison Figure 129: Spain Market Share Analysis (%) by Product, 2022 to 2033 Figure 130: Spain Market Share Analysis (%) by Dosage Form, 2022 to 2033 Figure 131: Spain Market Share Analysis (%) by Route of Administration, 2022 to 2033 Figure 132: Spain Market Share Analysis (%) by Age, 2022 to 2033 Figure 133: Spain Market Share Analysis (%) by Distribution Channel, 2022 to 2033 Figure 134: Russia Market Value Proportion Analysis, 2022 Figure 135: Global Vs Russia Growth Comparison Figure 136: Russia Market Share Analysis (%) by Product, 2022 to 2033 Figure 137: Russia Market Share Analysis (%) by Dosage Form, 2022 to 2033 Figure 138: Russia Market Share Analysis (%) by Route of Administration, 2022 to 2033 Figure 139: Russia Market Share Analysis (%) by Age, 2022 to 2033 Figure 140: Russia Market Share Analysis (%) by Distribution Channel, 2022 to 2033 Figure 141: BENELUX Market Value Proportion Analysis, 2022 Figure 142: Global Vs BENELUX Growth Comparison Figure 143: BENELUX Market Share Analysis (%) by Product, 2022 to 2033 Figure 144: BENELUX Market Share Analysis (%) by Dosage Form, 2022 to 2033 Figure 145: BENELUX Market Share Analysis (%) by Route of Administration, 2022 to 2033 Figure 146: BENELUX Market Share Analysis (%) by Age, 2022 to 2033 Figure 147: BENELUX Market Share Analysis (%) by Distribution Channel, 2022 to 2033 Figure 148: East Asia Market Value (US$ Million) Analysis, 2017 to 2022 Figure 149: East Asia Market Value (US$ Million) Forecast, 2023 to 2033 Figure 150: East Asia Market Value Share, by Product (2023 E) Figure 151: East Asia Market Value Share, by Dosage Form (2023 E) Figure 152: East Asia Market Value Share, by Route of Administration (2023 E) Figure 153: East Asia Market Value Share, by Age (2023 E) Figure 154: East Asia Market Value Share, by Distribution Channel (2023 E) Figure 155: East Asia Market Value Share, by Country (2023 E) Figure 156: East Asia Market Attractiveness Analysis by Product, 2023 to 2033 Figure 157: East Asia Market Attractiveness Analysis by Dosage Form, 2023 to 2033 Figure 158: East Asia Market Attractiveness Analysis by Route of Administration, 2023 to 2033 Figure 159: East Asia Market Attractiveness Analysis by Age, 2023 to 2033 Figure 160: East Asia Market Attractiveness Analysis by Distribution Channel, 2023 to 2033 Figure 161: East Asia Market Attractiveness Analysis by Country, 2023 to 2033 Figure 162: China Market Value Proportion Analysis, 2022 Figure 163: Global Vs. China Growth Comparison Figure 164: China Market Share Analysis (%) by Product, 2022 to 2033 Figure 165: China Market Share Analysis (%) by Dosage Form, 2022 to 2033 Figure 166: China Market Share Analysis (%) by Route of Administration, 2022 to 2033 Figure 167: China Market Share Analysis (%) by Age, 2022 to 2033 Figure 168: China Market Share Analysis (%) by Distribution Channel, 2022 to 2033 Figure 169: Japan Market Value Proportion Analysis, 2022 Figure 170: Global Vs. Japan Growth Comparison Figure 171: Japan Market Share Analysis (%) by Product, 2022 to 2033 Figure 172: Japan Market Share Analysis (%) by Dosage Form, 2022 to 2033 Figure 173: Japan Market Share Analysis (%) by Route of Administration, 2022 to 2033 Figure 174: Japan Market Share Analysis (%) by Age, 2022 to 2033 Figure 175: Japan Market Share Analysis (%) by Distribution Channel, 2022 to 2033 Figure 176: South Korea Market Value Proportion Analysis, 2022 Figure 177: Global Vs South Korea Growth Comparison Figure 178: South Korea Market Share Analysis (%) by Product, 2022 to 2033 Figure 179: South Korea Market Share Analysis (%) by Dosage Form, 2022 to 2033 Figure 180: South Korea Market Share Analysis (%) by Route of Administration, 2022 to 2033 Figure 181: South Korea Market Share Analysis (%) by Age, 2022 to 2033 Figure 182: South Korea Market Share Analysis (%) by Distribution Channel, 2022 to 2033 Figure 183: South Asia Market Value (US$ Million) Analysis, 2017 to 2022 Figure 184: South Asia Market Value (US$ Million) Forecast, 2023 to 2033 Figure 185: South Asia Market Value Share, by Product (2023 E) Figure 186: South Asia Market Value Share, by Dosage Form (2023 E) Figure 187: South Asia Market Value Share, by Route of Administration (2023 E) Figure 188: South Asia Market Value Share, by Age (2023 E) Figure 189: South Asia Market Value Share, by Distribution Channel (2023 E) Figure 190: South Asia Market Value Share, by Country (2023 E) Figure 191: South Asia Market Attractiveness Analysis by Product, 2023 to 2033 Figure 192: South Asia Market Attractiveness Analysis by Dosage Form, 2023 to 2033 Figure 193: South Asia Market Attractiveness Analysis by Route of Administration, 2023 to 2033 Figure 194: South Asia Market Attractiveness Analysis by Age, 2023 to 2033 Figure 195: South Asia Market Attractiveness Analysis by Distribution Channel, 2023 to 2033 Figure 196: South Asia Market Attractiveness Analysis by Country, 2023 to 2033 Figure 197: India Market Value Proportion Analysis, 2022 Figure 198: Global Vs. India Growth Comparison Figure 199: India Market Share Analysis (%) by Product, 2022 to 2033 Figure 200: India Market Share Analysis (%) by Dosage Form, 2022 to 2033 Figure 201: India Market Share Analysis (%) by Route of Administration, 2022 to 2033 Figure 202: India Market Share Analysis (%) by Age, 2022 to 2033 Figure 203: India Market Share Analysis (%) by Distribution Channel, 2022 to 2033 Figure 204: Indonesia Market Value Proportion Analysis, 2022 Figure 205: Global Vs. Indonesia Growth Comparison Figure 206: Indonesia Market Share Analysis (%) by Product, 2022 to 2033 Figure 207: Indonesia Market Share Analysis (%) by Dosage Form, 2022 to 2033 Figure 208: Indonesia Market Share Analysis (%) by Route of Administration, 2022 to 2033 Figure 209: Indonesia Market Share Analysis (%) by Age, 2022 to 2033 Figure 210: Indonesia Market Share Analysis (%) by Distribution Channel, 2022 to 2033 Figure 211: Malaysia Market Value Proportion Analysis, 2022 Figure 212: Global Vs. Malaysia Growth Comparison Figure 213: Malaysia Market Share Analysis (%) by Product, 2022 to 2033 Figure 214: Malaysia Market Share Analysis (%) by Dosage Form, 2022 to 2033 Figure 215: Malaysia Market Share Analysis (%) by Route of Administration, 2022 to 2033 Figure 216: Malaysia Market Share Analysis (%) by Age, 2022 to 2033 Figure 217: Malaysia Market Share Analysis (%) by Distribution Channel, 2022 to 2033 Figure 218: Thailand Market Value Proportion Analysis, 2022 Figure 219: Global Vs. Thailand Growth Comparison Figure 220: Thailand Market Share Analysis (%) by Product, 2022 to 2033 Figure 221: Thailand Market Share Analysis (%) by Dosage Form, 2022 to 2033 Figure 222: Thailand Market Share Analysis (%) by Route of Administration, 2022 to 2033 Figure 223: Thailand Market Share Analysis (%) by Age, 2022 to 2033 Figure 224: Thailand Market Share Analysis (%) by Distribution Channel, 2022 to 2033 Figure 225: Oceania Market Value (US$ Million) Analysis, 2017 to 2022 Figure 226: Oceania Market Value (US$ Million) Forecast, 2023 to 2033 Figure 227: Oceania Market Value Share, by Product (2023 E) Figure 228: Oceania Market Value Share, by Dosage Form (2023 E) Figure 229: Oceania Market Value Share, by Route of Administration (2023 E) Figure 230: Oceania Market Value Share, by Age (2023 E) Figure 231: Oceania Market Value Share, by Distribution Channel (2023 E) Figure 232: Oceania Market Value Share, by Country (2023 E) Figure 233: Oceania Market Attractiveness Analysis by Product, 2023 to 2033 Figure 234: Oceania Market Attractiveness Analysis by Dosage Form, 2023 to 2033 Figure 235: Oceania Market Attractiveness Analysis by Route of Administration, 2023 to 2033 Figure 236: Oceania Market Attractiveness Analysis by Age, 2023 to 2033 Figure 237: Oceania Market Attractiveness Analysis by Distribution Channel, 2023 to 2033 Figure 238: Oceania Market Attractiveness Analysis by Country, 2023 to 2033 Figure 239: Australia Market Value Proportion Analysis, 2022 Figure 240: Global Vs. Australia Growth Comparison Figure 241: Australia Market Share Analysis (%) by Product, 2022 to 2033 Figure 242: Australia Market Share Analysis (%) by Dosage Form, 2022 to 2033 Figure 243: Australia Market Share Analysis (%) by Route of Administration, 2022 to 2033 Figure 244: Australia Market Share Analysis (%) by Age, 2022 to 2033 Figure 245: Australia Market Share Analysis (%) by Distribution Channel, 2022 to 2033 Figure 246: New Zealand Market Value Proportion Analysis, 2022 Figure 247: Global Vs New Zealand Growth Comparison Figure 248: New Zealand Market Share Analysis (%) by Product, 2022 to 2033 Figure 249: New Zealand Market Share Analysis (%) by Dosage Form, 2022 to 2033 Figure 250: New Zealand Market Share Analysis (%) by Route of Administration, 2022 to 2033 Figure 251: New Zealand Market Share Analysis (%) by Age, 2022 to 2033 Figure 252: New Zealand Market Share Analysis (%) by Distribution Channel, 2022 to 2033 Figure 253: Middle East & Africa Market Value (US$ Million) Analysis, 2017 to 2022 Figure 254: Middle East & Africa Market Value (US$ Million) Forecast, 2023 to 2033 Figure 255: Middle East & Africa Market Value Share, by Product (2023 E) Figure 256: Middle East & Africa Market Value Share, by Dosage Form (2023 E) Figure 257: Middle East & Africa Market Value Share, by Route of Administration (2023 E) Figure 258: Middle East & Africa Market Value Share, by Age (2023 E) Figure 259: Middle East & Africa Market Value Share, by Distribution Channel (2023 E) Figure 260: Middle East & Africa Market Value Share, by Country (2023 E) Figure 261: Middle East & Africa Market Attractiveness Analysis by Product, 2023 to 2033 Figure 262: Middle East & Africa Market Attractiveness Analysis by Dosage Form, 2023 to 2033 Figure 263: Middle East & Africa Market Attractiveness Analysis by Route of Administration, 2023 to 2033 Figure 264: Middle East & Africa Market Attractiveness Analysis by Age, 2023 to 2033 Figure 265: Middle East & Africa Market Attractiveness Analysis by Distribution Channel, 2023 to 2033 Figure 266: Middle East & Africa Market Attractiveness Analysis by Country, 2023 to 2033 Figure 267: GCC Countries Market Value Proportion Analysis, 2022 Figure 268: Global Vs GCC Countries Growth Comparison Figure 269: GCC Countries Market Share Analysis (%) by Product, 2022 to 2033 Figure 270: GCC Countries Market Share Analysis (%) by Dosage Form, 2022 to 2033 Figure 271: GCC Countries Market Share Analysis (%) by Route of Administration, 2022 to 2033 Figure 272: GCC Countries Market Share Analysis (%) by Age, 2022 to 2033 Figure 273: GCC Countries Market Share Analysis (%) by Distribution Channel, 2022 to 2033 Figure 274: Türkiye Market Value Proportion Analysis, 2022 Figure 275: Global Vs. Türkiye Growth Comparison Figure 276: Türkiye Market Share Analysis (%) by Product, 2022 to 2033 Figure 277: Türkiye Market Share Analysis (%) by Dosage Form, 2022 to 2033 Figure 278: Türkiye Market Share Analysis (%) by Route of Administration, 2022 to 2033 Figure 279: Türkiye Market Share Analysis (%) by Age, 2022 to 2033 Figure 280: Türkiye Market Share Analysis (%) by Distribution Channel, 2022 to 2033 Figure 281: South Africa Market Value Proportion Analysis, 2022 Figure 282: Global Vs. South Africa Growth Comparison Figure 283: South Africa Market Share Analysis (%) by Product, 2022 to 2033 Figure 284: South Africa Market Share Analysis (%) by Dosage Form, 2022 to 2033 Figure 285: South Africa Market Share Analysis (%) by Route of Administration, 2022 to 2033 Figure 286: South Africa Market Share Analysis (%) by Age, 2022 to 2033 Figure 287: South Africa Market Share Analysis (%) by Distribution Channel, 2022 to 2033 Figure 288: North Africa Market Value Proportion Analysis, 2022 Figure 289: Global Vs North Africa Growth Comparison Figure 290: North Africa Market Share Analysis (%) by Product, 2022 to 2033 Figure 291: North Africa Market Share Analysis (%) by Dosage Form, 2022 to 2033 Figure 292: North Africa Market Share Analysis (%) by Route of Administration, 2022 to 2033 Figure 293: North Africa Market Share Analysis (%) by Age, 2022 to 2033 Figure 294: North Africa Market Share Analysis (%) by Distribution Channel, 2022 to 2033
Recommendations
Explore Healthcare Insights
View Reports