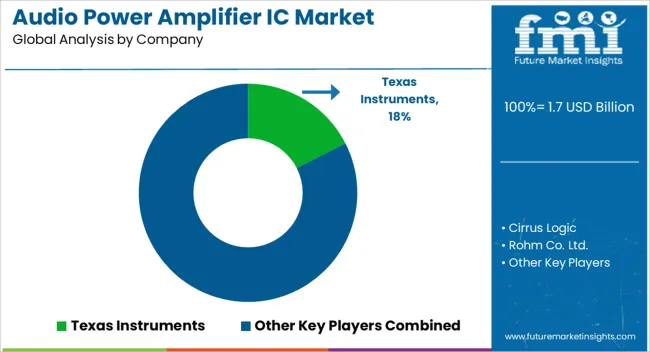
The Audio Power Amplifier IC Market is estimated to be valued at USD 1.7 billion in 2025 and is projected to reach USD 3.2 billion by 2035, registering a compound annual growth rate (CAGR) of 6.7% over the forecast period.
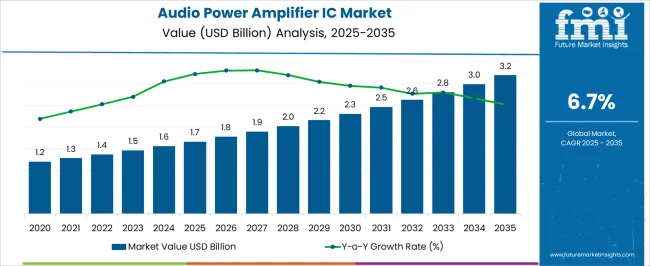
| Metric | Value |
|---|---|
| Audio Power Amplifier IC Market Estimated Value in (2025 E) | USD 1.7 billion |
| Audio Power Amplifier IC Market Forecast Value in (2035 F) | USD 3.2 billion |
| Forecast CAGR (2025 to 2035) | 6.7% |
The Audio Power Amplifier IC market is experiencing robust growth, driven by increasing consumer demand for high-quality audio experiences in both residential and commercial settings. Rising adoption of home audio systems, smart speakers, and personal entertainment devices has significantly contributed to the market expansion. Technological advancements in amplifier design, including improved power efficiency, low distortion, and high-fidelity sound reproduction, are enhancing user experience while reducing energy consumption.
The integration of these ICs in portable and connected devices is further driving adoption, as consumers increasingly seek compact, high-performance audio solutions. Continuous innovations in semiconductor fabrication processes and miniaturization techniques are enabling manufacturers to produce more reliable and efficient audio ICs.
Regulatory emphasis on energy efficiency and low heat generation is also encouraging the use of advanced amplifier designs As consumer preference shifts toward immersive sound quality and intelligent audio devices, the market is expected to sustain long-term growth, supported by the proliferation of connected entertainment systems and smart home technologies globally.
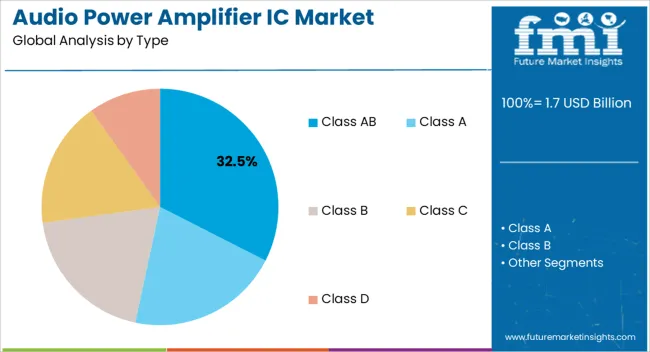
The Class AB segment is projected to hold 32.5% of the market revenue in 2025, establishing it as the leading type. Its growth is being driven by the balance it provides between high efficiency and low distortion, making it ideal for both home and professional audio applications. Class AB amplifiers combine the benefits of Class A and Class B designs, offering superior linearity and power handling while maintaining reasonable energy consumption.
The ability to deliver high-quality sound across a wide frequency range has reinforced adoption in consumer electronics, including home audio systems, soundbars, and portable speakers. Manufacturing improvements, such as enhanced thermal management and integration with other IC components, have further increased reliability and performance.
The segment’s cost-effectiveness, coupled with its compatibility with a wide range of audio devices, continues to drive preference among manufacturers and end users As demand for high-fidelity audio solutions grows, Class AB amplifiers are expected to maintain their leading position, supported by innovation and expanding consumer electronics adoption.
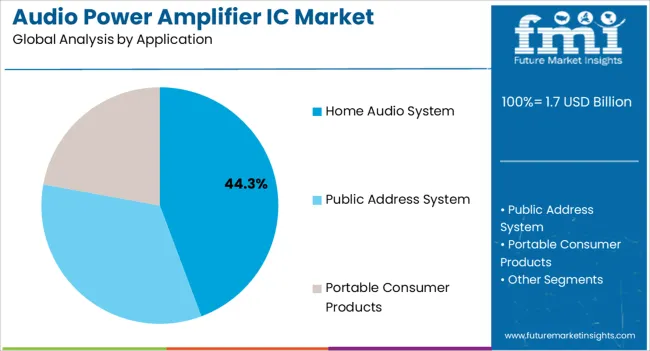
The home audio system application segment is anticipated to account for 44.3% of the market revenue in 2025, making it the largest application category. Its growth is driven by increasing consumer preference for high-quality sound reproduction and immersive audio experiences in residential environments. Audio power amplifier ICs enable efficient amplification of sound signals while minimizing distortion and power loss, which is critical for home audio setups including soundbars, stereo systems, and smart speakers.
Rising adoption of connected devices and integration of streaming services have further accelerated demand, as consumers seek enhanced convenience and performance. Manufacturers are incorporating advanced IC designs that support multi-channel audio, wireless connectivity, and intelligent audio processing, enhancing system functionality and user experience.
The segment is also being supported by increased investments in smart home technologies and the growing popularity of high-end entertainment systems As homeowners continue to prioritize sound quality and integrated entertainment solutions, the home audio system application is expected to remain the primary driver of market growth, reinforced by continuous technological advancements in audio amplification.
There has been the development of new energy-efficient audio devices, as well as the growing usage of consumer electronics. Hence, to enhance user experience, consumers are likely to increase the adoption of audio power amplifier IC, for both commercial and domestic use.
There is increasing demand for Hi-Fi audio for use in commercial events is a key driver for the market. Moreover, the rise in the deployment of wireless and smart infrastructure is further expected to drive the growth of the market share.
There has been an increase in the integration of audio ICs in various industrial applications, due to the rising advancements in connected devices and IoT technology. This is because the demand for integrated power for application-based processors and subsystems has increased, owing to miniaturization.
There have been several developments like miniaturization and convergence of everyday-use electronic gadgets owing to strict government rules and regulations related to the environment and energy efficiency. This is expected to be a crucial aspect of the audio power amplifier IC market share.
The audio-integrated circuits (IC) can handle a limited amount of power. Moreover, the low-temperature coefficient is difficult to achieve. These factors are likely to serve as key restraints for the adoption of an audio power amplifier IC.
Rising demand for onboard media entertainment systems has considerably aided in the growth of the market. Furthermore, the advancement in helmet devices, as well as virtual reality headsets is growing the demand for audio IC in the market.
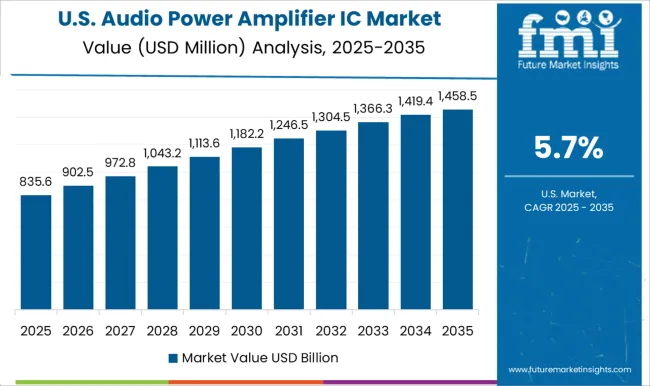
| Attributes | Details |
|---|---|
| North America’s Market Share % (2025) | 30.3% |
| The United State’s Market Share % (2025) | 17.9% |
North America is the leading audio power amplifier IC industry, owing to the existence of small and key IC makers, along with a notable revenue of 30.3%. Likewise, stringent government environmental laws are likely to contribute to market growth.
The high disposable income of the working population, along with technological developments in this region are providing options for both consumers and manufacturers. Furthermore, energy-efficient technology to assist in the downsizing of electronic devices is a key emerging market trend in this region.
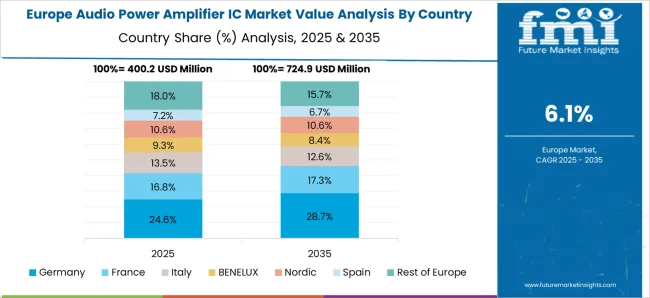
| Attribute | Details |
|---|---|
| Europe’s Market Share % (2025) | 23.2% |
| Germany’s Market Share % (2025) | 9.4% |
| The United Kingdom’s CAGR % (2025 to 2035) | 10.3% |
With a revenue of 23.2%, Europe holds the second-largest share of the audio power amplifier IC market. This is attributed to the several industries implementing goods in the healthcare and automobile industries.
Consumer electronics usage increasing in this region, due to the proliferation of the Internet of Things (IoT). It is forecasted to push the sales of audio polar amplifier IC in the future period. Moreover, the success of a wide range of building automation and household applications is supposed to be the key market trend of this region.
Several market players are focusing on the advancement of energy-efficient, compact, and cost-effective devices for domestic and commercial usage. Also, audio power amplifier ICs have facilitated the designing of Mp3 docking stations, and space-constrained applications such as flat-screen TV, which in turn permits high-quality and room-filling sound.
The increasing demand for speakers, smartphones, television, home entertainment, and other consumer electronics is providing start-up companies the leverage to create new and innovative strategies.
Manufacturers primarily focus on improved product launches by taking inspiration from market restraints and using them as areas of development. Also, several mergers and acquisitions among the key market players further provide significant opportunities.
Key Market Players Profiled in the Audio Power Amplifier IC Market
Recent Developments in the Audio Power Amplifier IC Market
| Report Attributes | Details |
|---|---|
| Growth Rate | CAGR of 6.7% from 2025 to 2035 |
| The base year for estimation | 2025 |
| Historical data | 2020 to 2025 |
| Forecast period | 2025 to 2035 |
| Quantitative units | Revenue in USD million and CAGR from 2025 to 2035 |
| Report Coverage | Revenue forecast, volume forecast, company ranking, competitive landscape, growth factors, and trends, Pricing Analysis, |
| Segments Covered | Type, Application, and Region |
| Regional scope | North America; Western Europe; Eastern Europe; the Middle East; and Africa; ASIAN; South Asia; Rest of Asia; Australia; and New Zealand |
| Country scope | The United States, Canada, Mexico, Germany, the United Kingdom, France, Italy, Spain, Russia, Belgium, Poland, Czech Republic, China, India, Japan, Australia, Brazil, Argentina, Colombia, Saudi Arabia, United Arab Emirates, Iran, South Africa |
| Key companies profiled | STMicroelectronics; Analog Devices Inc; ON Semiconductor Corp.; NXP Semiconductors N.V.; Maxim Integrated; Jameco; Texas Instruments; Future Electronics; EDGEFX.in Kits & Solutions; AspenCore Inc.; Rohm Co. Ltd.; Monolithic Power Systems Inc.; Intersil Corporation; Infineon Technologies AG; Toshiba Corporation; Cirrus Logic. |
| Customization scope | Free report customization (equivalent to up to 8 analysts' working days) with purchase. Addition or alteration to country, regional & segment scope. |
| Pricing and purchase options | Avail customized purchase options to meet your exact research needs. |
The global audio power amplifier IC market is estimated to be valued at USD 1.7 billion in 2025.
The market size for the audio power amplifier IC market is projected to reach USD 3.2 billion by 2035.
The audio power amplifier IC market is expected to grow at a 6.7% CAGR between 2025 and 2035.
The key product types in audio power amplifier IC market are class ab, class a, class b, class c and class d.
In terms of application, home audio system segment to command 44.3% share in the audio power amplifier IC market in 2025.


Full Research Suite comprises of:
Market outlook & trends analysis
Interviews & case studies
Strategic recommendations
Vendor profiles & capabilities analysis
5-year forecasts
8 regions and 60+ country-level data splits
Market segment data splits
12 months of continuous data updates
DELIVERED AS:
PDF EXCEL ONLINE
Audio Processor Market Size and Share Forecast Outlook 2025 to 2035
Audio Kits Market
Audio Transistors Market
Audio Codec Market
Audio Communication Monitoring Market Size and Share Forecast Outlook 2025 to 2035
Audiology Services Market Size and Share Forecast Outlook 2025 to 2035
Audio Conferencing Services Market Outlook 2025 to 2035
Audio Power Amplifier Market
3D Audio Market Size and Share Forecast Outlook 2025 to 2035
Car Audio Market Size and Share Forecast Outlook 2025 to 2035
Home Audio Equipment Market Analysis & Forecast 2025 to 2035
Class D Audio Amplifiers Market is Segmented by Type, End Use and Region through 2025 to 2035
Wireless Audio Products Market Growth & Demand 2025 to 2035
Wireless Audio Devices Market Size and Share Forecast Outlook 2025 to 2035
Europe Home High End Audio System Market – Trends & Forecast 2025 to 2035
Power Plant Boiler Market Forecast Outlook 2025 to 2035
Power Ring Rolling Machine Market Size and Share Forecast Outlook 2025 to 2035
Power Supply Equipment for Data Center Market Size and Share Forecast Outlook 2025 to 2035
Power Quality Equipment Market Size and Share Forecast Outlook 2025 to 2035
Power Generator for Military Market Size and Share Forecast Outlook 2025 to 2035

Thank you!
You will receive an email from our Business Development Manager. Please be sure to check your SPAM/JUNK folder too.
Chat With
MaRIA