

- Market Size (2026)
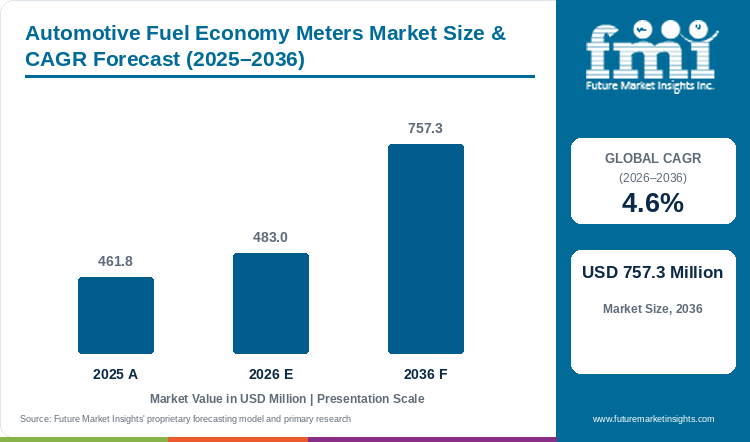
- USD 483.0 Mn
- Forecast (2036)
- USD 757.3 Mn
- CAGR (2026 to 2036)
- 4.6%
How big is Automotive Fuel Economy Meters Market in 2026?
Automotive fuel economy meters revenue stood at USD 461.8 million in 2025, rises to USD 483.0 million in 2026 and reaches USD 757.3 million by 2036. This path reflects a 4.6% CAGR from 2026 to 2036 and adds USD 274.3 million of revenue for meter suppliers over the forecast period. FMI finds that factory clusters and fleet platforms will carry most of this added value.
Key drivers of the automotive fuel economy meters market include factory cluster upgrades, fleet telematics growth and higher fuel prices. In February 2026, Visteon reported USD 1.4 billion of new cluster business within record 2025 bookings of USD 7.4 billion [1]. Due to this, sales of fuel economy displays inside factory dashboards are expected to stay firm across new vehicle programs. Apart from that, Geotab passed 5 million connected subscriptions in September 2025 [2] and in January 2026 added near real-time idling feedback to the Vitality driver app [3]. Adoption of fuel economy meters across factory screens and passenger vehicle telematics platforms is anticipated to rise through 2036 as fleets watch fuel use.
Key Market Trends & Insights
- By meter type, dashboard economy meters hold 28% of sales in 2026, as the readout arrives with the car and needs no separate purchase.
- By vehicle type, passenger cars account for 37% of demand in 2026, owing to private drivers comparing fuel use when choosing a car. U.S. new vehicles reached a record real-world average of 27.2 mpg for model year 2024, according to EPA [4].
- By data source, OBD/CAN-based systems take 38% of revenue in 2026, as plug-in units read fuel data from the diagnostic port without an added sensor.
- By sales channel, OEM instrument clusters lead with 41% of revenue in 2026, supported by fuel economy rules on every new vehicle program. NHTSA's December 2025 proposal sets a fleetwide average of about 34.5 mpg by model year 2031 [5].
- By application, eco-driving feedback is the largest use at 39% in 2026, and sales of this feature are expected to rise as more fleets tie driver scores to rewards.
Regional Highlights
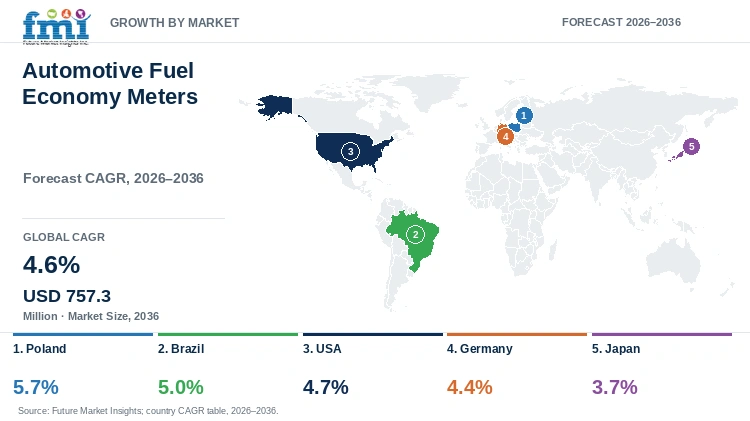
- Fastest-growing profiled country: Poland, at a 5.7% CAGR from 2026 to 2036, on steady sales of plug-in meters for older cars.
- By country: Brazil at 5% and the USA at 4.7% follow, and Japan records the lowest profiled rate at a 3.7% CAGR through 2036.
- Sales of plug-in meters in Poland hold firm as Polish cars averaged 15.2 years in 2024 against an EU average of 12.7 years, ACEA reported in January 2026 [6].
Market Size & Forecast
Table 1: Market Size and Forecast for the Automotive Fuel Economy Meters Market (USD million and percentage), 2025 to 2036
| Metric | Value |
|---|---|
| 2025 Market Size | USD 461.8 million |
| Estimated Market Size in 2026 | USD 483.0 million |
| Projected Market Size by 2036 | USD 757.3 million |
| CAGR, 2026 to 2036 | 4.6% |
| Added Revenue, 2026 to 2036 | USD 274.3 million |
| Market Expansion Multiple | 1.6x |
Fleet operators and new-car buyers account for most sales of fuel economy meters today, and plug-in units serve owners of older cars. The U.S. Energy Information Administration expects diesel to average USD 5.19 per gallon in 2026 [7]. At that price, every gallon a driver saves is worth more to the fleet. In May 2026, Samsara added a Driver Efficiency Program that scores drivers against load, terrain and traffic and tracks recovered fuel cost [8]. Fleet buyers now expect fleet management tools to carry fuel scores of this kind. However, vehicle data differs by make and model, adding calibration work to every new meter. In FMI's view, orders through 2036 will go mainly to meters whose fuel savings a fleet can check against fuel receipts.
Fuel Cost, Fleet Budget and Fitment Readiness
Fleets feel every rise at the pump, and that keeps orders for fuel economy meters firm. The U.S. Energy Information Administration expects retail gasoline to average USD 3.91 per gallon in 2026, against USD 3.10 in 2025 [7]. Fleet managers are responding by tying each driver's fuel use to rankings, rewards and fuel budgets. Meters linked to driver coaching stand to gain the most from this shift. Real-use readouts matter for a second reason, as cars burn more fuel on the road than the label suggests. Petrol cars registered in 2022 emitted 21.1% more CO2 on the road than in type approval, a gap of 29 g CO2/km, according to the European Commission [9]. Diesel cars showed a 17.1% gap in the same data, and plug-in hybrids a far wider one [9]. FMI finds that drivers and regulators will keep comparing road use with rated values through 2036. That habit supports sales of digital fuel consumption meters reporting real use.
Fuel economy meters grow at a steady pace, as the meter is a small line inside much larger cluster and telematics budgets. According to FMI, the OEM instrument cluster route is worth about USD 198.0 million in 2026, or 41% of the market. Visteon booked USD 1.4 billion of new cluster business in 2025 alone [1]. Samsara reported fiscal 2026 revenue of USD 1,618.6 million [10], and Garmin's Auto OEM segment earned USD 664.7 million in 2025 [11]. Fuel economy readouts make up a small slice of budgets this size. Energy-aware displays are gaining ground in Europe, as hybrid-electric cars took 34.5% of EU new car registrations in 2025, ACEA reported [12]. Battery-electric cars took 17.4% and plug-in hybrids 9.4% of the same registrations [12]. In Brazil, the 2026 PBE vehicle table covers 43 brands and 959 models and versions across flex, hybrid, electric and diesel types [13]. Displays sold there need to switch units by powertrain. Poland grows fastest on an ageing car fleet, with an average age of 15.2 years in 2024 against 12.7 years across the EU [6]. The USA should track close to the global rate as fleets respond to high diesel prices. Japan ranks last at a 3.7% CAGR through 2036, since most of the 4,565,777 new vehicles sold there in 2025 [14] came with factory fuel economy displays. Suppliers serving both carmakers and fleets are expected to gain the most contracts over the decade.
Table 2: Fuel Cost, Fleet Budget and Fitment Readiness Indicators for the Automotive Fuel Economy Meters Market (USD per gallon, percentage, mpg, years, counts and USD billion), mixed reporting years from 2024 to 2026
| Indicator | Data Point | Why This Matters | Source |
|---|---|---|---|
| U.S. fuel price forecast | Gasoline USD 3.91 per gallon in 2026 against USD 3.10 in 2025; diesel USD 5.19 in 2026 | Fleets recover the cost of fuel economy meters faster as fuel prices rise. | [7] |
| Real-world fuel gap in the EU | Petrol cars 21.1%, diesel cars 17.1% and plug-in hybrids 314% above type-approval CO2 for 2022 registrations | Demand for meters reporting real fuel use stays firm among drivers and fleets. | [9] |
| U.S. new-vehicle fuel economy | Record real-world average of 27.2 mpg for model year 2024 | Car buyers keep weighing fuel economy when choosing a new car. | [4] |
| Proposed U.S. CAFE level | About 34.5 mpg fleetwide by model year 2031 under NHTSA's December 2025 proposal | Carmakers keep economy readouts on every new U.S. model through 2031. | [5] |
| Car fleet age in Poland | Average of 15.2 years in 2024 against an EU average of 12.7 years | Owners of older cars buy plug-in OBD2 meters for fuel data. | [6] |
| EU powertrain mix | Hybrid-electric 34.5%, battery-electric 17.4% and plug-in hybrid 9.4% of 2025 new cars | Carmakers are ordering displays reporting both fuel and battery use. | [12] |
| Efficiency label in Brazil | PBE table for 2026 covers 43 brands and 959 models and versions | Drivers compare rated and real fuel use more often across powertrains. | [13] |
| Fleet telematics scale | Geotab above 5 million connected subscriptions; Samsara annual recurring revenue of USD 1.890 billion | Fleet platforms form a large sales route for fuel economy meters. | [2] [10] |
| Visteon cluster awards | USD 1.4 billion within USD 7.4 billion of 2025 bookings | Factory clusters remain the largest sales route for fuel economy displays. | [1] |
Table 3: Fuel Cost and Fleet Budget Benchmarks for the Automotive Fuel Economy Meters Market (USD million unless stated), 2024-2026, mixed years
| Measure | Value | Source |
|---|---|---|
| Global fuel economy meters market, 2026 | 483.0 | Future Market Insights |
| OEM instrument cluster channel value, 2026 (41% share) | About 198.0 | Future Market Insights |
| Visteon cluster new business awards, 2025 | 1,400 | [1] |
| Visteon total new business bookings, 2025 | 7,400 | [1] |
| Samsara revenue, fiscal 2026 | 1,618.6 | [10] |
| Samsara annual recurring revenue, end of fiscal 2026 | 1,890 | [10] |
| Garmin Auto OEM segment revenue, 2025 | 664.7 | [11] |
| U.S. retail gasoline, 2025 vs 2026 (USD per gallon) | 3.10 vs 3.91 | [7] |
| U.S. on-highway diesel, 2026 (USD per gallon) | 5.19 | [7] |
| Hybrid-electric share of EU new car registrations, 2025 (%) | 34.5 | [12] |
| Petrol car road CO2 above type approval, 2022 registrations (g/km) | 29 | [9] |
Analyst Perspective
“Fuel economy meters will sell best among drivers and fleet managers who can see the money saved on each trip. Suppliers delivering accurate readings across factory clusters, plug-in units and fleet apps will gain the bulk of new programs through 2036.”
- Nikhil Kaitwade, Principal Consultant, Future Market Insights.
How is the automotive fuel economy meters market segmented?
The automotive fuel economy meters market is segmented by meter type, vehicle type, data source, sales channel, application, and region, giving five commercial axes plus regional coverage. In 2026, dashboard economy meters are projected at 28%, passenger cars at 37%, OBD/CAN-based systems at 38%, OEM instrument clusters at 41%, and eco-driving feedback at 39%.
By meter type: dashboard economy meters, aftermarket fuel economy gauges, OBD-based meters, fleet economy displays, and smart eco-driving meters.
By vehicle type: passenger cars, commercial vehicles, fleet vehicles, hybrid vehicles, and off-highway vehicles.
By data source: OBD/CAN-based, fuel flow sensor-based, GPS-telematics assisted, and ECU-estimated.
By sales channel: OEM instrument clusters, aftermarket retail, fleet telematics providers, and E-commerce/catalog.
By application: eco-driving feedback, fleet cost control, driver coaching, and fuel compliance tracking.
By region: North America, Latin America, Western Europe, Eastern Europe, East Asia, South Asia and Pacific, and Middle East and Africa.
Why do dashboard economy meters lead the meter type category?
Dashboard economy meters are projected to hold 28% of sales by meter type in 2026, as the display is fitted at the factory on new vehicle programs.
Table 4: Meter Type Share for the Automotive Fuel Economy Meters Market (percentage share), 2026
| Meter Type | Share (2026) |
|---|---|
| Dashboard Economy Meters | 28% |
| Other Segments Combined | 72% |
| Total | 100% |
Table 5: Meter Type Leadership and Market Growth for the Automotive Fuel Economy Meters Market (segment and CAGR percentage), 2026 to 2036
| Metric | Value |
|---|---|
| Global CAGR (2026 to 2036) | 4.6% |
| Leading Segment | Dashboard Economy Meters |
Dashboard economy meters lead the meter type category with 28% of sales in 2026, as the fuel economy readout is built into the factory cluster. Factory programs such as digital instrument clusters in Japan keep this route ahead of add-on gauges. In February 2026, Visteon reported cluster launches on the Toyota Corolla, Tata Sierra and Ford F-150 [1]. Aftermarket gauges, OBD-based meters, fleet displays and smart eco-driving meters share the remaining sales among retrofit buyers and managed fleets. As per FMI, software updates to digital clusters will add trip scores and eco tips, keeping this lead through 2036.
- Dashboard economy meters account for 28% of sales by meter type in 2026, as buyers of an equipped model get the display with the car.
- Carmakers can add eco scores to digital clusters through software updates, with no new hardware needed in the vehicle.
What keeps passenger cars ahead in the vehicle type category?
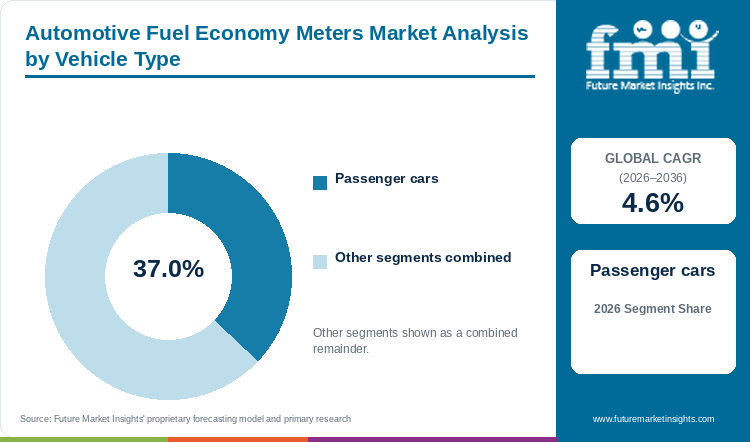
Passenger cars lead sales by vehicle type in 2026 at 37%, owing to daily fuel checks by private drivers.
Passenger cars lead vehicle type with 37% of demand in 2026, owing to private drivers who watch fuel use on every trip. Hybrid cars are adding new display needs, and ACEA reported in January 2026 that hybrid-electric cars took 34.5% of EU new car registrations in 2025 [12]. Commercial and fleet vehicles buy through fewer, larger contracts, and off-highway machines often need rugged fuel flow meters. Car lines with hybrid powertrains are expected to carry energy-aware readouts as standard through 2036.
- Private drivers checking fuel use on each trip give passenger cars 37% of demand by vehicle type in 2026.
- Hybrid car lines need displays showing both fuel use and battery flow on one screen, adding value per vehicle.
Why are OBD/CAN-based systems central to data source demand?
OBD/CAN-based systems are set to command 38% of revenue by data source in 2026, as plug-in units fit the standard diagnostic port.
OBD/CAN-based systems account for 38% of demand by data source in 2026, as the unit reads fuel data straight from the diagnostic port. Adoption is widest among fleets and owners of older cars, owing to fitting in minutes without a separate sensor. Fuel flow sensors cost more to fit and sell mainly for heavy and off-highway equipment. Sales of OBD2 fuel economy meters gain from fleet telematics, and Geotab passed 5 million connected subscriptions in September 2025 [2]. Plug-in units can move to replacement vehicles at fleet renewal, supporting repeat orders through 2036.
- OBD/CAN-based systems take 38% of demand by data source in 2026. Plug-in units fit in minutes through the diagnostic port and move to a new vehicle at fleet renewal.
- Buyers should check the vehicle compatibility list of each supplier, as fuel data differs by make and model.
Which factors keep OEM instrument clusters first among sales channels?
In 2026, OEM instrument clusters are expected to capture 41% of revenue by sales channel, driven by fuel economy rules on new models.
OEM instrument clusters take 41% of channel revenue in 2026, as fuel economy and CO2 rules in the USA, Europe and Japan keep efficiency readouts on new models. NHTSA's December 2025 proposal sets a fleetwide average of about 34.5 mpg by model year 2031 [5]. Aftermarket retail, e-commerce and fleet telematics providers serve older cars and managed fleets, and each holds a smaller share. Links to automotive OEM telematics services are expected to add trip reports and eco scores to each factory cluster through 2036.
- OEM instrument clusters hold 41% of sales by channel in 2026, and FMI expects stricter fuel economy rules to keep this lead through 2036.
- Carmakers choose cluster suppliers years before production, so new entrants need to wait for the next model change.
Why does eco-driving feedback attract the most application demand?
Eco-driving feedback is projected to take 39% of sales by application in 2026, owing to live prompts that drivers can act on at once.
Eco-driving feedback leads application at a 39% share in 2026, as an eco driving indicator flagging speed, braking and idling draws a quick response from drivers. In January 2026, Geotab added near real-time idling and fuel efficiency feedback to Geotab Vitality, letting drivers earn rewards [3]. Fleet cost control, driver coaching and fuel compliance tracking sell mainly to larger fleets with manager-level budgets. Sales of eco-driving feedback tools are set to rise further as more fleets link driver scores to rewards.
- Eco-driving feedback holds 39% of demand by application in 2026. Geotab added near real-time idling feedback linked to rewards to the Vitality app in January 2026 [3].
- Buyers should ask whether the feedback works across mixed fleets, as prompts lose value once some vehicles report no fuel data.
What are the drivers, restraints, and opportunities in the automotive fuel economy meters market?
Fuel prices and efficiency rules are supporting sales of automotive fuel economy meters. Uneven vehicle data slows launches, and connected fleet coaching offers suppliers the largest new source of orders.
- Driver: Demand for fuel economy meters is driven by higher diesel prices and fleet efficiency targets, as fleets track fuel cost per driver.
- Restraint: Vehicle data differs by make and model, adding calibration work for every fuel economy meter supplier. Long OEM test cycles also delay each new meter launch.
- Opportunity: Connected fleet platforms now charge for driver coaching, so key opportunities include selling accurate fuel readings into these platforms through 2036.
Higher Diesel Prices Lift Fleet Orders
Fleet owners are buying fuel economy meters to cut fuel, one of the largest running costs in fleet budgets. Pump prices in the EIA's October 2026 outlook stay high for both gasoline and diesel [7]. Due to this, fleets are paying closer attention to fuel cost per driver and per route. Sales of fleet fuel monitoring systems are expected to stay firm through 2036 as managers keep that cost in view.
Uneven Vehicle Data Slows Launches
Fuel economy meters need to read vehicle data that varies by make, model and powertrain. Plug-in hybrids are a hard case, as fuel use swings with charging habits, and road CO2 for 2022 registrations ran 314% above type approval [9]. Suppliers across automotive electronics face the same gaps in vehicle data. Calibration work and long OEM test cycles raise the cost of each new meter. Owing to this, new launches for hybrid and flex-fuel models may slow during the forecast period.
Fleet Coaching Platforms Open New Revenue
Fleet platforms are selling fuel data as a paid service to fleet managers. In March 2026, Samsara reported fiscal 2026 revenue of USD 1,618.6 million, up 30% [10]. Annual recurring revenue at Samsara closed the fiscal year at USD 1.890 billion [10]. Meter suppliers whose readings feed driver scores and coaching can sell into these platforms. Demand for fleet fuel management software with accurate fuel inputs will create new orders for meter suppliers over the forecast period.
Which country CAGRs are profiled in the automotive fuel economy meters market?
Poland posts the quickest growth for automotive fuel economy meters among profiled countries, at a 5.7% CAGR from 2026 to 2036. Japan records the slowest pace at 3.7% over the same period. Across Poland, Brazil, the USA, Germany and Japan, sales follow the age of cars on the road, fuel prices and the share of new models with factory displays.
Table 6: Country CAGRs and Primary Growth Levers for the Automotive Fuel Economy Meters Market (CAGR percentage), 2026 to 2036
| Country | CAGR (2026-2036) | Primary Growth Lever |
|---|---|---|
| Poland | 5.7% | Plug-in meters for an older imported car fleet |
| Brazil | 5% | Multi-fuel displays for flex-fuel and hybrid models |
| USA | 4.7% | Driver scoring for fleets facing high diesel prices |
| Germany | 4.4% | Fuel cost readouts under a rising CO2 charge |
| Japan | 3.7% | Software upgrades to hybrid factory clusters |
Source: Future Market Insights
Poland Automotive Fuel Economy Meters Market Outlook (2026-2036)
Passenger cars in Poland averaged 15.2 years in 2024 against an EU average of 12.7 years, according to ACEA [6]. Older cars are less likely to carry a factory fuel economy display, due to which owners buy plug-in OBD2 units and MPG meters instead. FMI forecasts sales in Poland to rise at a 5.7% CAGR from 2026 to 2036, the top rate on the country table. Used imports are slowing, as Instytut Samar counted 855.6 thousand imported used vehicles in 2025, down 2.8% [15]. Dealers also report buyers asking for younger four- and five-year-old cars [15], so meter brands will need compatibility lists that keep pace with newer models.
Key takeaway: Compatibility lists for popular imported models will shape which plug-in meter brands gain Polish orders.
Brazil Automotive Fuel Economy Meters Market Outlook (2026-2036)
Brazil ranks second in this group, with sales of fuel economy meters forecast to rise at a 5% CAGR through 2036. Flex-fuel cars run on ethanol or petrol, so displays sold in Brazil need to report consumption for both fuels. INMETRO's 2026 PBE vehicle table, updated in August 2026, lists 43 brands and 959 models and versions across flex, hybrid, electric and diesel types [13]. Car buyers in Brazil faced tight credit and high borrowing costs in 2025, according to Fenabrave [16]. Fenabrave still expects car and light commercial registrations to grow 3% to 2,625,912 units in 2026 [16], adding new cluster programs for display suppliers.
Key takeaway: Brazilian buyers will favour displays that switch cleanly between ethanol, petrol and electric readings.
USA Automotive Fuel Economy Meters Market Outlook (2026-2036)
High diesel prices in the EIA's October 2026 outlook keep fuel near the top of U.S. fleet budgets [7]. Fleet owners are buying driver scoring tools to cut that bill, and Samsara launched a Driver Efficiency Program in May 2026 that tracks recovered fuel cost [8]. Revenue in the USA will expand at a 4.7% CAGR through 2036, close to the global rate of 4.6%. NHTSA's December 2025 proposal puts the fleetwide average at about 34.5 mpg by model year 2031 [5], so carmakers will keep economy readouts on standard trims.
Key takeaway: High diesel prices make measured fuel savings the strongest sales argument with U.S. fleet buyers.
Germany Automotive Fuel Economy Meters Market Outlook (2026-2036)
Germany's national CO2 price adds about 15 cents net to every litre of diesel at 55 euros per tonne, according to KfW Research [17]. The price corridor for 2026 runs from 55 to 65 euros per tonne, keeping fuel cost in view for German drivers and fleets. Battery-electric cars took 19.1% of German new car registrations in 2025, based on KBA data [18], and each switch removes a buyer for fuel-only meters. Germany will still advance at a 4.4% CAGR through 2036, as 49,339,166 passenger cars on German roads in 2024 [6] form a large base for plug-in and fleet units.
Key takeaway: A rising CO2 charge on fuel keeps German sales steady even as battery-electric registrations grow.
Japan Automotive Fuel Economy Meters Market Outlook (2026-2036)
Hybrids took 60% of new car registrations in Japan from January to November 2025, according to JADA data reported by Argus [19]. Hybrid buyers already see fuel use and battery flow on the factory screen, so Japan posts the lowest rate here at a 3.7% CAGR through 2036. New vehicle sales rose 3.3% to 4,565,777 units in 2025 [14], and cluster software for these programs will bring most new revenue.
Key takeaway: Japanese growth relies on cluster software for hybrid programs, with little room left for add-on devices.
Who are the notable companies in the automotive fuel economy meters market?
Continental (AUMOVIO), Bosch, Denso, Visteon, Marelli, Garmin, AutoMeter, Actia, Geotab, and Samsara are the key companies profiled in this market.
Sales of automotive fuel economy meters reach drivers through three supplier groups, each serving a different buyer. Continental's AUMOVIO, Bosch, Denso, Visteon and Marelli build clusters for carmakers, and Garmin and AutoMeter sell devices directly to drivers. Actia, Geotab and Samsara serve fleets with telematics and driver scoring. Continental moved the automotive business into the separately listed AUMOVIO in September 2025 [20]. In February 2026, Actia reported 2025 revenue of EUR 535.4 million [21]. Analysts at FMI expect leading suppliers to add coaching features and software updates to gain more fleet and carmaker contracts.
- OEM cockpit and instrumentation integrators: Continental (AUMOVIO), Bosch, Denso, Visteon, and Marelli supply the factory clusters carrying fuel economy displays to new car buyers.
- Aftermarket and direct-driver devices: Garmin and AutoMeter sell gauges and displays to drivers wanting fuel data that the factory screen does not show.
- Fleet telematics and efficiency platforms: Fleets buying driver coaching choose among Actia, Geotab, and Samsara for fuel scores and manager reports.
Competitive Benchmarking: Automotive Fuel Economy Meters Market
Table 7: Competitive Benchmarking for the Automotive Fuel Economy Meters Market (qualitative capability ratings), 2026
| Company | Cluster | Data Access | Coaching | Reach |
|---|---|---|---|---|
| Continental (AUMOVIO) | High | High | Medium | High |
| Bosch | High | High | Low | High |
| Denso | High | High | Low | High |
| Visteon | High | High | Low | High |
| Marelli | High | High | Low | Medium |
| Garmin | Low | Medium | Medium | High |
| AutoMeter | Low | High | Low | Low |
| Actia | Medium | High | High | Medium |
| Geotab | Low | High | High | High |
| Samsara | Low | High | High | Medium |
Ratings run from High for broad public documentation of a capability, through Medium for a narrower documented role, to Low for limited public documentation.
Key Developments in the Automotive Fuel Economy Meters Market
- In May 2026, Samsara introduced a Driver Efficiency Program that scores drivers against load, terrain and traffic. Fleets can also track the fuel cost recovered through better driving [8].
- In March 2026, Samsara reported fiscal 2026 revenue of USD 1,618.6 million, up 30% [10], and fleet coaching features are set to add to this base.
- In February 2026, Visteon reported USD 1.4 billion of cluster business within record 2025 new business bookings of USD 7.4 billion [1].
- In January 2026, Geotab added near real-time idling and fuel efficiency feedback to Geotab Vitality. Drivers earn rewards in the app once personal fuel use improves [3].
Key Players in the Automotive Fuel Economy Meters Market
OEM Cockpit and Instrumentation Integrators
- Continental AG (automotive business now AUMOVIO SE)
- Robert Bosch GmbH
- DENSO Corporation
- Visteon Corporation
- Marelli Holdings Co., Ltd.
Aftermarket and Direct-Driver Devices
- Garmin Ltd.
- AutoMeter Products, Inc.
Fleet Telematics and Efficiency Platforms
- ACTIA Group
- Geotab Inc.
- Samsara Inc.
Automotive Fuel Economy Meters Market - Report Scope
Table 8: Report Scope for the Automotive Fuel Economy Meters Market (coverage fields and definitions), 2026 to 2036
| Coverage field | Report scope |
|---|---|
| Market breakdown | Meter type; vehicle type; data source; sales channel; application; region |
| Quantitative units | USD million |
| Market definition | Revenue at first sale from automotive fuel economy meters and the fuel economy function of factory displays. Coverage spans dashboard economy meters, aftermarket gauges, OBD-based meters, fleet economy displays and smart eco-driving meters. Total vehicle revenue, unrelated cockpit or telematics revenue and fuel-level gauges without an economy function are excluded. |
| Regions covered | North America; Latin America; Western Europe; Eastern Europe; East Asia; South Asia and Pacific; Middle East and Africa |
| Countries covered | Poland; Brazil; USA; Germany; Japan |
| Key companies profiled | Continental (AUMOVIO), Bosch, Denso, Visteon, Marelli, Garmin, AutoMeter, Actia, Geotab, Samsara |
| Forecast period | 2026 to 2036 |
| Approach | Cluster and telematics supplier activity is matched with estimates of vehicle fitment, fleet adoption and aftermarket sales in each profiled country. Whole cockpit and telematics revenue is netted out to avoid double counting. |
Automotive Fuel Economy Meters Market - Research Methodology
Table 9: Research Methodology for the Automotive Fuel Economy Meters Market (research methods and approach), 2026 edition
| Method | Approach |
|---|---|
| Primary Research | Discussions with cluster suppliers, telematics vendors, aftermarket retailers, fleet managers and vehicle electronics engineers covered fitment rates, unit prices, calibration needs and buying criteria. |
| Desk Research | Review of fuel economy rules, fuel price outlooks, vehicle registration and fleet age data, supplier annual reports and dated fleet software releases. |
| Market Sizing and Forecasting | Sizing starts from the 2025 market value and builds through meter unit prices, new vehicle fitment rates, plug-in device sales, fleet subscriptions and country sales conditions. |
| Data Validation | Figures were checked against supplier disclosures, official vehicle statistics and interview findings. Whole cluster and telematics subscription revenue is excluded, so each meter is counted once. |
Automotive Fuel Economy Meters Market by Segments
Automotive Fuel Economy Meters Market segmented by Meter Type:
- Dashboard economy meters
- Aftermarket fuel economy gauges
- OBD-based meters
- Fleet economy displays
- Smart eco-driving meters
Automotive Fuel Economy Meters Market segmented by Vehicle Type:
- Passenger cars
- Commercial vehicles
- Fleet vehicles
- Hybrid vehicles
- Off-highway vehicles
Automotive Fuel Economy Meters Market segmented by Data Source:
- OBD/CAN-based
- Fuel flow sensor-based
- GPS-telematics assisted
- ECU-estimated
Automotive Fuel Economy Meters Market segmented by Sales Channel:
- OEM instrument clusters
- Aftermarket retail
- Fleet telematics providers
- E-commerce/catalog
Automotive Fuel Economy Meters Market segmented by Application:
- Eco-driving feedback
- Fleet cost control
- Driver coaching
- Fuel compliance tracking
Automotive Fuel Economy Meters Market by Region
- North America
- United States
- Canada
- Latin America
- Brazil
- Mexico
- Argentina
- Chile
- Western Europe
- Germany
- France
- United Kingdom
- Italy
- Spain
- Benelux
- Nordics
- Eastern Europe
- Poland
- Czech Republic
- Romania
- Hungary
- East Asia
- Japan
- South Korea
- South Asia and Pacific
- ASEAN
- Australia and New Zealand
- Middle East and Africa
- GCC Countries
- South Africa
- Türkiye
- Israel
Research Sources and Bibliography
- [1] Visteon Corporation. (2026, February 19). Visteon Delivers Record Gross Margin and Adjusted EBITDA in 2025.https://www.visteon.com/investors/investor-news/news-details/2026/Visteon-Delivers-Record-Gross-Margin-and-Adjusted-EBITDA-in-2025/default.aspx
- [2] Geotab Inc. (2025, September 4). Geotab Surpasses 5 Million Global Subscriptions.https://www.geotab.com/press-release/geotab-5-million-subscriptions-milestone/
- [3] Geotab Inc. (2026, January 29). Drivers Can Now Earn More Rewards with Geotab Vitality's AI-powered Compliance and Fuel Efficiency Data.https://www.geotab.com/press-release/geotab-vitality-compliance-efficiency/
- [4] U.S. Environmental Protection Agency. (2026, February 19). Highlights of the Automotive Trends Report.https://www.epa.gov/automotive-trends/highlights-automotive-trends-report
- [5] National Highway Traffic Safety Administration, Federal Register. (2025, December 5). The Safer Affordable Fuel-Efficient (SAFE) Vehicles Rule III for Model Years 2022 to 2031 Passenger Cars and Light Trucks (proposed rule).https://www.govinfo.gov/content/pkg/FR-2025-12-05/html/2025-22014.htm
- [6] European Automobile Manufacturers' Association (ACEA). (2026, January 15). Report - Vehicles on European roads 2026.https://www.acea.auto/publication/report-vehicles-on-european-roads-2026/
- [7] U.S. Energy Information Administration. (2026, October 6). Short-Term Energy Outlook, October 2026.https://www.eia.gov/outlooks/steo/
- [8] Samsara Inc. (2026, May 20). May product updates: 4 new Samsara releases to help you improve efficiency.https://www.samsara.com/blog/may-product-updates-2026
- [9] European Commission, DG Climate Action. (2024, July 26). Publication of real-world CO2 emissions and fuel consumption of cars and vans collected in 2022.https://climate.ec.europa.eu/news-other-reads/news/publication-real-world-co2-emissions-and-fuel-consumption-cars-and-vans-collected-2022-2024-07-26_en
- [10] Samsara Inc. (2026, March 5). Samsara Reports Fourth Quarter and Full Fiscal Year 2026 Financial Results (Form 8-K, Exhibit 99.1).https://www.sec.gov/Archives/edgar/data/1642896/000162828026015170/samsaraepr-q42026.htm
- [11] Garmin Ltd. (2026, February 18). Garmin announces fourth quarter and fiscal year 2025 results.https://www8.garmin.com/aboutGarmin/invRelations/reports/2025_Q4_Earnings_Press_Release.pdf
- [12] European Automobile Manufacturers' Association (ACEA). (2026, January 27). New car registrations: +1.8% in 2025; battery-electric 17.4% market share.https://www.acea.auto/pc-registrations/new-car-registrations-1-8-in-2025-battery-electric-17-4-market-share/
- [13] Instituto Nacional de Metrologia, Qualidade e Tecnologia (INMETRO). (2026, August 14). Tabela PBE Veicular 2026 é atualizada com novos modelos e versões.https://www.gov.br/inmetro/pt-br/centrais-de-conteudo/noticias/tabela-pbe-veicular-2026-e-atualizada-com-novos-modelos-e-versoes
- [14] Jiji Press via Adnkronos. (2026, January 5). Japan's New Auto Sales Up for 1st Time in 2 Yrs.https://english.adnkronos.com/2026/01/05/japans-new-auto-sales-up-for-1st-time-in-2-yrs/
- [15] Forsal.pl (PAP), citing Instytut Badań Rynku Motoryzacyjnego Samar. (2026, January 26). Koniec boomu na używane samochody? Prywatny import hamuje, a ceny w spadają.https://forsal.pl/biznes/motoryzacja/artykuly/10631459,koniec-boomu-na-uzywane-samochody-prywatny-import-hamuje-a-ceny-w-spadaja.html
- [16] Safras & Mercado, citing Federação Nacional da Distribuição de Veículos Automotores (Fenabrave). (2026, January 13). Emplacamento de veículos cresce 8% em 2025, acima do previsto pela Fenabrave.https://safras.com.br/emplacamento-de-veiculos-cresce-8-em-2025-acima-do-previsto-pela-fenabrave/
- [17] KfW Research. (2025, October 23). Die CO2-Preisentwicklung für Wärme und Verkehr ist unsicher - mittelfristig könnten die Preise deutlich steigen.https://www.kfw.de/PDF/Download-Center/Konzernthemen/Research/PDF-Auf-einen-Blick/2025_10_23_Treibhausgasbepreisung.pdf
- [18] electrive.net, citing Kraftfahrt-Bundesamt (KBA). (2026, January 6). Bilanz 2025: Elektroauto-Neuzulassungen auf Rekordhoch.https://www.electrive.net/2026/01/06/bilanz-2025-neuzulassungen-von-elektroautos-2025-auf-rekordhoch/
- [19] Argus Media, citing Japan Automobile Dealers Association (JADA). (2025, December 18). Viewpoint: Japan's hybrid EV use keeps gasoline in mix.https://www.argusmedia.com/news-and-insights/latest-market-news/2767230-viewpoint-japan-s-hybrid-ev-use-keeps-gasoline-in-mix
- [20] Continental AG. (2025, September 18). Spin-off Automotive (AUMOVIO) overview.https://www.continental.com/de/investoren/veranstaltungen/spin-off-automotive-uebersicht/
- [21] ACTIA Group (via WebDisclosure). (2026, February 18). ACTIA Group: 2025 review and 2026 outlook.https://webdisclosure.com/article/actielec-epa-ati-actia-group-2025-review-and-2026-outlook-eloa0WlssQR
This bibliography is provided for reader reference. The full report contains the complete reference list and detailed citations.
This Report Answers
- What is the value of the automotive fuel economy meters market in 2026?
- By 2036, what revenue will automotive fuel economy meters reach?
- Which meter type leads fuel economy meter sales, and why?
- Do OBD/CAN-based systems lead the data source category, and which sales channel ranks first?
- Among Poland, Brazil, the USA, Germany and Japan, which country will post the fastest growth in fuel economy meter sales?
- Which cluster makers, aftermarket brands and telematics firms compete for fuel economy meter orders?
Frequently Asked Questions
How large is the automotive fuel economy meters market expected in 2026?
The automotive fuel economy meters market is valued at USD 483.0 million in 2026, according to FMI. Sales are set to reach USD 757.3 million by 2036 as fleets and carmakers give drivers live fuel data.
What CAGR is projected for the automotive fuel economy meters market through 2036?
Revenue is expected to rise at a 4.6% CAGR from 2026 to 2036. Fleet coaching programs, fuel economy rules and digital cluster upgrades will support this growth.
Which meter type holds a notable market share in 2026?
Dashboard economy meters will hold 28% of sales by meter type in 2026. Buyers of equipped vehicles will receive the display with the car and need no separate unit.
Which sales channel holds a notable share in 2026?
OEM instrument clusters will take 41% of revenue by sales channel in 2026. Fuel economy rules will keep an efficiency readout on every new vehicle program.
Which country has a notable expansion outlook through 2036?
Poland will post a 5.7% CAGR through 2036, the highest of the five profiled countries, as per FMI. Older cars on Polish roads will keep sales of plug-in OBD2 meters high.
Who are the key companies in the automotive fuel economy meters market?
Key companies include Continental (AUMOVIO), Bosch, Denso, Visteon, Marelli, Garmin, AutoMeter, Actia, Geotab, and Samsara. Cluster suppliers will serve carmakers, Garmin and AutoMeter will sell to drivers, and Actia, Geotab and Samsara will serve fleets.
Preview the report firsthand - request a free sample
Get SampleGet the brochure for pricing and purchase details.
Get PDFTable of Content
- Key Takeaways
- Market Size and CAGR
- Top Growth Driver
- Fastest Growing Segment
- Leading Region
- Key Companies
- Emerging Opportunities
- Executive Summary
- Global Market Outlook
- Demand-side Trends
- Supply-side Trends
- Technology Roadmap Analysis
- Analysis and Recommendations
- Analyst Perspective (What is happening? Why now? What should investors know?)
- Key Questions Answered
- How large is the market?
- What is the CAGR?
- What are key trends?
- Which region dominates?
- Who are the leaders?
- Market Overview
- Market Coverage / Taxonomy
- Market Definition / Scope / Limitations
- Research Methodology
- Chapter Orientation
- Analytical Lens and Working Hypotheses
- Market Structure, Signals, and Trend Drivers
- Benchmarking and Cross-market Comparability
- Market Sizing, Forecasting, and Opportunity Mapping
- Research Design and Evidence Framework
- Desk Research Programme (Secondary Evidence)
- Expert Input and Fieldwork (Primary Evidence)
- Tooling, Models, and Reference Databases
- Data Engineering and Model Build
- Quality Assurance and Audit Trail
- Market Background
- Market Dynamics (Drivers, Restraints, Opportunity, Trends)
- Scenario Forecast (Optimistic, Likely, Conservative)
- Impact Analysis
- AI Impact
- Sustainability Impact
- Regulatory Impact
- Technology Impact
- Consumer / Buyer Analysis
- Purchase Drivers
- Adoption Barriers
- Buyer Journey
- Opportunity Map Analysis
- Product Life Cycle Analysis
- Supply Chain Analysis
- Investment Feasibility Matrix
- Value Chain Analysis
- PESTLE and Porter's Analysis
- Regulatory Landscape
- Regional Parent Market Outlook
- Production and Consumption Statistics
- Import and Export Statistics
- Global Market Analysis and Forecast, 2021 to 2036
- Historical Market Size Value (USD Million) Analysis, 2021 to 2025
- Current and Future Market Size Value (USD Million) Projections, 2026 to 2036
- Y-o-Y Growth Trend Analysis
- Absolute $ Opportunity Analysis
- Global Market Pricing Analysis, 2021 to 2036
- Global Market Analysis and Forecast, By Meter Type, 2021 to 2036
- Introduction / Key Findings
- Historical Market Size Value (USD Million) Analysis By Meter Type, 2021 to 2025
- Current and Future Market Size Value (USD Million) Analysis and Forecast By Meter Type, 2026 to 2036
- Dashboard economy meters
- Aftermarket fuel economy gauges
- OBD-based meters
- Fleet economy displays
- Smart eco-driving meters
- Y-o-Y Growth Trend Analysis By Meter Type, 2021 to 2025
- Absolute $ Opportunity Analysis By Meter Type, 2026 to 2036
- Global Market Analysis and Forecast, By Vehicle Type, 2021 to 2036
- Introduction / Key Findings
- Historical Market Size Value (USD Million) Analysis By Vehicle Type, 2021 to 2025
- Current and Future Market Size Value (USD Million) Analysis and Forecast By Vehicle Type, 2026 to 2036
- Passenger cars
- Commercial vehicles
- Fleet vehicles
- Hybrid vehicles
- Off-highway vehicles
- Y-o-Y Growth Trend Analysis By Vehicle Type, 2021 to 2025
- Absolute $ Opportunity Analysis By Vehicle Type, 2026 to 2036
- Global Market Analysis and Forecast, By Data Source, 2021 to 2036
- Introduction / Key Findings
- Historical Market Size Value (USD Million) Analysis By Data Source, 2021 to 2025
- Current and Future Market Size Value (USD Million) Analysis and Forecast By Data Source, 2026 to 2036
- OBD/CAN-based
- Fuel flow sensor-based
- GPS-telematics assisted
- ECU-estimated
- Y-o-Y Growth Trend Analysis By Data Source, 2021 to 2025
- Absolute $ Opportunity Analysis By Data Source, 2026 to 2036
- Global Market Analysis and Forecast, By Sales Channel, 2021 to 2036
- Introduction / Key Findings
- Historical Market Size Value (USD Million) Analysis By Sales Channel, 2021 to 2025
- Current and Future Market Size Value (USD Million) Analysis and Forecast By Sales Channel, 2026 to 2036
- OEM instrument clusters
- Aftermarket retail
- Fleet telematics providers
- E-commerce/catalog
- Y-o-Y Growth Trend Analysis By Sales Channel, 2021 to 2025
- Absolute $ Opportunity Analysis By Sales Channel, 2026 to 2036
- Global Market Analysis and Forecast, By Application, 2021 to 2036
- Introduction / Key Findings
- Historical Market Size Value (USD Million) Analysis By Application, 2021 to 2025
- Current and Future Market Size Value (USD Million) Analysis and Forecast By Application, 2026 to 2036
- Eco-driving feedback
- Fleet cost control
- Driver coaching
- Fuel compliance tracking
- Y-o-Y Growth Trend Analysis By Application, 2021 to 2025
- Absolute $ Opportunity Analysis By Application, 2026 to 2036
- Global Market Analysis and Forecast, By Region, 2021 to 2036
- Introduction
- Historical Market Size Value (USD Million) Analysis By Region, 2021 to 2025
- Current Market Size Value (USD Million) Analysis and Forecast By Region, 2026 to 2036
- North America
- Latin America
- Western Europe
- Eastern Europe
- East Asia
- South Asia and Pacific
- Middle East and Africa
- Market Attractiveness Analysis By Region
- North America Market Analysis and Forecast, By Country, 2021 to 2036
- Historical Market Size Value (USD Million) Trend Analysis By Market Taxonomy, 2021 to 2025
- Market Size Value (USD Million) Forecast By Market Taxonomy, 2026 to 2036
- By Country
- United States
- Canada
- By Meter Type
- By Vehicle Type
- By Data Source
- By Sales Channel
- By Application
- By Country
- Market Attractiveness Analysis
- By Country
- By Meter Type
- By Vehicle Type
- By Data Source
- By Sales Channel
- By Application
- Key Takeaways
- Latin America Market Analysis and Forecast, By Country
- Historical Market Size Value (USD Million) Trend Analysis By Market Taxonomy, 2021 to 2025
- Market Size Value (USD Million) Forecast By Market Taxonomy, 2026 to 2036
- By Country
- Brazil
- Mexico
- Argentina
- Chile
- By Meter Type
- By Vehicle Type
- By Data Source
- By Sales Channel
- By Application
- By Country
- Market Attractiveness Analysis
- By Country
- By Meter Type
- By Vehicle Type
- By Data Source
- By Sales Channel
- By Application
- Key Takeaways
- Western Europe Market Analysis and Forecast, By Country
- Historical Market Size Value (USD Million) Trend Analysis By Market Taxonomy, 2021 to 2025
- Market Size Value (USD Million) Forecast By Market Taxonomy, 2026 to 2036
- By Country
- Germany
- France
- United Kingdom
- Italy
- Spain
- Benelux
- Nordics
- By Meter Type
- By Vehicle Type
- By Data Source
- By Sales Channel
- By Application
- By Country
- Market Attractiveness Analysis
- By Country
- By Meter Type
- By Vehicle Type
- By Data Source
- By Sales Channel
- By Application
- Key Takeaways
- Eastern Europe Market Analysis and Forecast, By Country
- Historical Market Size Value (USD Million) Trend Analysis By Market Taxonomy, 2021 to 2025
- Market Size Value (USD Million) Forecast By Market Taxonomy, 2026 to 2036
- By Country
- Poland
- Czech Republic
- Romania
- Hungary
- By Meter Type
- By Vehicle Type
- By Data Source
- By Sales Channel
- By Application
- By Country
- Market Attractiveness Analysis
- By Country
- By Meter Type
- By Vehicle Type
- By Data Source
- By Sales Channel
- By Application
- Key Takeaways
- East Asia Market Analysis and Forecast, By Country
- Historical Market Size Value (USD Million) Trend Analysis By Market Taxonomy, 2021 to 2025
- Market Size Value (USD Million) Forecast By Market Taxonomy, 2026 to 2036
- By Country
- Japan
- South Korea
- By Meter Type
- By Vehicle Type
- By Data Source
- By Sales Channel
- By Application
- By Country
- Market Attractiveness Analysis
- By Country
- By Meter Type
- By Vehicle Type
- By Data Source
- By Sales Channel
- By Application
- Key Takeaways
- South Asia and Pacific Market Analysis and Forecast, By Country
- Historical Market Size Value (USD Million) Trend Analysis By Market Taxonomy, 2021 to 2025
- Market Size Value (USD Million) Forecast By Market Taxonomy, 2026 to 2036
- By Country
- ASEAN
- Australia and New Zealand
- By Meter Type
- By Vehicle Type
- By Data Source
- By Sales Channel
- By Application
- By Country
- Market Attractiveness Analysis
- By Country
- By Meter Type
- By Vehicle Type
- By Data Source
- By Sales Channel
- By Application
- Key Takeaways
- Middle East and Africa Market Analysis and Forecast, By Country
- Historical Market Size Value (USD Million) Trend Analysis By Market Taxonomy, 2021 to 2025
- Market Size Value (USD Million) Forecast By Market Taxonomy, 2026 to 2036
- By Country
- GCC Countries
- South Africa
- Türkiye
- Israel
- By Meter Type
- By Vehicle Type
- By Data Source
- By Sales Channel
- By Application
- By Country
- Market Attractiveness Analysis
- By Country
- By Meter Type
- By Vehicle Type
- By Data Source
- By Sales Channel
- By Application
- Key Takeaways
- Key Countries Market Analysis
- United States
- Pricing Analysis
- Market Share Analysis, 2025
- By Meter Type
- By Vehicle Type
- By Data Source
- By Sales Channel
- By Application
- Canada
- Pricing Analysis
- Market Share Analysis, 2025
- By Meter Type
- By Vehicle Type
- By Data Source
- By Sales Channel
- By Application
- Mexico
- Pricing Analysis
- Market Share Analysis, 2025
- By Meter Type
- By Vehicle Type
- By Data Source
- By Sales Channel
- By Application
- Brazil
- Pricing Analysis
- Market Share Analysis, 2025
- By Meter Type
- By Vehicle Type
- By Data Source
- By Sales Channel
- By Application
- Chile
- Pricing Analysis
- Market Share Analysis, 2025
- By Meter Type
- By Vehicle Type
- By Data Source
- By Sales Channel
- By Application
- Germany
- Pricing Analysis
- Market Share Analysis, 2025
- By Meter Type
- By Vehicle Type
- By Data Source
- By Sales Channel
- By Application
- United Kingdom
- Pricing Analysis
- Market Share Analysis, 2025
- By Meter Type
- By Vehicle Type
- By Data Source
- By Sales Channel
- By Application
- Italy
- Pricing Analysis
- Market Share Analysis, 2025
- By Meter Type
- By Vehicle Type
- By Data Source
- By Sales Channel
- By Application
- Spain
- Pricing Analysis
- Market Share Analysis, 2025
- By Meter Type
- By Vehicle Type
- By Data Source
- By Sales Channel
- By Application
- France
- Pricing Analysis
- Market Share Analysis, 2025
- By Meter Type
- By Vehicle Type
- By Data Source
- By Sales Channel
- By Application
- ASEAN
- Pricing Analysis
- Market Share Analysis, 2025
- By Meter Type
- By Vehicle Type
- By Data Source
- By Sales Channel
- By Application
- Australia and New Zealand
- Pricing Analysis
- Market Share Analysis, 2025
- By Meter Type
- By Vehicle Type
- By Data Source
- By Sales Channel
- By Application
- Japan
- Pricing Analysis
- Market Share Analysis, 2025
- By Meter Type
- By Vehicle Type
- By Data Source
- By Sales Channel
- By Application
- South Korea
- Pricing Analysis
- Market Share Analysis, 2025
- By Meter Type
- By Vehicle Type
- By Data Source
- By Sales Channel
- By Application
- Poland
- Pricing Analysis
- Market Share Analysis, 2025
- By Meter Type
- By Vehicle Type
- By Data Source
- By Sales Channel
- By Application
- Hungary
- Pricing Analysis
- Market Share Analysis, 2025
- By Meter Type
- By Vehicle Type
- By Data Source
- By Sales Channel
- By Application
- Türkiye
- Pricing Analysis
- Market Share Analysis, 2025
- By Meter Type
- By Vehicle Type
- By Data Source
- By Sales Channel
- By Application
- South Africa
- Pricing Analysis
- Market Share Analysis, 2025
- By Meter Type
- By Vehicle Type
- By Data Source
- By Sales Channel
- By Application
- United States
- Market Structure Analysis
- Competition Dashboard
- Competition Benchmarking
- Market Share Analysis of Top Players
- By Regional
- By Meter Type
- By Vehicle Type
- By Data Source
- By Sales Channel
- By Application
- Emerging Startups
- Innovation Benchmarking
- Competition Analysis
- Competition Deep Dive
- Continental (AUMOVIO)
- Overview
- Product Portfolio
- Profitability by Market Segments
- Sales Footprint
- Strategy Overview
- Marketing Strategy
- Product Strategy
- Channel Strategy
- Bosch
- Denso
- Visteon
- Marelli
- Garmin
- AutoMeter
- Actia
- Geotab
- Samsara
- Continental AG (automotive business now AUMOVIO SE)
- Robert Bosch GmbH
- DENSO Corporation
- Visteon Corporation
- Marelli Holdings Co., Ltd.
- Garmin Ltd.
- AutoMeter Products, Inc.
- ACTIA Group
- Continental (AUMOVIO)
- Case Studies
- Success Stories
- Recent Developments
- Competition Deep Dive
- Assumptions & Acronyms Used


