The demand for digital instrument clusters in Japan is expected to grow from USD 275.8 million in 2025 to USD 1,122.9 million by 2035, reflecting a compound annual growth rate (CAGR) of 15.1%. Digital instrument clusters, also known as digital dashboards or displays, are rapidly replacing traditional analogue gauges in modern vehicles. These clusters offer enhanced functionality, improved aesthetics, and a more connected user experience, providing drivers with customizable displays, real-time vehicle data, and seamless integration with navigation, infotainment, and other advanced vehicle systems. As the automotive industry continues to evolve with technological advancements, the demand for digital instrument clusters is set to increase significantly.
The growth of digital instrument clusters is closely tied to the overall advancement of in-car technologies. The shift towards electric vehicles (EVs), the development of autonomous driving systems, and the increasing demand for more sophisticated infotainment solutions are all key drivers of this industry. As automakers focus on integrating advanced digital interfaces into their vehicles, digital instrument clusters have become essential in meeting the demands of modern drivers. These systems not only provide critical vehicle information but also enhance the overall driving experience, enabling features such as voice-activated controls, real-time traffic data, and even augmented reality navigation.

Between 2025 and 2030, the demand for digital instrument clusters in Japan is expected to grow from USD 275.8 million to USD 317.3 million. This period will witness steady growth as automakers continue to adopt digital clusters, initially in higher-end models and gradually extending to mid-range and mass-industry vehicles. The increasing popularity of electric vehicles (EVs) and the rising trend of connected vehicle technologies will provide a solid foundation for this growth. As more automakers integrate digital clusters in their vehicles, consumer demand for advanced, customizable, and high-tech features will further contribute to the industry’s expansion.
From 2030 to 2035, the industry is projected to experience significant acceleration, with demand reaching USD 1,122.9 million by 2035. This phase will see the widespread adoption of digital instrument clusters across a broader range of vehicle categories, from economy cars to luxury models. The shift towards fully electric and autonomous vehicles will be a key catalyst for this growth, as digital displays are essential for providing the necessary vehicle data in these next-generation vehicles. Continuous advancements in digital display technologies, including improvements in screen resolution, customization options, and integration with driver assistance systems, will make digital instrument clusters even more attractive to both automakers and consumers.
| Metric | Value |
|---|---|
| Demand for Digital Instrument Clusters in Japan Value (2025) | USD 275.8 million |
| Demand for Digital Instrument Clusters in Japan Forecast Value (2035) | USD 1,122.9 million |
| Demand for Digital Instrument Clusters in Japan Forecast CAGR (2025-2035) | 15.1% |
The demand for digital instrument clusters in Japan is rapidly increasing due to the rising adoption of advanced automotive technologies and the shift toward more user-friendly, customizable, and technologically advanced vehicle displays. Digital instrument clusters offer enhanced features such as touch screens, real-time data visualization, and integration with various in-vehicle technologies like infotainment systems and driver assistance systems, which are driving their growing popularity
A key factor driving this demand is the automotive industry's push towards smarter, more connected vehicles. Digital instrument clusters provide better integration with the digital ecosystem, offering features like customizable displays, navigation aids, and real-time performance tracking, which appeal to tech-savvy consumers. As Japan continues to lead in automotive innovation, particularly in electric and autonomous vehicles, the demand for digital displays in vehicles is expected to grow significantly.
The rapid advancements in display technologies, including OLED, TFT, and AMOLED, are also contributing to the increasing adoption of digital instrument clusters. These technologies allow for clearer, brighter, and more energy-efficient displays that enhance the driving experience. With Japan’s strong emphasis on innovation and sustainable transportation, the demand for digital instrument clusters is projected to continue expanding through 2035, fueled by both consumer demand for high-tech features and advancements in automotive design.
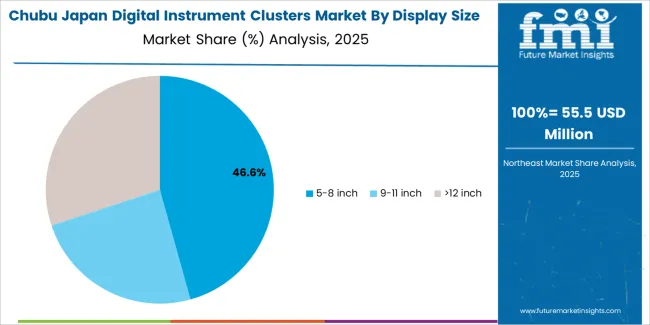
Demand for digital instrument clusters in Japan is segmented by display type, application, display size, and region. By display type, demand is divided into TFT-LCD, LCD, and OLED, with TFT-LCD holding the largest share at 50%. The demand is also segmented by application, including automobile, tablet PC/desktop/notebook, smartphones, and others, with the automobile sector leading the demand at 45.2%. In terms of display size, demand is divided into 5-8 inch, 9-11 inch, and >12 inch, with the 5-8 inch display size leading the demand. Regionally, demand is divided into Kyushu & Okinawa, Kanto, Kinki, Chubu, Tohoku, and the Rest of Japan.
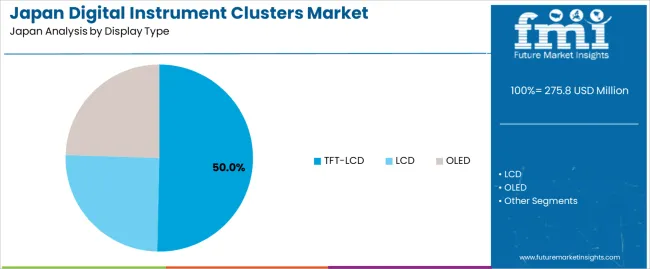
TFT-LCD accounts for 50% of the demand for digital instrument clusters in Japan. TFT-LCD (Thin-Film Transistor Liquid Crystal Display) is favored for its balance of performance, cost-effectiveness, and energy efficiency. It offers high-resolution images and faster response times compared to traditional LCD displays, making it ideal for automotive applications, where precise, clear, and responsive visual output is crucial for drivers. The technology is also widely adopted in consumer electronics such as tablet PCs and smartphones due to its affordability and ability to deliver vibrant colors and sharp contrast.
TFT-LCD’s capability to provide reliable, high-quality displays at a competitive price point ensures its continued dominance in the industry for digital instrument clusters, particularly in the automobile sector. As the demand for advanced automotive technology grows, especially for digital dashboards and smart instrument clusters, TFT-LCD displays will remain a key component in these applications.
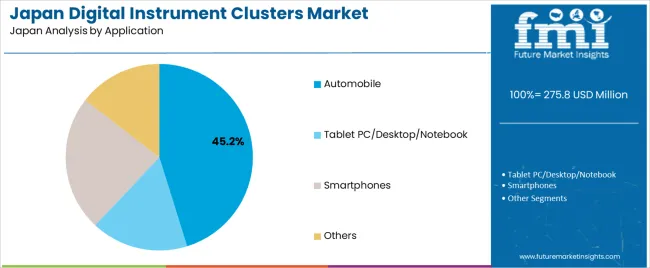
The automobile sector accounts for 45.2% of the demand for digital instrument clusters in Japan. Digital instrument clusters are becoming increasingly popular in vehicles due to their ability to provide customizable, high-resolution displays for important driving information, such as speed, fuel levels, and navigation data. The automotive industry is transitioning from traditional analog dashboards to digital ones, driven by the need for modern, sleek, and customizable user interfaces in vehicles.
This shift is especially prominent in high-end vehicles and electric vehicles (EVs), where digital instrument clusters provide more flexibility in terms of design and functionality. With the increasing integration of smart features and advanced driver assistance systems (ADAS), digital instrument clusters offer a more intuitive and connected driving experience, further driving their demand in the automobile industry. As the automotive sector continues to innovate, the need for high-performance digital displays in vehicles will continue to grow, ensuring the dominance of this application.
Demand for digital instrument clusters in Japan is driven by the shift toward electric vehicles (EVs), hybrids and connected/autonomous‑ready cars, where configurable digital displays are increasingly standard. Japanese OEMs are focusing on cockpit experience, integrating ADAS (advanced driver‑assistance systems), infotainment, and digital cockpits; this enhances demand for full‑digital or large‑screen clusters. Restraints include the higher cost of fully digital clusters compared to analog or hybrid displays, supply‑chain issues (such as semiconductor or display panel shortages), and adoption inertia in lower‑cost vehicle segments where traditional clusters still dominate.
In Japan, demand for digital instrument clusters is growing because automakers are increasingly adopting them to meet consumer expectations for advanced, tech‑rich vehicle interiors. The rise of electric vehicles (EVs) and hybrids, along with the growing focus on durability, has amplified the need for digital clusters that display critical information such as battery metrics, range, ADAS (advanced driver‑assistance system) alerts, and infotainment.
These clusters offer greater design flexibility, allowing for customization, multilingual readouts, and future‑proofing features. Digital clusters provide a sleek, modern aesthetic that appeals to tech‑savvy consumers. This shift from traditional analog to digital displays is evident in new vehicle launches, especially as automakers seek to differentiate their models in a competitive industry while aligning with Japan’s reputation for high‑quality, cutting‑edge automotive technology.
Technological innovations are driving the growth of digital instrument clusters in Japan through advances in display technologies and user interaction. High‑resolution displays, including TFT and OLED screens, offer clearer visuals and enhanced colour accuracy, while curved or panoramic panels provide an immersive experience. Integration with head‑up displays (HUDs) and augmented reality (AR) overlays allows for real‑time data projection, improving the driving experience.
Digital clusters are becoming more connected, offering vehicle‑to‑cloud capabilities and smartphone integration for seamless interaction with apps and services. These innovations are creating a more interactive and user‑friendly environment for drivers, aligning with Japan’s focus on premium automotive features. The technological advancements in design and functionality are driving faster adoption of digital clusters, particularly in high‑end vehicles and new models, in line with Japan’s push toward innovation in its automotive sector.
Despite strong demand, several challenges limit the adoption of digital instrument clusters in Japan. One of the main issues is the high cost associated with larger, high‑specification screens and the embedded electronics required, which can increase vehicle production costs, particularly for entry‑level or mass‑industry vehicles. Supply‑chain constraints, including shortages of critical components like display panels, semiconductors, and GPUs, add to the complexity and cost of manufacturing.
The integration of digital clusters with existing vehicle systems involves technical hurdles, including software compatibility, calibration, and cybersecurity concerns. Manufacturers may also be reluctant to adopt digital clusters in older or cost‑sensitive vehicle models, opting instead for hybrid or analog alternatives. These factors create barriers that slow the universal adoption of fully digital instrument clusters across all vehicle categories in Japan.

| Region | CAGR (%) |
|---|---|
| Kyushu & Okinawa | 18.8% |
| Kanto | 17.3% |
| Kinki | 15.2% |
| Chubu | 13.4% |
| Tohoku | 11.8% |
| Rest of Japan | 11.2% |
Demand for digital instrument clusters in Japan is growing rapidly, with Kyushu & Okinawa leading at an 18.8% CAGR. Kanto follows with a 17.3% CAGR, supported by the region's strong automotive manufacturing base, including major companies like Toyota and Nissan, who are pushing for next-generation vehicle technologies. Kinki shows a 15.2% CAGR, with its automotive and electronics industries embracing digital clusters to improve driver experience and fuel the transition to electric and hybrid vehicles. Chubu experiences a 13.4% CAGR, with its automotive sector focusing on smart vehicle systems. Tohoku sees an 11.8% CAGR, driven by its modernizing automotive sector, while the Rest of Japan experiences a steady 11.2% growth, supported by the growing need for advanced automotive technologies.
Kyushu & Okinawa are experiencing the highest demand for digital instrument clusters in Japan, with an 18.8% CAGR. This growth is driven by the region’s rapidly expanding automotive industry, where digital instrument clusters are increasingly being integrated into modern vehicles for enhanced displays and advanced functionality. Kyushu & Okinawa’s automotive manufacturers, particularly in cities like Fukuoka and Okinawa, are adopting digital clusters to improve driver experience and fuel the demand for next-generation technologies in their vehicles.
The growing preference for electric vehicles (EVs) and the rise in smart vehicle features further contribute to the region’s strong demand for digital instrument clusters. As Kyushu & Okinawa continue to invest in automotive innovation and sustainable mobility, the demand for digital instrument clusters is expected to grow rapidly, driven by the increasing need for advanced vehicle electronics.
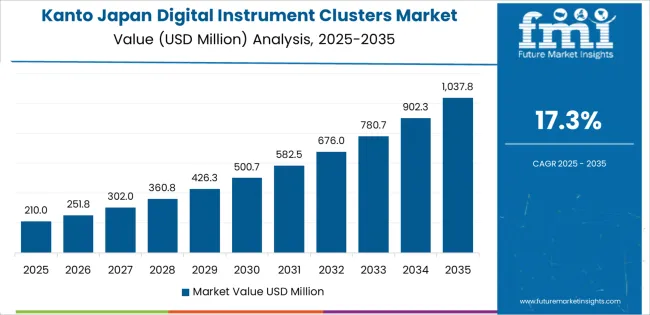
Kanto is experiencing strong demand for digital instrument clusters in Japan, with a 17.3% CAGR. The region's demand is primarily driven by its strong automotive sector, which includes major manufacturers like Toyota, Honda, and Nissan. Kanto’s automotive industry is increasingly adopting digital instrument clusters as part of the trend toward more advanced vehicle displays that provide better connectivity, safety, and user experience.
The region is also a hub for automotive innovation, with ongoing developments in electric and autonomous vehicles, which are driving the need for high-tech instrument clusters. As Kanto continues to lead the charge in automotive manufacturing and technology, demand for digital instrument clusters is expected to remain robust, especially with the growing focus on smart vehicle systems and the shift toward more sustainable transportation solutions.
Kinki is experiencing strong demand for digital instrument clusters in Japan, with a 15.2% CAGR. The region’s demand is fueled by its well-established automotive and electronics sectors, particularly in cities like Osaka and Kyoto, which are home to major vehicle manufacturers and suppliers. Digital instrument clusters are increasingly being integrated into vehicles to offer enhanced displays, multifunctional capabilities, and improved driver information systems.
Kinki's automotive industry, particularly the production of hybrid and electric vehicles, contributes to the increasing adoption of these digital clusters. As the region focuses on producing more advanced automotive technologies, the demand for digital instrument clusters continues to grow steadily. The region’s commitment to innovation in both automotive and electronics industries ensures that demand for high-tech digital instruments will remain strong, especially with the shift toward smarter and more efficient vehicles.
Chubu is seeing steady demand for digital instrument clusters in Japan, with a 13.4% CAGR. The region's automotive industry, including major players like Toyota and Honda, is a significant driver of this demand, as automakers increasingly adopt digital instrument clusters in their vehicles to enhance user experience and improve vehicle functionality. Chubu’s growing interest in electric and hybrid vehicles also contributes to the rising demand for advanced digital clusters that provide more precise information about vehicle performance, energy consumption, and safety.
The region’s strong focus on technological advancements in automotive electronics further supports the adoption of digital instrument clusters. As the region continues to innovate in automotive technologies and shift toward cleaner, smarter vehicles, the demand for digital instrument clusters will continue to grow at a healthy pace.
Tohoku is experiencing moderate demand for digital instrument clusters in Japan, with an 11.8% CAGR. The region’s demand is primarily driven by its smaller automotive manufacturing base, which is increasingly adopting digital clusters for integration into modern vehicles. Tohoku's automotive industry, while not as large as those in Kanto or Kyushu, is focused on providing high-tech, energy-efficient vehicles, especially electric and hybrid models, which require advanced digital instrument clusters.
As the region’s automotive sector continues to modernize and align with global automotive trends, the adoption of digital instrument clusters is expected to grow steadily. Tohoku’s focus on durability and cleaner energy solutions contributes to the demand for advanced vehicle technologies, including digital instrument clusters, which provide better energy management and enhanced user interaction.
The Rest of Japan is experiencing steady demand for digital instrument clusters, with an 11.2% CAGR. While the region does not have as large an automotive manufacturing presence as the major hubs like Kanto or Kyushu & Okinawa, there is still significant demand for digital instrument clusters in vehicles produced for the local industry. The increasing adoption of electric vehicles (EVs) and the region’s focus on improving vehicle safety, connectivity, and energy efficiency are driving the demand for these advanced instrument clusters.
Smaller automotive manufacturers and suppliers in the Rest of Japan are also increasingly integrating digital instrument clusters into their vehicle offerings to meet growing consumer expectations for high-tech, smart vehicle features. As the demand for smarter, more efficient transportation solutions continues to rise, the Rest of Japan will see steady growth in the use of digital instrument clusters.
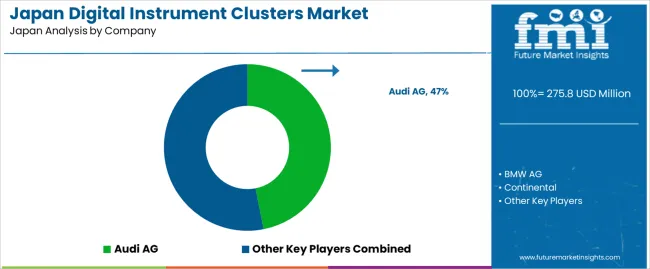
In Japan, demand for digital instrument clusters is accelerating, particularly as advanced driver‑assistance systems (ADAS), electric vehicle adoption, and connected car features gather momentum. These systems are increasingly replacing traditional analog dials with high‑resolution displays capable of showing driving data, navigation, battery status and vehicle diagnostics. Japanese manufacturers and global OEMs view the cockpit display as a key differentiator in vehicle design and user experience.
Major suppliers active in this segment include Audi AG (holding approximately 46.9 % share), BMW AG, Continental AG, Dakota Digital and Ford Motor Company. These companies differentiate through large‑scale vehicle programmes, advanced display and graphics capabilities, integration of digital clusters with vehicle infotainment and driver interfaces, and strong global automotive supply‑chain networks tailored to meet Japan’s requirements.
Competitive dynamics in Japan’s digital instrument cluster space are shaped by several factors. First, as EVs and luxury vehicles proliferate, manufacturers demand digital clusters that support battery and range displays, personalization, and rich graphics. Secondly, the push for digital and connected cockpits means clusters must interface with telematics, ADAS alerts and infotainment, driving technical complexity and vendor capabilities. Thirdly, legacy analog suppliers face challenges such as cost pressures, supply‑chain localisation and rapid refresh‑cycles of display electronics. Suppliers who can deliver high‑resolution, reconfigurable displays, seamless integration with vehicle electronics, and robust service‑and‑supply frameworks will be best positioned to secure business in Japan’s evolving digital instrument cluster arena.
| Items | Values |
|---|---|
| Quantitative Units (2025) | USD million |
| Display Type | TFT-LCD, LCD, OLED |
| Display Size | 5-8 inch, 9-11 inch, >12 inch |
| Application | Automobile, Tablet PC/Desktop/Notebook, Smartphones, Others |
| Region | Kyushu & Okinawa, Kanto, Kinki, Chubu, Tohoku, Rest of Japan |
| Countries Covered | Japan |
| Key Companies Profiled | Audi AG, BMW AG, Continental, Dakota Digital, Ford Motor Company |
| Additional Attributes | Dollar sales by display type and size; regional CAGR and adoption trends; demand trends in digital instrument clusters; growth in automobile and electronics sectors; technology adoption for vehicle dashboards and devices; vendor offerings including hardware, software, and platform integration; regulatory influences and industry standards |
The demand for digital instrument clusters in japan is estimated to be valued at USD 275.8 million in 2025.
The market size for the digital instrument clusters in japan is projected to reach USD 1,122.9 million by 2035.
The demand for digital instrument clusters in japan is expected to grow at a 15.1% CAGR between 2025 and 2035.
The key product types in digital instrument clusters in japan are tft-lcd, lcd and oled.
In terms of display size, 5-8 inch segment is expected to command 44.6% share in the digital instrument clusters in japan in 2025.


Our Research Products

The "Full Research Suite" delivers actionable market intel, deep dives on markets or technologies, so clients act faster, cut risk, and unlock growth.

The Leaderboard benchmarks and ranks top vendors, classifying them as Established Leaders, Leading Challengers, or Disruptors & Challengers.

Locates where complements amplify value and substitutes erode it, forecasting net impact by horizon

We deliver granular, decision-grade intel: market sizing, 5-year forecasts, pricing, adoption, usage, revenue, and operational KPIs—plus competitor tracking, regulation, and value chains—across 60 countries broadly.

Spot the shifts before they hit your P&L. We track inflection points, adoption curves, pricing moves, and ecosystem plays to show where demand is heading, why it is changing, and what to do next across high-growth markets and disruptive tech

Real-time reads of user behavior. We track shifting priorities, perceptions of today’s and next-gen services, and provider experience, then pace how fast tech moves from trial to adoption, blending buyer, consumer, and channel inputs with social signals (#WhySwitch, #UX).

Partner with our analyst team to build a custom report designed around your business priorities. From analysing market trends to assessing competitors or crafting bespoke datasets, we tailor insights to your needs.
Supplier Intelligence
Discovery & Profiling
Capacity & Footprint
Performance & Risk
Compliance & Governance
Commercial Readiness
Who Supplies Whom
Scorecards & Shortlists
Playbooks & Docs
Category Intelligence
Definition & Scope
Demand & Use Cases
Cost Drivers
Market Structure
Supply Chain Map
Trade & Policy
Operating Norms
Deliverables
Buyer Intelligence
Account Basics
Spend & Scope
Procurement Model
Vendor Requirements
Terms & Policies
Entry Strategy
Pain Points & Triggers
Outputs
Pricing Analysis
Benchmarks
Trends
Should-Cost
Indexation
Landed Cost
Commercial Terms
Deliverables
Brand Analysis
Positioning & Value Prop
Share & Presence
Customer Evidence
Go-to-Market
Digital & Reputation
Compliance & Trust
KPIs & Gaps
Outputs
Full Research Suite comprises of:
Market outlook & trends analysis
Interviews & case studies
Strategic recommendations
Vendor profiles & capabilities analysis
5-year forecasts
8 regions and 60+ country-level data splits
Market segment data splits
12 months of continuous data updates
DELIVERED AS:
PDF EXCEL ONLINE
Digital Instrument Clusters Market Growth - Trends & Forecast 2025 to 2035
Demand for Digital Instrument Clusters in USA Size and Share Forecast Outlook 2025 to 2035
Japan Digital Illustration App Market Insights – Growth, Demand & Trends 2025-2035
Japan Digital Textile Printing Market Report – Trends & Innovations 2025-2035
Digital Writing Instruments Market Size and Share Forecast Outlook 2025 to 2035
Demand for Digital Commerce in Japan Size and Share Forecast Outlook 2025 to 2035
Demand for Digital Power Conversion in Japan Size and Share Forecast Outlook 2025 to 2035
Digital Hall Effect Gaussmeter Market Size and Share Forecast Outlook 2025 to 2035
Digital Group Dining Service Market Size and Share Forecast Outlook 2025 to 2035
Digital Pathology Displays Market Size and Share Forecast Outlook 2025 to 2035
Japan Faith-based Tourism Market Size and Share Forecast Outlook 2025 to 2035
Japan Sports Tourism Market Size and Share Forecast Outlook 2025 to 2035
Digital Rights Management Market Size and Share Forecast Outlook 2025 to 2035
Digital Liquid Filling Systems Market Size and Share Forecast Outlook 2025 to 2035
Digital Transformation Industry Analysis in MENA Size and Share Forecast Outlook 2025 to 2035
Instruments for Peptide Drug Synthesis Market Size and Share Forecast Outlook 2025 to 2035
Digital X-Ray Equipment Market Size and Share Forecast Outlook 2025 to 2035
Digital Marketing Analytics Industry Analysis in Latin America Forecast Outlook 2025 to 2035
Digital Health Market Forecast and Outlook 2025 to 2035
Digital Pen Market Forecast and Outlook 2025 to 2035

Thank you!
You will receive an email from our Business Development Manager. Please be sure to check your SPAM/JUNK folder too.
Chat With
MaRIA