The demand for digital instrument clusters in USA is valued at USD 2.0 billion in 2025 and is projected to reach USD 11.4 billion by 2035, reflecting a compound annual growth rate of 19.1%. Breakpoint analysis shows the first major shift between 2025 and 2027 as demand moves from USD 2.0 billion to USD 2.8 billion, marking an early acceleration driven by wider adoption of fully digital cockpit layouts and expanding integration across mid-range vehicle models. A second breakpoint appears around 2029, when values reach USD 4.0 billion, indicating faster replacement cycles and broader use of customizable display systems. Continued adoption of advanced driver interfaces strengthens this upward movement across both new production and retrofit channels.
A third breakpoint emerges between 2031 and 2033, where demand increases from USD 5.7 billion to USD 8.0 billion, reflecting growing integration of graphical clusters across electric vehicles and connected platforms. The final and most pronounced breakpoint occurs as values rise from USD 9.6 billion in 2034 to USD 11.4 billion in 2035, marking the phase where digital clusters become standard across nearly all vehicle segments. This sequence of breakpoints illustrates a market transitioning from early adoption to widespread implementation, supported by steady upgrades in display resolution, interface responsiveness and vehicle-system integration across USA.
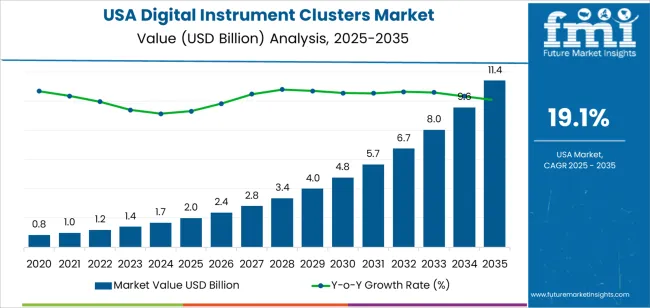
Demand in USA for digital instrument clusters is projected to rise from USD 2.0 billion in 2025 to USD 11.4 billion by 2035, reflecting a compound annual growth rate (CAGR) of approximately 19.1%. The value increases from USD 0.8 billion in 2020, through USD 1.7 billion in 2024, reaching USD 2.0 billion in 2025, and then climbs steeply to USD 11.4 billion in 2035. Growth is driven by accelerating adoption of electric vehicles, advanced driver assistance systems (ADAS), and integrated digital cockpits all of which elevate the content of digital displays in vehicles.
Over the forecast period the uplift from USD 2.0 billion to USD 11.4 billion an increase of USD 9.4 billion is underpinned by both volume expansion and rising per‐unit value. Early in the decade the increase is volume‐led as more vehicles incorporate full‐digital instrument clusters instead of analog units. In the latter years the value growth becomes increasingly significant as units integrate higher resolution displays, multifunctional digital interfaces, connectivity, and subscription services tied to in‐vehicle systems. The rapid ascend underscores a transition from early adoption toward mainstream digital cockpit ecosystems in the USA automotive sector.
| Metric | Value |
|---|---|
| Industry Value (2025) | USD 2.0 billion |
| Forecast Value (2035) | USD 11.4 billion |
| Forecast CAGR (2025–2035) | 19.1% |
The demand for digital instrument clusters in USA has been influenced historically by consumers’ increasing expectations for modern vehicle interfaces and automakers’ shift away from analog gauges. Traditional mechanical clusters dominated older vehicles, but the rise of infotainment systems, growing vehicle connectivity and strong USA automotive manufacturing volumes encouraged adoption of digital clusters in higher-end models first. As premium vehicles included full digital displays, the technology moved down-market and became more accessible in mid-tier vehicles. Aftermarket upgrades also contributed to demand as older vehicles were retrofitted with digital display modules. These historical drivers reflect a transition phase where vehicle electronics and cockpit digitalisation began reshaping instrument-panel design.
Looking ahead, future growth is being driven by electrification, connected-vehicle architecture and software-defined vehicle trends in the USA As electric vehicles (EVs), hybrids and advanced driver-assistance systems (ADAS) become more common, digital clusters serve as critical hubs for dynamic information, energy-management read-outs and real-time diagnostics. Vehicle manufacturers are adopting clusters that support over-the-air updates, custom graphics themes and convergence with infotainment systems, which enhances personalization and engagement. The shift toward software-defined vehicles means instrument clusters are no longer static; they must integrate with cloud services, user profiles, vehicle-to-cloud messaging and next-generation human-machine interfaces. Although supply-chain constraints for displays and chips remain a challenge, the converging forces of vehicle digitalisation and EV growth suggest demand for digital instrument clusters in USA will continue to rise.
The demand for digital instrument clusters in USA is shaped by the display technologies selected for vehicle dashboards and the display sizes that determine layout, readability and feature integration. Display types include LCD, TFT-LCD and OLED, each offering different clarity levels, contrast performance and power requirements. Display sizes such as 5–8 inch, 9–11 inch and above 12-inch support varied design approaches across entry-level, mid-range and premium vehicles. As manufacturers focus on clear information delivery, user-friendly layouts and compatibility with advanced driver interfaces, the combination of display type and size influences adoption across USA’s automotive market.
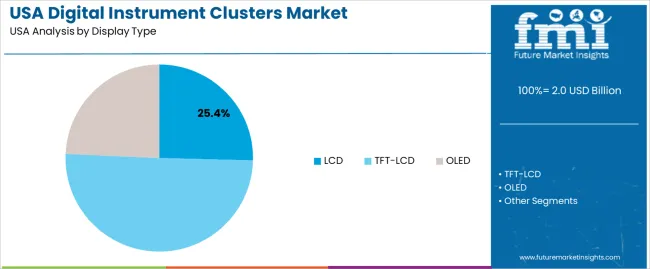
LCD displays account for 25% of total demand across display type categories in USA. Their leading presence reflects dependable visibility, stable performance and manageable cost for widespread vehicle segments. Manufacturers adopt LCDs for models requiring clear information presentation without the complexity of high-end display technologies. LCDs support essential driver data such as speed, fuel and alerts with predictable brightness and consistent response times. Their compatibility with established production lines helps maintain reliable integration across both new models and updated variants in large-volume manufacturing programs.
Demand for LCD clusters also grows as automakers address needs in compact and mid-range vehicles that require cost-efficient solutions while maintaining functional dashboards. The technology supports steady performance under varied lighting conditions found in everyday driving. Workshops value LCD reliability for long-term use and low maintenance needs. As automakers continue reinforcing dependable and practical instrument cluster solutions across broad consumer groups, LCD displays keep a stable share of adoption in USA.
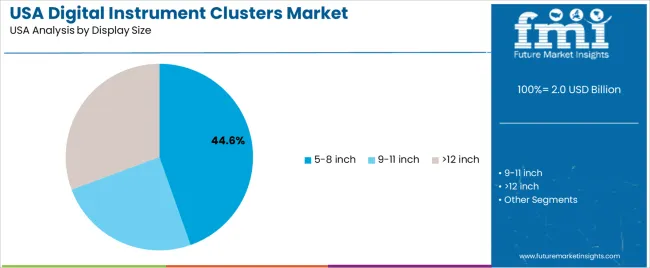
The 5–8-inch category accounts for 44.6% of total demand across display size segments in USA. Its leading share reflects strong use in mainstream vehicles where dashboards require compact screens that balance clarity with manageable layout constraints. This size supports essential driver information without occupying extensive dashboard space. Manufacturers rely on it for straightforward integration with analog-digital hybrid clusters or fully digital entry-level formats. The size range suits drivers who prefer focused displays without unnecessary visual complexity, reinforcing steady use across high-volume models.
Demand for 5–8 inch clusters also increases as automakers maintain production of vehicles designed around ergonomic simplicity. The size supports rapid information scanning and aligns with established dashboard geometries. Its compatibility with clear font rendering and basic animation allows consistent performance across daily driving environments. Automakers appreciate the reduced power draw and predictable behavior associated with these displays. As vehicle interiors balance functionality and cost-efficient design, the 5–8-inch category remains central to digital instrument cluster adoption in USA.
Demand for digital instrument clusters in the USA is rising as automakers modernize cockpit displays, shift toward software-defined vehicles and meet customer expectations shaped by smartphones and connected devices. USA buyers prefer clear visual information, customizable layouts and seamless integration with driver-assistance systems. At the same time, cost pressures, supply-chain volatility and varying state-level safety requirements influence adoption. These elements collectively determine how quickly digital clusters replace conventional analog units across American passenger and light-truck segments.
How Are USA Driving Behaviours and Vehicle-Design Shifts Influencing Cluster Adoption?
American drivers often travel long distances, rely heavily on navigation guidance and use advanced driver-assistance features, which increases demand for digital clusters capable of presenting layered information without distraction. USA automakers are redesigning cockpits to support larger displays, improved night-time readability and integration with federal safety guidelines. This shift aligns with broader interest in connected vehicles where real-time alerts and performance data must be delivered cleanly. These preferences reinforce adoption of digital instrument clusters across new USA vehicle platforms.
Where Are Growth Opportunities Emerging for Digital Instrument Clusters in USA?
Opportunities are strongest in electric vehicles, premium SUVs and mid-range models where American buyers expect richer visual interfaces. The rise of software-defined vehicle platforms in the USA supports demand for clusters that can be updated over the air, adapted for regional driving rules and aligned with brand-specific design language. Fleet operators, including rental and rideshare companies upgrading to modern vehicles, create additional demand for durable clusters that remain clear and responsive under heavy use.
What Factors Are Restricting Broader Use of Digital Instrument Clusters in USA?
Adoption faces constraints tied to hardware costs, semiconductor supply fluctuations and integration challenges with older vehicle electrical systems. Some USA consumers in value-focused segments prefer simpler displays, reducing willingness to pay for feature-rich clusters. Compliance with federal safety regulations, along with the need to minimise driver distraction, can slow rollout of highly complex layouts. These factors limit how quickly digital clusters become standard across all price tiers in the American automotive market.

| Region | CAGR (%) |
|---|---|
| West USA | 22.0% |
| South USA | 19.7% |
| Northeast USA | 17.6% |
| Midwest USA | 15.3% |
Demand for digital instrument clusters in the USA is rising across regions, with the West leading at 22.0%. Growth in this region reflects strong activity among electric vehicle producers and steady integration of digital displays across new model platforms. The South follows at 19.7%, supported by expanding automotive assembly operations and increased adoption of advanced cockpit systems. The Northeast records 17.6%, shaped by consistent demand for premium vehicles that use fully digital driver interfaces. The Midwest grows at 15.3%, influenced by its established automotive base and ongoing shift from analog clusters to software-driven displays. These trends show broad interest in digital interfaces as manufacturers enhance vehicle dashboards and improve driver information delivery across segments.
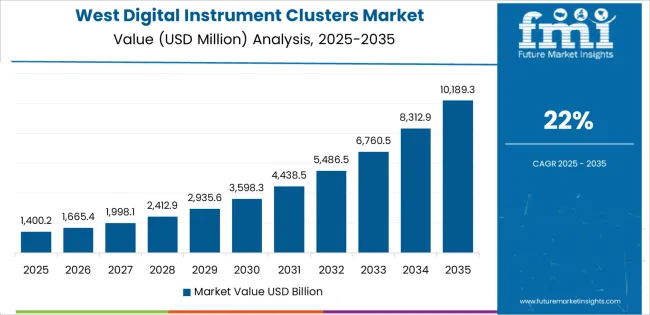
West USA is projected to grow at a CAGR of 22.0% through 2035 in demand for digital instrument clusters. California, Washington, and surrounding automotive manufacturing regions are increasingly adopting digital clusters for passenger vehicles, commercial vehicles, and electric vehicles. Rising focus on vehicle connectivity, advanced driver information systems, and display technology drives adoption. Manufacturers provide high-resolution, customizable digital instrument clusters suitable for various vehicle types. Distributors ensure availability across automotive assembly plants, component suppliers, and dealerships. Expansion in EV production, automotive electronics, and smart vehicles supports steady adoption of digital instrument clusters in West USA.
South USA is projected to grow at a CAGR of 19.7% through 2035 in demand for digital instrument clusters. Texas, Florida, and surrounding regions are increasingly adopting clusters for passenger, commercial, and electric vehicles. Rising focus on advanced driver information systems, connectivity, and vehicle electronics drives adoption. Manufacturers provide digital instrument clusters compatible with multiple vehicle platforms and display configurations. Distributors ensure accessibility across automotive assembly plants, component suppliers, and dealerships. Expansion in automotive production, EV adoption, and electronic components supports steady adoption of digital instrument clusters across South USA.
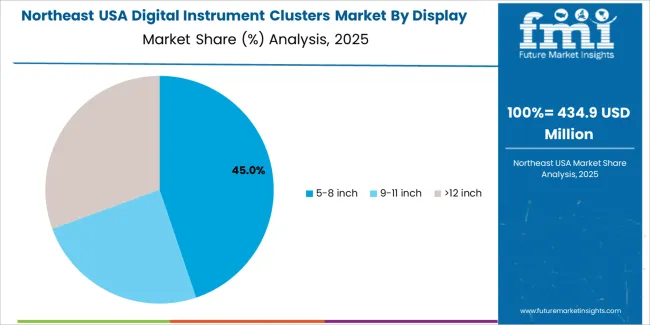
Northeast USA is projected to grow at a CAGR of 17.6% through 2035 in demand for digital instrument clusters. New York, Pennsylvania, and surrounding regions are gradually adopting clusters for electric vehicles, passenger cars, and commercial vehicles. Rising demand for high-resolution displays, connected vehicle technology, and driver assistance information drives adoption. Manufacturers provide digital instrument clusters suitable for multiple vehicle types and configurations. Distributors ensure accessibility across assembly plants, suppliers, and automotive dealerships. Expansion in EV production, connected vehicles, and automotive electronics supports steady adoption of digital instrument clusters across Northeast USA.
Midwest USA is projected to grow at a CAGR of 15.3% through 2035 in demand for digital instrument clusters. Illinois, Ohio, and surrounding regions are gradually adopting digital clusters for passenger, commercial, and electric vehicles. Rising focus on driver information systems, vehicle connectivity, and display performance drives adoption. Manufacturers supply high-resolution and customizable clusters compatible with multiple vehicle types. Distributors ensure accessibility across automotive assembly plants, suppliers, and dealerships. Growth in EV production, automotive electronics, and connected vehicle technologies supports steady adoption of digital instrument clusters across Midwest USA.

Demand for digital instrument clusters in USA is increasing as automakers integrate richer driver information, advanced safety features and modern cockpit layouts. Consumers expect displays that present navigation, vehicle status and driver-assist alerts with clear graphics and customizable layouts. As electric vehicles expand, clusters gain importance because they communicate range, energy usage and system diagnostics in real time. Manufacturers also rely on digital clusters to unify cockpit design across trim levels and simplify software-driven updates. Growth in connected-vehicle platforms further supports adoption, allowing data from sensors and infotainment systems to appear on a single visual interface. These expectations push automakers and suppliers to prioritize reliability, clarity and seamless integration as clusters become a core part of the driving experience in the United States.
Key players shaping USA’s digital-instrument-cluster landscape include a mix of global automakers, domestic brands and specialized electronics suppliers. Audi AG and BMW AG influence cluster design through high-resolution, configurable displays in premium vehicles. Ford Motor Company drives large-scale adoption across mainstream models, aligning hardware with USA customer needs. Continental supplies embedded electronics, graphics controllers and modular cluster platforms for multiple manufacturers. Dakota Digital serves niche and aftermarket segments by offering customizable clusters for performance and restoration markets. This blend of premium, mass-market and specialty participants reflects the structure of the USA automotive ecosystem, where digital clusters must balance brand identity, regulatory requirements and user expectations across diverse vehicle categories.
| Items | Values |
|---|---|
| Quantitative Units (2025) | USD billion |
| Display Type | LCD, TFT-LCD, OLED |
| Display Size | 5–8 inch, 9–11 inch, 12 inch |
| Application | Smartphones, Tablet PC/Desktop/Notebook, Automobile, Others |
| Region | Northeast, West, Midwest, South |
| Countries Covered | USA |
| Key Companies Profiled | Audi AG, BMW AG, Continental, Dakota Digital, Ford Motor Company |
| Additional Attributes | Dollar by sales by display type, size, and application; regional CAGR and adoption trends; contribution of automotive vs. non-automotive applications; early adoption vs. mainstream penetration; impact of electric vehicles, ADAS and software-defined vehicle platforms; growth of retrofit and aftermarket channels; integration with infotainment and cloud-based vehicle systems; display resolution and multifunction interface trends; supplier service support, customization and OEM partnerships; semiconductor supply influence and cost considerations. |
The demand for digital instrument clusters in usa is estimated to be valued at USD 2.0 billion in 2025.
The market size for the digital instrument clusters in usa is projected to reach USD 11.4 billion by 2035.
The demand for digital instrument clusters in usa is expected to grow at a 19.1% CAGR between 2025 and 2035.
The key product types in digital instrument clusters in usa are lcd, tft-lcd and oled.
In terms of display size, 5-8 inch segment is expected to command 44.6% share in the digital instrument clusters in usa in 2025.


Our Research Products

The "Full Research Suite" delivers actionable market intel, deep dives on markets or technologies, so clients act faster, cut risk, and unlock growth.

The Leaderboard benchmarks and ranks top vendors, classifying them as Established Leaders, Leading Challengers, or Disruptors & Challengers.

Locates where complements amplify value and substitutes erode it, forecasting net impact by horizon

We deliver granular, decision-grade intel: market sizing, 5-year forecasts, pricing, adoption, usage, revenue, and operational KPIs—plus competitor tracking, regulation, and value chains—across 60 countries broadly.

Spot the shifts before they hit your P&L. We track inflection points, adoption curves, pricing moves, and ecosystem plays to show where demand is heading, why it is changing, and what to do next across high-growth markets and disruptive tech

Real-time reads of user behavior. We track shifting priorities, perceptions of today’s and next-gen services, and provider experience, then pace how fast tech moves from trial to adoption, blending buyer, consumer, and channel inputs with social signals (#WhySwitch, #UX).

Partner with our analyst team to build a custom report designed around your business priorities. From analysing market trends to assessing competitors or crafting bespoke datasets, we tailor insights to your needs.
Supplier Intelligence
Discovery & Profiling
Capacity & Footprint
Performance & Risk
Compliance & Governance
Commercial Readiness
Who Supplies Whom
Scorecards & Shortlists
Playbooks & Docs
Category Intelligence
Definition & Scope
Demand & Use Cases
Cost Drivers
Market Structure
Supply Chain Map
Trade & Policy
Operating Norms
Deliverables
Buyer Intelligence
Account Basics
Spend & Scope
Procurement Model
Vendor Requirements
Terms & Policies
Entry Strategy
Pain Points & Triggers
Outputs
Pricing Analysis
Benchmarks
Trends
Should-Cost
Indexation
Landed Cost
Commercial Terms
Deliverables
Brand Analysis
Positioning & Value Prop
Share & Presence
Customer Evidence
Go-to-Market
Digital & Reputation
Compliance & Trust
KPIs & Gaps
Outputs
Full Research Suite comprises of:
Market outlook & trends analysis
Interviews & case studies
Strategic recommendations
Vendor profiles & capabilities analysis
5-year forecasts
8 regions and 60+ country-level data splits
Market segment data splits
12 months of continuous data updates
DELIVERED AS:
PDF EXCEL ONLINE
Digital Instrument Clusters Market Growth - Trends & Forecast 2025 to 2035
Demand for Digital Instrument Clusters in Japan Size and Share Forecast Outlook 2025 to 2035
USA Digital Illustration App Market Insights – Growth & Demand 2025-2035
USA Digital Commerce Market Growth – Innovations, Trends & Forecast 2025-2035
USA Digital Textile Printing Market Trends – Growth, Demand & Forecast 2025-2035
Digital Writing Instruments Market Size and Share Forecast Outlook 2025 to 2035
Reusable Laparoscopic Instruments Market is segmented by Reusable Laparoscopic Scissors and Reusable Hand Instruments from 2025 to 2035
Demand for Digital Power Conversion in USA Size and Share Forecast Outlook 2025 to 2035
Digital Hall Effect Gaussmeter Market Size and Share Forecast Outlook 2025 to 2035
Digital Group Dining Service Market Size and Share Forecast Outlook 2025 to 2035
Digital Pathology Displays Market Size and Share Forecast Outlook 2025 to 2035
Digital Rights Management Market Size and Share Forecast Outlook 2025 to 2035
Digital Liquid Filling Systems Market Size and Share Forecast Outlook 2025 to 2035
Digital Transformation Industry Analysis in MENA Size and Share Forecast Outlook 2025 to 2035
Instruments for Peptide Drug Synthesis Market Size and Share Forecast Outlook 2025 to 2035
Digital X-Ray Equipment Market Size and Share Forecast Outlook 2025 to 2035
Digital Marketing Analytics Industry Analysis in Latin America Forecast Outlook 2025 to 2035
Digital Health Market Forecast and Outlook 2025 to 2035
Digital Pen Market Forecast and Outlook 2025 to 2035
Digital X-ray Market Size and Share Forecast Outlook 2025 to 2035

Thank you!
You will receive an email from our Business Development Manager. Please be sure to check your SPAM/JUNK folder too.
Chat With
MaRIA