

- Market Size (2026)
- USD 784.1 Mn
- Forecast (2036)
- USD 1631.2 Mn
- CAGR (2026 to 2036)
- 7.6%
Axle and Differential Oil Cooling Systems Market Size, Forecast, and Outlook By FMI
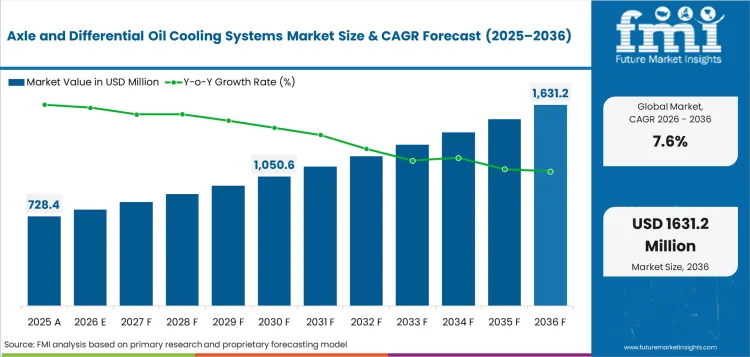
The axle and differential oil cooling systems market size stood at USD 728.4 million in 2025 and is projected to cross USD 784.1 million in 2026. Industry revenue is forecast to rise to USD 1,631.2 million by 2036 at 7.6% CAGR.
Summary of the Axle and Differential Oil Cooling Systems Market
- Demand and Growth Drivers
- Electric axles raise oil temperature control needs as motors and bearings operate inside tighter drive housings.
- Heavy towing and off-road duty cycles increase rear differential oil temperature during long climbs and repeated load cycles.
- OEM validation favors packaged oil circuits protecting bearings and gears during warranty periods.
- Product and Segment View
- OEM integration is projected to account for 68.3% share in 2026 as cooling circuits are specified during axle design.
- Active circuits are anticipated to capture 57.2% share in 2026, influenced by electric pumps improving oil flow control.
- Oil coolers are forecast to hold 38.4% share in 2026 due to heat rejection remaining the visible hardware cost center.
- Geography and Competitive Outlook
- China is projected to record 9.3% CAGR by 2036 as electric axle output and high-volume NEV platforms expand.
- India is expected to expand at 8.7% CAGR by 2036 through vehicle output and e-truck policy support.
- Dana and ZF define one side of competition. MAHLE and Modine add thermal module depth across EV applications.
- Analyst Opinion
- Nikhil Kaitwade, Principal Consultant for Industrial Automation at FMI, observes, “Axle oil cooling is becoming a design choice before turning into a service issue. I expect OEMs to favor suppliers able to prove oil flow and thermal recovery inside one validated driveline package. Profit will move beyond a single cooler. Value will move toward suppliers able to connect the electric vehicle e-axle with pumps and oil circuit testing across towing and high-load programs.”
- Axle and Differential Oil Cooling Systems Market Value Analysis
- Axle oil cooling value is shifting from standalone heat exchangers toward validated driveline protection packages tied to wider thermal management.
- Manufacturer spending is tied to warranty exposure as overheated gear oil can damage bearings and seals.
- Active oil circuits improve control in electric axles as reducers and motors share tight package space.
- Demand is supported by performance SUVs and commercial vehicles needing oil temperature stability under load.
Key Takeaways, Market Size, and Forecast
- The axle and differential oil cooling systems market size was valued at USD 728.4 million in 2025.
- The axle and differential oil cooling systems industry value is expected to cross USD 1,631.2 million by 2036.
- From 2026 to 2036, the sector is anticipated to expand at 7.6% CAGR.
- Industry revenue is forecast to create an incremental opportunity of USD 847.1 million from 2026 to 2036.
- OEM integration is set to represent 68.3% share of sales channel value in 2026.
- Active circuits are poised to secure 57.2% share of cooling architecture value in 2026.
- Among key countries, China is projected to record the stronger pace at 9.3% CAGR by 2036. India follows at 8.7% CAGR as local vehicle output and e-truck support improve fitment potential.
Managing oil inside compact axle housings is becoming a key requirement for axle and differential oil cooling systems. In October 2025, AISIN stated its Toyota bZ4X eAxle improved transmission efficiency by enhancing gear precision and reducing oil agitation through casing shape optimization. Its front eAxle reaches 167 kW and rear wheel drive output reaches 88 kW. OEM sourcing will favor compact cooling layouts as drive units need lower oil drag and stable heat control in tighter packaging. These ratings show how axle cooling is moving from a support part into early drive unit design work. In April 2024, SAE Technical Paper 2024-01-2588 described a 1D electric axle heat transfer model using oil temperature and heat flux data. Such modeling gives suppliers a stronger case for validated oil passages and pump integrated axle packages.
Axle and Differential Oil Cooling Systems Market Definition
Axle and differential oil cooling systems are finished assemblies used to control lubricant temperature in axle housings, differential carriers and electric drive units. Scope covers oil coolers and electric pumps. Hose assemblies, thermostatic valves and sensors are included if sold as finished circuit parts. Revenue includes factory-installed systems and service parts used in automotive differential and related driveline systems. Scope covers oil routing around differential housing and carrier components if the circuit is designed to remove lubricant heat. Engine oil coolers and transmission coolers are excluded unless sold as part of an axle or differential oil circuit.
Axle and Differential Oil Cooling Systems Market Inclusions
Scope includes cooling systems used in conventional axles and e-axles. AWD systems and performance differentials are covered. Oil-to-air coolers and oil-to-coolant exchangers are included. Electric oil pumps, valves and sensors are included if sold for axle or differential oil temperature control. OEM supply and service replacement sales are included for passenger vehicles, commercial vehicles and off-highway equipment.
Axle and Differential Oil Cooling Systems Market Exclusions
Scope excludes engine-only oil coolers and battery-only coolant plates. Cabin HVAC parts are outside scope. General automotive engine oil coolers are outside scope unless tied to axle or differential circuits. Loose lubricants and additives are excluded even if sold for gear oil service. General hoses are excluded unless designed for axle oil, differential oil or e-drive lubrication circuits.
Axle and Differential Oil Cooling Systems Market Research Methodology
- Primary Research: FMI analysts reviewed axle cooling needs with drivetrain suppliers and vehicle thermal engineers. Service-channel feedback covered failure modes and replacement timing.
- Desk Research: Official EV sales data and vehicle production data supported demand checks. Company releases supported supplier mapping and technology timing.
- Market Sizing and Forecasting: Forecast values used vehicle output, axle fitment assumptions and average system pricing. Segment shares were tested against drivetrain platform mix.
- Data Validation: Checks compared 2026 value with 2036 value. Country CAGR values were reviewed against EV production, towing exposure and off-highway activity.
Why is the Axle and Differential Oil Cooling Systems Market Growing?
- E-axle heat density is raising demand for active oil circuits in compact drive units.
- Towing-rated SUVs and pickups are creating recurring need for differential oil temperature control.
- Off-highway electrification is adding cooler demand for axles working under long duty cycles.
Market expansion is influenced by heat control needs at the rear axle and inside electric drive housings. OICA reported that in April 2026 global vehicle production rose to 96.4 million units in 2025. Higher vehicle output increases possible fitment points for automotive axles with dedicated oil circuits. Electric drive adoption changes the role of lubricant from friction reduction to temperature control. Suppliers gain value by proving stable oil flow at high torque and low vehicle speed.
Performance and commercial vehicles further drive industry growth. Differential oil can run hot during towing and repeated off-road use. Manufacturers do not want a cooler that fixes one heat spike and adds routing risk elsewhere. Oil linesand connectors need package validation as one circuit. Suppliers that can link commercial vehicle transmission oil hose systems experience with axle oil handling are better placed for heavy-duty programs.
Market Segmentation Analysis
- Oil coolers are projected to capture 38.4% share in 2026, driven by heat exchangers carrying the core thermal load in rear axle and e-drive oil circuits.
- Active circuits are anticipated to hold 57.2% share in 2026, led by electric pumps moving oil during low-speed towing and steep-grade operation.
- Passenger vehicles are forecast to account for 41.6% share in 2026 due to AWD SUVs and performance trims using factory cooling options.
- Electric axles are projected to represent 46.8% share in 2026 since reducers and motors create heat inside compact drive units.
- OEM integration is anticipated to account for 68.3% share in 2026 as validated cooling layouts are chosen before vehicle launch.
- Gear oil is forecast to hold 54.7% share in 2026 with conventional differentials and e-axle reducers relying on lubricant heat removal.
Market segmentation is divided into six parent groups based on system design and buying route. Component Type separates coolers from pumps and flow parts. Cooling Architecture explains passive and active oil movement. Vehicle Type reflects passenger, commercial and off-highway needs. Drivetrain Platform separates conventional axle use from e-axle cooling and lubrication system components. Sales Channel shows factory programs and service paths. Cooling Medium explains how gear oil and water-glycol circuits carry heat.
Insights into Axle and Differential Oil Cooling Systems Market by Component Type
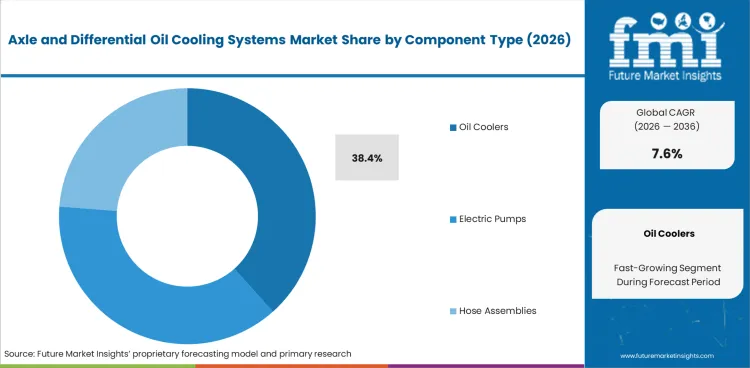
- Oil coolers are projected to account for 38.4% share in 2026 through finned and oil-to-coolant units forming the main heat rejection hardware in axle oil circuits.
- Electric pumps gain attention in e-axle layouts since controlled flow can protect bearings during launch and low-speed operation without depending on vehicle speed.
Insights into Axle and Differential Oil Cooling Systems Market by Cooling Architecture
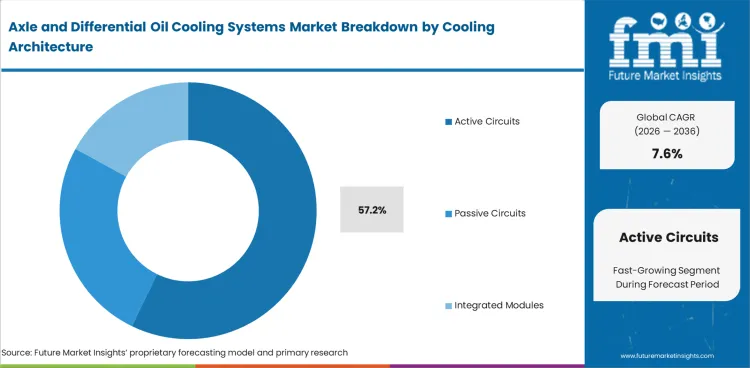
- Active circuits are anticipated to account for 57.2% share in 2026, led by electric pumps and sensors making oil movement less dependent on shaft speed and vehicle movement.
- Passive circuits retain value in simpler differentials since lower part count can suit service parts and cost-sensitive vehicles with lighter thermal duty.
Insights into Axle and Differential Oil Cooling Systems Market by Vehicle Type
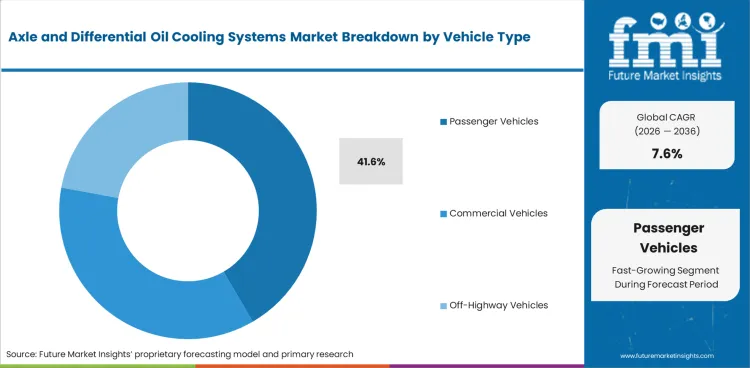
- Passenger vehicles are forecast to account for 41.6% share in 2026 with AWD SUVs and premium EVs creating broad fitment volume.
- Off-highway vehicles create a stricter validation need since mining and construction equipment often runs at high torque with limited airflow around axles.
Insights into Axle and Differential Oil Cooling Systems Market by Drivetrain Platform
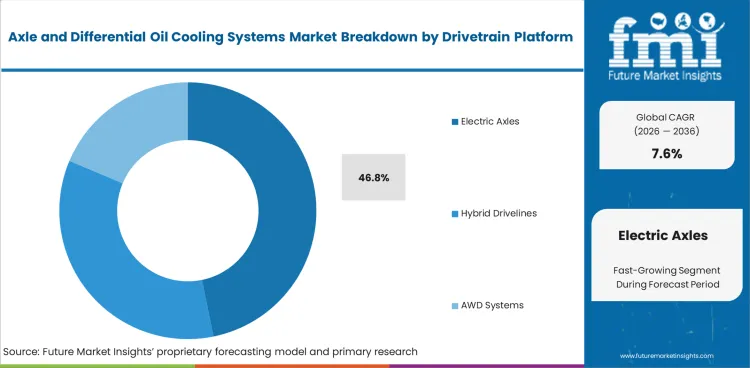
- Electric axles are projected to hold 46.8% share in 2026 since compact reducer housings need oil flow to manage gear and motor-adjacent heat.
- Conventional axles continue to need limited-slip differential couplings and cooling options in towing trims facing repeated oil temperature spikes.
Insights into Axle and Differential Oil Cooling Systems Market by Sales Channel
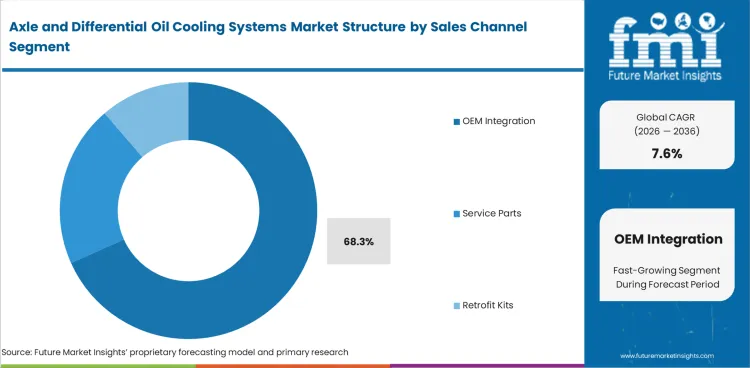
- OEM integration is anticipated to represent 68.3% share in 2026 as cooler location, hose routing and pump controls are fixed during vehicle development.
- Service parts hold a steady role as workshops replace oil lines and coolers after debris damage, seal wear or towing-related thermal stress.
Insights into Axle and Differential Oil Cooling Systems Market by Cooling Medium
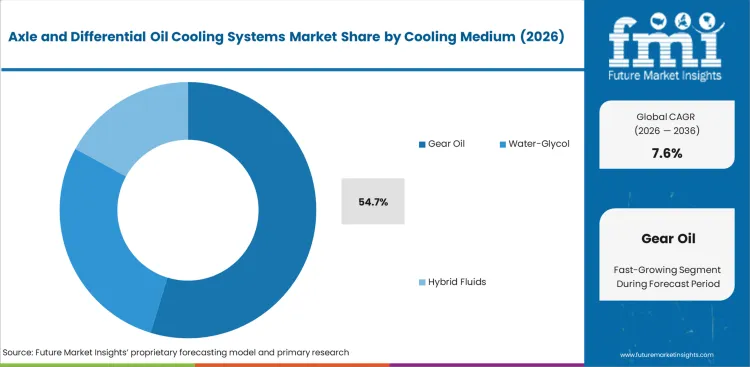
- Gear oil is forecast to hold 54.7% share in 2026, influenced by axle housings and e-drive reducers using lubricant as both friction medium and heat carrier.
- Water-glycol circuits gain relevance as integrated e-drive modules connect oil-to-coolant exchangers with cooling management systems already used in EV platforms.
Axle and Differential Oil Cooling Systems Market Drivers, Restraints and Opportunities
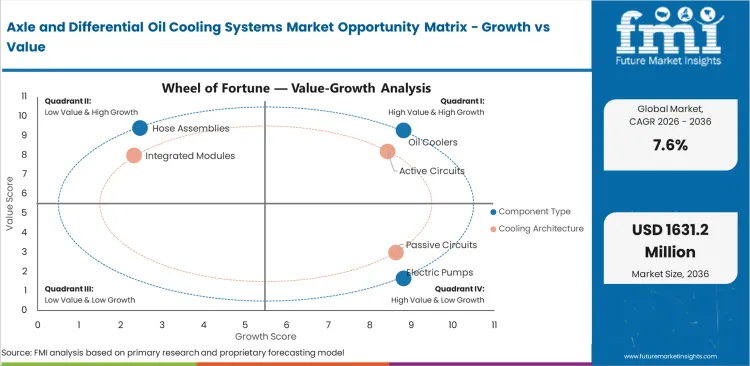
- E-axle power density is supporting active oil circuits protecting reducers and bearings.
- Validation cost is expected to restrain smaller suppliers with limited thermal test capacity.
- Service kits create opportunities as fleets seek faster replacement for lines, pumps and coolers.
One of the significant growth drivers in the industry is axle heat risk and warranty cost as electric-drive suppliers reduce unused thermal reserve. In July 2025, ZF stated TempAI improved electric-drive temperature forecast accuracy by over 15.0% through software with no added hardware. Better temperature prediction gives OEMs a clearer way to size cooling margins around motors, gearsets and oil circuits. Axle and differential oil cooling suppliers can apply similar sensor-ready design thinking as sourcing moves toward validated heat control. Packaging will remain a restraint since oil coolers need airflow or coolant access near suspension and chassis parts. Poor hose routing can raise leakage risk and weaken the value of added cooling. Opportunity is likely to concentrate in compact modules combining coolers and controlled oil passages.
Import Dependence and Trade Flow Analysis
Driveline cooling outlook is likely to depend on regional sourcing risk as e-axle and chassis content becomes harder to classify across trade rules. In July 2025, the United States International Trade Commission stated its USMCA automotive rules report identified e-axles as a component area creating tariff classification or tariff treatment differences. The United States International Trade Commission also stated those rules reduced USA light vehicle imports from Canada and Mexico while raising imports from non-USMCA countries. USA automotive manufacturing investment rose from USD 27.9 billion in 2019 to USD 87.8 billion in 2023 before falling to USD 34.1 billion in 2024. OEMs sourcing axle oil coolers and hose assemblies are likely to favor local validation and dual sourcing to reduce exposure to cross-border rule changes.
Equipment Price Benchmarking Analysis
Motion hardware pricing is expected to affect system cost for active axle oil cooling as pumps, power transmission parts and industrial handling components carry higher input costs. USA Bureau of Labor Statistics data show mechanical power transmission equipment rose from a 376.157 annual average index in 2024 to 400.656 in 2025. General purpose machinery and equipment rose from 340.034 to 358.370 during the same period. Industrial material handling equipment increased from 308.058 to 323.836 in 2025. Axle cooling suppliers will need tighter price benchmarking across motorized pumps and controlled oil-flow assemblies as OEMs compare active cooling value against passive cooler cost.
Analysis of Axle and Differential Oil Cooling Systems Market by Key Countries
.webp "Top Country Growth Comparison Axle And Differential Oil Cooling Systems Market Cagr (2026 2036)")
| Country | CAGR |
|---|---|
| China | 9.3% |
| India | 8.7% |
| United States | 7.9% |
| Germany | 7.4% |
| Australia | 6.8% |
| United Kingdom | 6.4% |
| Japan | 5.9% |
Source: Future Market Insights, 2026.
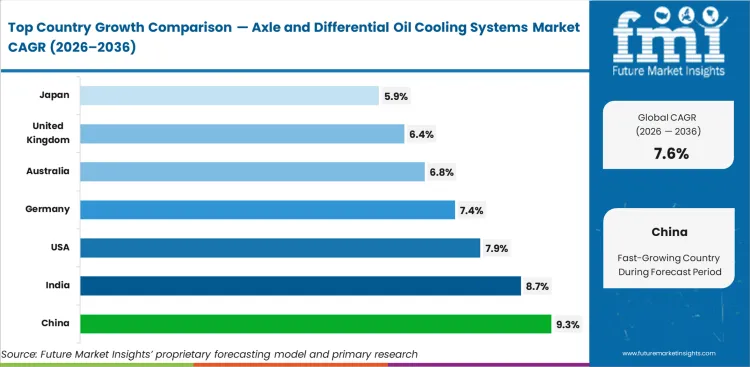
Axle and Differential Oil Cooling Systems Market CAGR Analysis by Country
- China is poised to record 9.3% CAGR by 2036, driven by NEV output and e-axle production creating high-volume fitment points.
- India is expected to expand at 8.7% CAGR by 2036 due to local vehicle output and e-truck policy support raising system implementation.
- USA is forecast to grow at 7.9% CAGR by 2036 through towing-oriented SUVs and commercial EV programs.
- Germany is expected to advance at 7.4% CAGR by 2036 with EV engineering depth and premium drivetrain content.
- Australia is projected to rise at 6.8% CAGR by 2036 as mining and towing conditions create harsh axle duty cycles.
- United Kingdom is forecast at 6.4% CAGR by 2036, influenced by EV rules and premium vehicle output supporting cooling specification.
- Japan is anticipated to post 5.9% CAGR by 2036 since established vehicle platforms use selective cooling in hybrid and AWD systems.
Country performance differs by EV manufacturing scale, load duty and vehicle mix. China and India track above the global average as production volume and electrification policy raise fitment potential. The United States stays above the global average since trucks and towing vehicles create heat-control demand. Germany and Australia grow at measured rates as demand follows premium platforms and harsh-duty vehicles. The United Kingdom and Japan follow selective heat exchanger specification.
Demand Outlook for Axle and Differential Oil Cooling Systems in China
Demand in China is projected to record 9.3% CAGR by 2036, influenced by electric axle programs expanding across high-volume NEV platforms. China produced 34.5 million vehicles in 2025 and NEV production reached 16.6 million units according to OICA. Such output scale gives axle oil circuit suppliers a broader path into front and rear electric drive programs. Local sourcing will prove important as OEMs shorten validation cycles and push thermal packages into earlier platform design.
- NEV scale supports oil coolers and electric pumps in compact front and rear drive units.
- CAAM-linked production visibility gives suppliers a clearer signal on e-drive component planning.
- High charger buildout raises long-trip EV use and increases attention on driveline heat durability.
Sales Analysis of Axle and Differential Oil Cooling Systems in India
Sales in India are expected to expand at 8.7% CAGR by 2036, led by vehicle output and e-commercial policy support raising local component need. India’s heavy industries ministry recorded passenger vehicle production at 5.4 million units in calendar 2025. Two-wheeler production does not directly drive axle cooling demand, as broader component localization supports supplier scale. PM E-DRIVE funding for e-trucks creates a clearer path for heavy electric axle cooling trials.
- PM E-DRIVE e-truck coverage supports early oil cooling fitment in heavier N2 and N3 vehicle classes.
- Local driveline suppliers can gain from shorter lead times for coolers and oil hose assemblies.
- Commercial vehicle programs need durable pumps as hot weather and high payload raise oil temperature exposure.
Demand Analysis of Axle and Differential Oil Cooling Systems in the United States
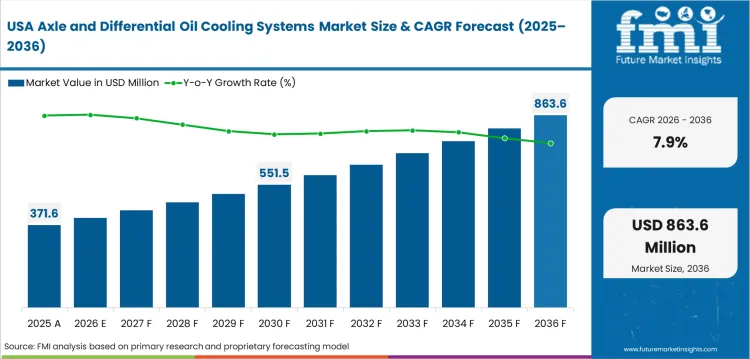
Industry in the United States is forecast to grow at 7.9% CAGR by 2036 through towing vehicles and electric pickup programs. Argonne National Laboratory data placed USA plug-in vehicle sales above 1.5 million units in 2024. Pickup and SUV platforms create a different cooling need from compact passenger cars. Rear axle oil temperature can rise under trailer load, steep grades and repeated acceleration. Suppliers with validated automotive heat exchanger capability can support OEM durability targets.
- Light truck towing packages influence demand for differential coolers built around sustained heat rejection.
- EPA model-year rules keep efficiency pressure on driveline and thermal system design work.
- Electric pickup programs need oil routing protecting reducers during launch torque and hill climbs.
Opportunity Analysis of Axle and Differential Oil Cooling Systems in Germany
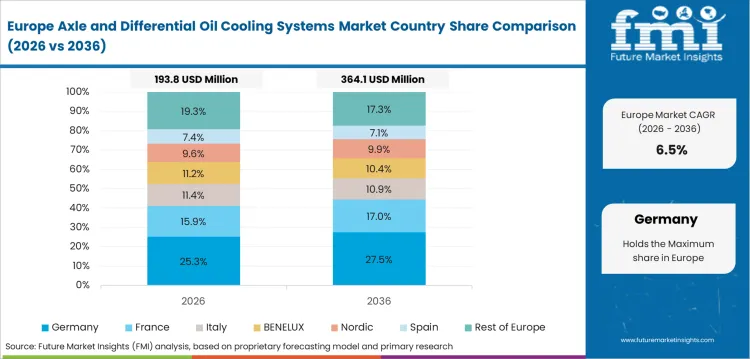
Sector in Germany is expected to advance at 7.4% CAGR by 2036, reflecting premium EV and driveline engineering depth. VDA said Germany produced almost 1.56 million electric cars in the first eleven months of 2025. High-performance platforms create stronger need for oil temperature control inside compact drive units. Germany-based sourcing groups often ask for material and endurance evidence before approving axle thermal parts.
- Premium electric platforms use compact drive modules favoring active oil flow over simple passive cooling.
- VDA production visibility supports component planning for motors and integrated thermal modules.
- Autobahn duty cycles make thermal reserve important for sustained power and drivetrain warranty control.
Future Outlook for Axle and Differential Oil Cooling Systems in Australia
The market in Australia is projected to rise at 6.8% CAGR by 2036 as mining and towing create harsher axle duty. Off-road use extends the same need. Australian Bureau of Statistics reported equipment, plant and machinery capital spending of AUD 23.6 billion in the September quarter of 2025. High equipment spending supports service demand for coolers and oil lines in heavy vehicles. Suppliers gain attention through rugged designs suited to dust, heat and remote repair conditions.
- Mining equipment in Western Australia creates high-load axle duty under heat and abrasive dust.
- Towing use across regional highways favors coolers protecting rear differentials during long hauls.
- Remote service conditions make field-ready hoses and pump kits more useful than custom one-off parts.
Growth Outlook for Axle and Differential Oil Cooling Systems in the United Kingdom
Demand in the United Kingdom is forecast at 6.4% CAGR by 2036 since EV rules and premium vehicle output support targeted cooling demand. SMMT reported 717,371 cars and 47,344 commercial vehicles built in the UK in 2025. ZEV mandate targets keep thermal packaging important for electric and hybrid vehicle programs. Premium SUVs and performance vehicles give axle oil cooling suppliers a smaller but valuable sourcing pool.
- ZEV mandate targets support EV thermal validation across cars and vans sold in Great Britain.
- Premium SUV production creates rear driveline heat-control needs under towing and high-speed use.
- UK component providers can serve service kits for oil lines and electric pumps through specialist channels.
In-depth Analysis of Axle and Differential Oil Cooling Systems in Japan
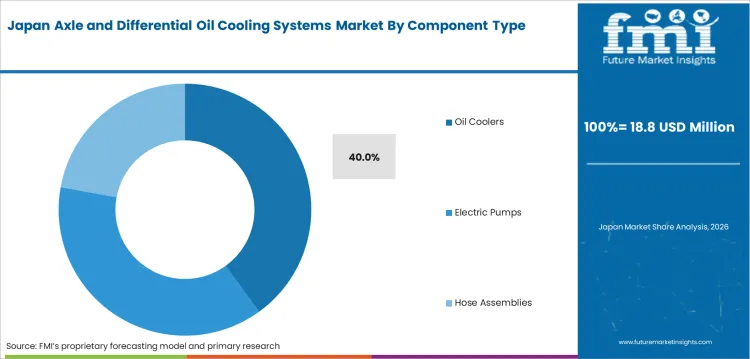
Sector in Japan is expected to post 5.9% CAGR by 2036 with hybrid and quality-focused platforms keeping selective cooling demand active. OICA reported Japan produced 8.4 million vehicles in 2025. Hybrid-heavy vehicle planning can keep conventional axles significant alongside electric drive units. OEMs are expected to favor compact and durable cooling parts fitting long warranty expectations and conservative platform change cycles.
- Hybrid and AWD vehicle lines need compact oil circuits fitting tight underbody space.
- Japan’s production scale supports selective OEM demand for quiet pumps and durable oil coolers.
- Service parts require stable quality as owners often keep vehicles through long operating cycles.
Competitive Landscape and Strategic Positioning
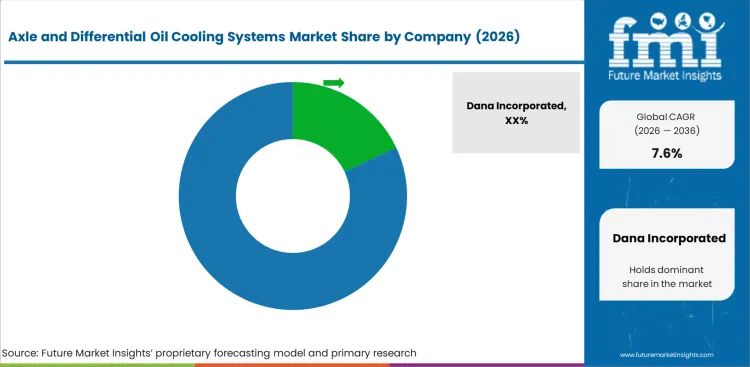
- Driveline integrators have an advantage led by axle housing knowledge and OEM program history helping to secure early design positions.
- Thermal module specialists gain attention through cooler design and valve integration with electric pump control capability.
- Service and retrofit suppliers gain value as towing and off-road fleets need fast replacement kits for damaged cooling parts.
Competition in axle and differential oil cooling systems is shaped by who can fit reliable oil cooling inside tight driveline spaces. Dana and ZF carry strength based on axle and e-drive program access. Dauch Corporation was formerly American Axle & Manufacturing. It adds rear drive unit and e-Beam know-how. Schaeffler supports aftermarket work through e-axle repair tools and oil-cooled motor work. Automakers often favor suppliers able to connect coolers with pumps and validation evidence before vehicle launch.
Competitive advantage is higher near gears and bearings due to heat control affecting warranty risk and long-term vehicle performance. MAHLE and Modine bring stronger heat exchanger design depth. Setrab adds specialist oil cooler experience across performance and motorsport use. Valeo and BorgWarner stay relevant through electric drive and thermal control capability. Global suppliers are positioned to win factory programs through proven system validation. Regional specialists can hold service demand through stock depth and application knowledge.
Key Companies in the Axle and Differential Oil Cooling Systems Market
Competitive structure is better understood by companies grouped around driveline platforms, thermal modules and service coverage.
- Driveline Platform Leaders: Dana Incorporated and ZF Friedrichshafen AG provide axle and e-drive systems. Dauch Corporation adds driveline systems linked to oil cooling needs.
- Thermal Module Specialists: MAHLE GmbH and Modine Manufacturing Company support heat exchangers and coolant routing. Setrab AB adds oil cooler design depth.
- Application and Service Players: Schaeffler AG and Valeo add e-drive and repair capabilities. BorgWarner Inc. and Linamar Corporation add electric drive and driveline depth.
Competitive Benchmarking: Axle and Differential Oil Cooling Systems Market
| Company | Axle Oil Circuit Depth | E-Axle Thermal Integration | High-Load Validation Coverage | Geographic Footprint |
|---|---|---|---|---|
| Dana Incorporated | Strong | Medium | Strong | Global off-highway and light vehicle |
| ZF Friedrichshafen AG | Strong | Strong | Strong | Global e-mobility and driveline |
| MAHLE GmbH | Medium | Strong | Medium | Global thermal systems |
| Modine Manufacturing Company | Medium | Strong | Medium | Commercial EV thermal systems |
| Setrab AB | Strong | Medium | Medium | Performance and specialist oil cooling |
| Schaeffler AG | Medium | Strong | Strong | Global e-drive and repair systems |
| Dauch Corporation | Strong | Medium | Medium | North America and global driveline |
| Valeo | Medium | Strong | Medium | Global electric drive systems |
| BorgWarner Inc. | Medium | Strong | Medium | Global propulsion systems |
| Linamar Corporation | Medium | Medium | Medium | North America and Europe driveline |
Source: Future Market Insights competitive analysis 2026. Ratings reflect relative positioning based on axle oil circuit depth and e-axle thermal integration.
Key Developments in Axle and Differential Oil Cooling Systems Market
- In October 2024, Valeo and MAHLE signed a joint development agreement for a magnet-free electric axle systems rated from 220.0 kW to 350.0 kW.
- In November 2024, ZF opened its Shenyang e-mobility plant for electric axle drives used in new energy vehicles.
- In April 2025, Schaeffler presented oil-cooled heavy-duty e-motors with outputs up to 315.0 kW.
Key Players in the Axle and Differential Oil Cooling Systems Market
Major Driveline Platform Leaders:
- Dana Incorporated
- ZF Friedrichshafen AG
- Dauch Corporation
- Schaeffler AG
- Linamar Corporation
Thermal Module Specialists:
- MAHLE GmbH
- Modine Manufacturing Company
- Setrab AB
- Valeo
- BorgWarner Inc.
Market Report Scope
| Parameter | Details |
|---|---|
| Quantitative units | USD 784.1 million to USD 1,631.2 million at 7.6% CAGR |
| Market definition | Finished axle and differential oil cooling systems used to control lubricant temperature in driveline housings |
| Component type | Oil coolers, electric pumps, hose assemblies, thermostatic valves, sensors |
| Cooling architecture | Active circuits, passive circuits, integrated modules |
| Vehicle type | Passenger vehicles, commercial vehicles, off-highway vehicles, performance vehicles |
| Drivetrain platform | Conventional axles, electric axles, hybrid drivelines, AWD systems |
| Sales channel | OEM integration, service parts, retrofit kits |
| Cooling medium | Gear oil, water-glycol, hybrid fluids |
| Regions covered | North America, Latin America, Western Europe, Eastern Europe, East Asia, South Asia and Pacific, Middle East and Africa |
| Countries covered | USA, China, India, Germany, Australia, United Kingdom, Japan and 30+ countries |
| Key companies profiled | Dana Incorporated, ZF Friedrichshafen AG, MAHLE GmbH, Modine Manufacturing Company, Setrab AB, Schaeffler AG, Dauch Corporation, Valeo, BorgWarner Inc., Linamar Corporation |
| Forecast period | 2026 to 2036 |
| Approach | Vehicle production checks, EV platform review, supplier evidence and segment share estimates |
Source: Future Market Insights, 2026.
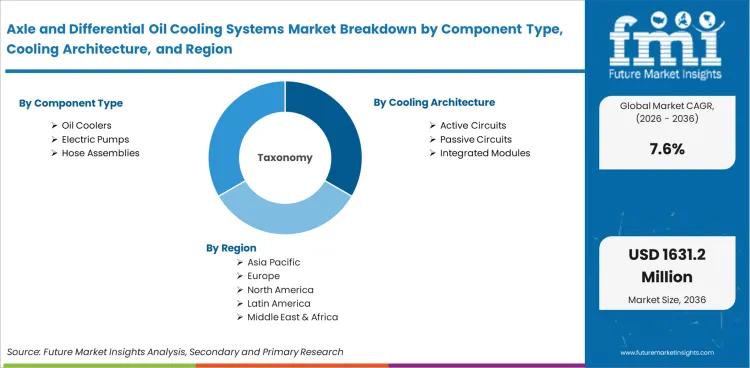
Axle and Differential Oil Cooling Systems Market Breakdown by Component Type, Cooling Architecture, Vehicle Type, Drivetrain Platform, Sales Channel, Cooling Medium, and Region.
By Component Type:
- Oil Coolers
- Electric Pumps
- Hose Assemblies
- Thermostatic Valves
- Sensors
By Cooling Architecture:
- Active Circuits
- Passive Circuits
- Integrated Modules
By Vehicle Type:
- Passenger Vehicles
- Commercial Vehicles
- Off-Highway Vehicles
- Performance Vehicles
By Drivetrain Platform:
- Conventional Axles
- Electric Axles
- Hybrid Drivelines
- AWD Systems
By Sales Channel:
- OEM Integration
- Service Parts
- Retrofit Kits
By Cooling Medium:
- Gear Oil
- Water-Glycol
- Hybrid Fluids
By Region:
- North America
- United States
- Canada
- Latin America
- Brazil
- Mexico
- Western Europe
- Germany
- United Kingdom
- France
- Italy
- Spain
- Eastern Europe
- Poland
- Czech Republic
- East Asia
- China
- Japan
- South Korea
- South Asia and Pacific
- India
- Australia
- ASEAN
- Middle East and Africa
- GCC
- South Africa
Research Sources and Bibliography
- Argonne National Laboratory. (2025). Light duty electric drive vehicles monthly sales updates.
- BluE Nexus Corporation, AISIN Corporation, & DENSO Corporation. (2025, October 10). Newly developed eAxle adopted for TOYOTA’s new “bZ4X”. AISIN Corporation Global Website.
- Hu, X., Shao, H., Hou, Y., Sun, W., Liu, H., & Zhang, L. (2024, April 9). A methodology for modeling the thermal behavior of an electric axle in real driving cycles (SAE Technical Paper No. 2024-01-2588). SAE International.
- United States International Trade Commission. (2025, July 1). USITC releases second report on the economic impact and operation of the USMCA automotive rules of origin.
- USA Bureau of Labor Statistics. (2026). Producer Price Index: Selected commodities and special commodities. USA Bureau of Labor Statistics Mid-Atlantic Information Office. Retrieved May 20, 2026, from
- International Energy Agency. (2025, May 14). Global EV Outlook 2025.
- International Organization of Motor Vehicle Manufacturers. (2026, April 23). Auto industry growth shifted east in 2025 amid global repositioning.
- National Bureau of Statistics of China. (2026, February 28). Statistical communiqué of the People’s Republic of China on the 2025 national economic and social development.
- Press Information Bureau. (2026, February 10). Status of heavy industries sector. Government of India.
- Ministry of Heavy Industries. (2025, July 10). Notification for E-Trucks. PM E-DRIVE.
- Verband der Automobilindustrie. (2026, January 5). Passenger car production in 2025 slightly above previous year’s level.
- Australian Bureau of Statistics. (2025, November 27). Private new capital expenditure and expected expenditure, Australia, September 2025.
- Society of Motor Manufacturers and Traders. (2026, February 20). SMMT Motor Industry Facts 2026.
- USA Environmental Protection Agency. (2024, March 20). Final rule: Multi-pollutant emissions standards for model years 2027 and later light-duty and medium-duty vehicles.
- American Axle & Manufacturing. (2024, January 9). AAM showcases next-gen electric drive solutions at CES.
- MAHLE GmbH. (2024, October 14). Valeo and MAHLE expand their product range of magnet free electric motors to upper segment applications.
- ZF Friedrichshafen AG. (2024, November 25). Accelerating electrification transformation: ZF opens new e-mobility plant in China.
- Schaeffler AG. (2025, April 3). On the road to decarbonization: Schaeffler presents e-motors with outputs of up to 315 kW.
- ZF Friedrichshafen AG. (2025, June 3). Comfortable temperature for electric cars: New ZF thermal management system increases range by up to 10 percent.
- ZF Friedrichshafen AG. (2025, July 2). Artificial intelligence, real efficiency: TempAI delivers temperature data from the heart of the e-motor.
- American Axle & Manufacturing. (2024, October 17). AAM announces sale of commercial vehicle axle business in India.
- Schaeffler AG. (2026, April 23). Schaeffler receives Sustainability Award in the Automotive sector with E-Axle Repair Tool.
- Dauch Corporation. (2026). Form 10-K for the fiscal year ended December 31, 2025. USA Securities and Exchange Commission.
Bibliography is provided for reader reference. Entries were checked against primary, regulatory, and company pages.
This Report Answers
- What is the 2026 value of the axle and differential oil cooling systems market?
- How fast is the axle and differential oil cooling systems market expected to expand from 2026 to 2036?
- Which component type is expected to hold a leading share in axle and differential oil cooling systems?
- Which cooling architecture is expected to show broader adoption in 2026?
- How do e-axles affect demand for axle and differential oil cooling systems?
- Which countries are forecast to record stronger growth in axle and differential oil cooling systems?
- Which companies are positioned across driveline and thermal module supply?
- What is included and excluded in axle and differential oil cooling systems scope?
- How does FMI build the forecast for axle and differential oil cooling systems?
Frequently Asked Questions
What is the global market demand for axle and differential oil cooling systems market in 2026?
In 2026, the axle and differential oil cooling systems market size is forecast to reach USD 784.1 million across OEM and service channels.
What is the forecast value of the axle and differential oil cooling systems market by 2036?
By 2036, the axle and differential oil cooling systems industry value is forecast to reach USD 1,631.2 million as e-axle platforms expand.
What CAGR is expected for the axle and differential oil cooling systems market from 2026 to 2036?
The axle and differential oil cooling systems sector is anticipated to expand at 7.6% CAGR from 2026 to 2036 across global demand.
Which segment leads the axle and differential oil cooling systems market in 2026?
OEM integration is projected to account for 68.3% share in 2026 as cooling layouts are fixed during vehicle development.
Which cooling architecture holds a strong share in the axle and differential oil cooling systems market?
Active circuits are anticipated to represent 57.2% share in 2026, led by electric pumps improving oil flow control.
Which country is forecast to record the stronger pace in the axle and differential oil cooling systems market?
China is projected to record 9.3% CAGR by 2036, influenced by expansion of NEV output and e-axle production.
What does the axle and differential oil cooling systems market include?
Scope includes coolers and pumps. Hoses, valves and sensors are included to control oil temperature in axle and differential housings.
How did FMI forecast the axle and differential oil cooling systems market?
FMI used vehicle output checks and EV platform review. Supplier evidence and fitment assumptions were used to build the 2026 to 2036 outlook.
How does axle oil cooling work in an electric vehicle?
Electric vehicles use axle oil cooling to move heat away from reducers and motor-adjacent parts. Pumps or oil flow paths carry heat toward a cooler or coolant exchanger.
Are axle oil coolers worth it for towing vehicles?
Axle oil coolers are useful for towing vehicles facing long climbs or repeated heavy loads. Stable oil temperature can reduce gear wear and service risk.
What costs more, an active axle oil circuit or a passive cooler?
Active axle oil circuits usually cost more since pumps and controls are added. Passive coolers cost less but provide less control at low speed.
Who uses axle and differential oil cooling systems?
OEMs install most systems during vehicle development. Service channels replace coolers and hoses for towing vehicles. Pumps are replaced in off-road fleets and damaged driveline circuits.
How long should an axle oil cooling system last?
A factory axle oil cooling system should normally last through the vehicle warranty period if hoses, fittings and pump seals are protected from abrasion and heat.
Preview the report firsthand - request a free sample
Get SampleGet the brochure for pricing and purchase details.
Get PDFTable of Content
- Key Takeaways
- Market Size and CAGR
- Top Growth Driver
- Fastest Growing Segment
- Leading Region
- Key Companies
- Emerging Opportunities
- Executive Summary
- Global Market Outlook
- Demand-side Trends
- Supply-side Trends
- Technology Roadmap Analysis
- Analysis and Recommendations
- Analyst Perspective (What is happening? Why now? What should investors know?)
- Key Questions Answered
- How large is the market?
- What is the CAGR?
- What are key trends?
- Which region dominates?
- Who are the leaders?
- Market Overview
- Market Coverage / Taxonomy
- Market Definition / Scope / Limitations
- Research Methodology
- Chapter Orientation
- Analytical Lens and Working Hypotheses
- Market Structure, Signals, and Trend Drivers
- Benchmarking and Cross-market Comparability
- Market Sizing, Forecasting, and Opportunity Mapping
- Research Design and Evidence Framework
- Desk Research Programme (Secondary Evidence)
- Expert Input and Fieldwork (Primary Evidence)
- Tooling, Models, and Reference Databases
- Data Engineering and Model Build
- Quality Assurance and Audit Trail
- Market Background
- Market Dynamics (Drivers, Restraints, Opportunity, Trends)
- Scenario Forecast (Optimistic, Likely, Conservative)
- Impact Analysis
- AI Impact
- Sustainability Impact
- Regulatory Impact
- Technology Impact
- Consumer / Buyer Analysis
- Purchase Drivers
- Adoption Barriers
- Buyer Journey
- Opportunity Map Analysis
- Product Life Cycle Analysis
- Supply Chain Analysis
- Investment Feasibility Matrix
- Value Chain Analysis
- PESTLE and Porter's Analysis
- Regulatory Landscape
- Regional Parent Market Outlook
- Production and Consumption Statistics
- Import and Export Statistics
- Global Market Analysis and Forecast, 2021 to 2036
- Historical Market Size Value (USD Million) & Volume (Unit) Analysis, 2021 to 2025
- Current and Future Market Size Value (USD Million) & Volume (Unit) Projections, 2026 to 2036
- Y-o-Y Growth Trend Analysis
- Absolute $ Opportunity Analysis
- Global Market Pricing Analysis, 2021 to 2036
- Global Market Analysis and Forecast, By Component Type, 2021 to 2036
- Introduction / Key Findings
- Historical Market Size Value (USD Million) & Volume (Unit) Analysis By Component Type, 2021 to 2025
- Current and Future Market Size Value (USD Million) & Volume (Unit) Analysis and Forecast By Component Type, 2026 to 2036
- Oil Coolers
- Electric Pumps
- Hose Assemblies
- Thermostatic Valves
- Sensors
- Oil Coolers
- Y-o-Y Growth Trend Analysis By Component Type, 2021 to 2025
- Absolute $ Opportunity Analysis By Component Type, 2026 to 2036
- Global Market Analysis and Forecast, By Cooling Architecture, 2021 to 2036
- Introduction / Key Findings
- Historical Market Size Value (USD Million) & Volume (Unit) Analysis By Cooling Architecture, 2021 to 2025
- Current and Future Market Size Value (USD Million) & Volume (Unit) Analysis and Forecast By Cooling Architecture, 2026 to 2036
- Active Circuits
- Passive Circuits
- Integrated Modules
- Active Circuits
- Y-o-Y Growth Trend Analysis By Cooling Architecture, 2021 to 2025
- Absolute $ Opportunity Analysis By Cooling Architecture, 2026 to 2036
- Global Market Analysis and Forecast, By Vehicle Type, 2021 to 2036
- Introduction / Key Findings
- Historical Market Size Value (USD Million) & Volume (Unit) Analysis By Vehicle Type, 2021 to 2025
- Current and Future Market Size Value (USD Million) & Volume (Unit) Analysis and Forecast By Vehicle Type, 2026 to 2036
- Passenger Vehicles
- Commercial Vehicles
- Off-Highway Vehicles
- Performance Vehicles
- Passenger Vehicles
- Y-o-Y Growth Trend Analysis By Vehicle Type, 2021 to 2025
- Absolute $ Opportunity Analysis By Vehicle Type, 2026 to 2036
- Global Market Analysis and Forecast, By Drivetrain Platform, 2021 to 2036
- Introduction / Key Findings
- Historical Market Size Value (USD Million) & Volume (Unit) Analysis By Drivetrain Platform, 2021 to 2025
- Current and Future Market Size Value (USD Million) & Volume (Unit) Analysis and Forecast By Drivetrain Platform, 2026 to 2036
- Electric Axles
- Conventional Axles
- Hybrid Drivelines
- AWD Systems
- Electric Axles
- Y-o-Y Growth Trend Analysis By Drivetrain Platform, 2021 to 2025
- Absolute $ Opportunity Analysis By Drivetrain Platform, 2026 to 2036
- Global Market Analysis and Forecast, By Sales Channel, 2021 to 2036
- Introduction / Key Findings
- Historical Market Size Value (USD Million) & Volume (Unit) Analysis By Sales Channel, 2021 to 2025
- Current and Future Market Size Value (USD Million) & Volume (Unit) Analysis and Forecast By Sales Channel, 2026 to 2036
- OEM Integration
- Service Parts
- Retrofit Kits
- OEM Integration
- Y-o-Y Growth Trend Analysis By Sales Channel, 2021 to 2025
- Absolute $ Opportunity Analysis By Sales Channel, 2026 to 2036
- Global Market Analysis and Forecast, By Cooling Medium
- Introduction / Key Findings
- Historical Market Size Value (USD Million) & Volume (Unit) Analysis By Cooling Medium, 2021 to 2025
- Current and Future Market Size Value (USD Million) & Volume (Unit) Analysis and Forecast By Cooling Medium, 2026 to 2036
- Gear Oil
- Water-Glycol
- Hybrid Fluids
- Gear Oil
- Y-o-Y Growth Trend Analysis By Cooling Medium, 2021 to 2025
- Absolute $ Opportunity Analysis By Cooling Medium, 2026 to 2036
- Global Market Analysis and Forecast, By Region, 2021 to 2036
- Introduction
- Historical Market Size Value (USD Million) & Volume (Unit) Analysis By Region, 2021 to 2025
- Current Market Size Value (USD Million) & Volume (Unit) Analysis and Forecast By Region, 2026 to 2036
- North America
- Latin America
- Western Europe
- Eastern Europe
- East Asia
- South Asia and Pacific
- Middle East & Africa
- Market Attractiveness Analysis By Region
- North America Market Analysis and Forecast, By Country, 2021 to 2036
- Historical Market Size Value (USD Million) & Volume (Unit) Trend Analysis By Market Taxonomy, 2021 to 2025
- Market Size Value (USD Million) & Volume (Unit) Forecast By Market Taxonomy, 2026 to 2036
- By Country
- USA
- Canada
- Mexico
- By Component Type
- By Cooling Architecture
- By Vehicle Type
- By Drivetrain Platform
- By Sales Channel
- By Cooling Medium
- By Country
- Market Attractiveness Analysis
- By Country
- By Component Type
- By Cooling Architecture
- By Vehicle Type
- By Drivetrain Platform
- By Sales Channel
- By Cooling Medium
- Key Takeaways
- Latin America Market Analysis and Forecast, By Country
- Historical Market Size Value (USD Million) & Volume (Unit) Trend Analysis By Market Taxonomy, 2021 to 2025
- Market Size Value (USD Million) & Volume (Unit) Forecast By Market Taxonomy, 2026 to 2036
- By Country
- Brazil
- Chile
- Rest of Latin America
- By Component Type
- By Cooling Architecture
- By Vehicle Type
- By Drivetrain Platform
- By Sales Channel
- By Cooling Medium
- By Country
- Market Attractiveness Analysis
- By Country
- By Component Type
- By Cooling Architecture
- By Vehicle Type
- By Drivetrain Platform
- By Sales Channel
- By Cooling Medium
- Key Takeaways
- Western Europe Market Analysis and Forecast, By Country
- Historical Market Size Value (USD Million) & Volume (Unit) Trend Analysis By Market Taxonomy, 2021 to 2025
- Market Size Value (USD Million) & Volume (Unit) Forecast By Market Taxonomy, 2026 to 2036
- By Country
- Germany
- UK
- Italy
- Spain
- France
- Nordic
- BENELUX
- Rest of Western Europe
- By Component Type
- By Cooling Architecture
- By Vehicle Type
- By Drivetrain Platform
- By Sales Channel
- By Cooling Medium
- By Country
- Market Attractiveness Analysis
- By Country
- By Component Type
- By Cooling Architecture
- By Vehicle Type
- By Drivetrain Platform
- By Sales Channel
- By Cooling Medium
- Key Takeaways
- Eastern Europe Market Analysis and Forecast, By Country
- Historical Market Size Value (USD Million) & Volume (Unit) Trend Analysis By Market Taxonomy, 2021 to 2025
- Market Size Value (USD Million) & Volume (Unit) Forecast By Market Taxonomy, 2026 to 2036
- By Country
- Russia
- Poland
- Hungary
- Balkan & Baltic
- Rest of Eastern Europe
- By Component Type
- By Cooling Architecture
- By Vehicle Type
- By Drivetrain Platform
- By Sales Channel
- By Cooling Medium
- By Country
- Market Attractiveness Analysis
- By Country
- By Component Type
- By Cooling Architecture
- By Vehicle Type
- By Drivetrain Platform
- By Sales Channel
- By Cooling Medium
- Key Takeaways
- East Asia Market Analysis and Forecast, By Country
- Historical Market Size Value (USD Million) & Volume (Unit) Trend Analysis By Market Taxonomy, 2021 to 2025
- Market Size Value (USD Million) & Volume (Unit) Forecast By Market Taxonomy, 2026 to 2036
- By Country
- China
- Japan
- South Korea
- By Component Type
- By Cooling Architecture
- By Vehicle Type
- By Drivetrain Platform
- By Sales Channel
- By Cooling Medium
- By Country
- Market Attractiveness Analysis
- By Country
- By Component Type
- By Cooling Architecture
- By Vehicle Type
- By Drivetrain Platform
- By Sales Channel
- By Cooling Medium
- Key Takeaways
- South Asia and Pacific Market Analysis and Forecast, By Country
- Historical Market Size Value (USD Million) & Volume (Unit) Trend Analysis By Market Taxonomy, 2021 to 2025
- Market Size Value (USD Million) & Volume (Unit) Forecast By Market Taxonomy, 2026 to 2036
- By Country
- India
- ASEAN
- Australia & New Zealand
- Rest of South Asia and Pacific
- By Component Type
- By Cooling Architecture
- By Vehicle Type
- By Drivetrain Platform
- By Sales Channel
- By Cooling Medium
- By Country
- Market Attractiveness Analysis
- By Country
- By Component Type
- By Cooling Architecture
- By Vehicle Type
- By Drivetrain Platform
- By Sales Channel
- By Cooling Medium
- Key Takeaways
- Middle East & Africa Market Analysis and Forecast, By Country
- Historical Market Size Value (USD Million) & Volume (Unit) Trend Analysis By Market Taxonomy, 2021 to 2025
- Market Size Value (USD Million) & Volume (Unit) Forecast By Market Taxonomy, 2026 to 2036
- By Country
- Kingdom of Saudi Arabia
- Other GCC Countries
- Türkiye
- South Africa
- Other African Union
- Rest of Middle East & Africa
- By Component Type
- By Cooling Architecture
- By Vehicle Type
- By Drivetrain Platform
- By Sales Channel
- By Cooling Medium
- By Country
- Market Attractiveness Analysis
- By Country
- By Component Type
- By Cooling Architecture
- By Vehicle Type
- By Drivetrain Platform
- By Sales Channel
- By Cooling Medium
- Key Takeaways
- Key Countries Market Analysis
- USA
- Pricing Analysis
- Market Share Analysis, 2025
- By Component Type
- By Cooling Architecture
- By Vehicle Type
- By Drivetrain Platform
- By Sales Channel
- By Cooling Medium
- Canada
- Pricing Analysis
- Market Share Analysis, 2025
- By Component Type
- By Cooling Architecture
- By Vehicle Type
- By Drivetrain Platform
- By Sales Channel
- By Cooling Medium
- Mexico
- Pricing Analysis
- Market Share Analysis, 2025
- By Component Type
- By Cooling Architecture
- By Vehicle Type
- By Drivetrain Platform
- By Sales Channel
- By Cooling Medium
- Brazil
- Pricing Analysis
- Market Share Analysis, 2025
- By Component Type
- By Cooling Architecture
- By Vehicle Type
- By Drivetrain Platform
- By Sales Channel
- By Cooling Medium
- Chile
- Pricing Analysis
- Market Share Analysis, 2025
- By Component Type
- By Cooling Architecture
- By Vehicle Type
- By Drivetrain Platform
- By Sales Channel
- By Cooling Medium
- Germany
- Pricing Analysis
- Market Share Analysis, 2025
- By Component Type
- By Cooling Architecture
- By Vehicle Type
- By Drivetrain Platform
- By Sales Channel
- By Cooling Medium
- UK
- Pricing Analysis
- Market Share Analysis, 2025
- By Component Type
- By Cooling Architecture
- By Vehicle Type
- By Drivetrain Platform
- By Sales Channel
- By Cooling Medium
- Italy
- Pricing Analysis
- Market Share Analysis, 2025
- By Component Type
- By Cooling Architecture
- By Vehicle Type
- By Drivetrain Platform
- By Sales Channel
- By Cooling Medium
- Spain
- Pricing Analysis
- Market Share Analysis, 2025
- By Component Type
- By Cooling Architecture
- By Vehicle Type
- By Drivetrain Platform
- By Sales Channel
- By Cooling Medium
- France
- Pricing Analysis
- Market Share Analysis, 2025
- By Component Type
- By Cooling Architecture
- By Vehicle Type
- By Drivetrain Platform
- By Sales Channel
- By Cooling Medium
- India
- Pricing Analysis
- Market Share Analysis, 2025
- By Component Type
- By Cooling Architecture
- By Vehicle Type
- By Drivetrain Platform
- By Sales Channel
- By Cooling Medium
- ASEAN
- Pricing Analysis
- Market Share Analysis, 2025
- By Component Type
- By Cooling Architecture
- By Vehicle Type
- By Drivetrain Platform
- By Sales Channel
- By Cooling Medium
- Australia & New Zealand
- Pricing Analysis
- Market Share Analysis, 2025
- By Component Type
- By Cooling Architecture
- By Vehicle Type
- By Drivetrain Platform
- By Sales Channel
- By Cooling Medium
- China
- Pricing Analysis
- Market Share Analysis, 2025
- By Component Type
- By Cooling Architecture
- By Vehicle Type
- By Drivetrain Platform
- By Sales Channel
- By Cooling Medium
- Japan
- Pricing Analysis
- Market Share Analysis, 2025
- By Component Type
- By Cooling Architecture
- By Vehicle Type
- By Drivetrain Platform
- By Sales Channel
- By Cooling Medium
- South Korea
- Pricing Analysis
- Market Share Analysis, 2025
- By Component Type
- By Cooling Architecture
- By Vehicle Type
- By Drivetrain Platform
- By Sales Channel
- By Cooling Medium
- Russia
- Pricing Analysis
- Market Share Analysis, 2025
- By Component Type
- By Cooling Architecture
- By Vehicle Type
- By Drivetrain Platform
- By Sales Channel
- By Cooling Medium
- Poland
- Pricing Analysis
- Market Share Analysis, 2025
- By Component Type
- By Cooling Architecture
- By Vehicle Type
- By Drivetrain Platform
- By Sales Channel
- By Cooling Medium
- Hungary
- Pricing Analysis
- Market Share Analysis, 2025
- By Component Type
- By Cooling Architecture
- By Vehicle Type
- By Drivetrain Platform
- By Sales Channel
- By Cooling Medium
- Kingdom of Saudi Arabia
- Pricing Analysis
- Market Share Analysis, 2025
- By Component Type
- By Cooling Architecture
- By Vehicle Type
- By Drivetrain Platform
- By Sales Channel
- By Cooling Medium
- Türkiye
- Pricing Analysis
- Market Share Analysis, 2025
- By Component Type
- By Cooling Architecture
- By Vehicle Type
- By Drivetrain Platform
- By Sales Channel
- By Cooling Medium
- South Africa
- Pricing Analysis
- Market Share Analysis, 2025
- By Component Type
- By Cooling Architecture
- By Vehicle Type
- By Drivetrain Platform
- By Sales Channel
- By Cooling Medium
- USA
- Market Structure Analysis
- Competition Dashboard
- Competition Benchmarking
- Market Share Analysis of Top Players
- By Regional
- By Component Type
- By Cooling Architecture
- By Vehicle Type
- By Drivetrain Platform
- By Sales Channel
- By Cooling Medium
- Emerging Startups
- Innovation Benchmarking
- Competition Analysis
- Competition Deep Dive
- Dana Incorporated
- Overview
- Product Portfolio
- Profitability by Market Segments (Product/Region/Sales Channel)
- Sales Footprint
- Strategy Overview
- Marketing Strategy
- Product Strategy
- Channel Strategy
- ZF Friedrichshafen AG
- Dauch Corporation
- Schaeffler AG
- Linamar Corporation
- MAHLE GmbH
- Modine Manufacturing Company
- Setrab AB
- Valeo
- BorgWarner Inc.
- Dana Incorporated
- Case Studies
- Success Stories
- Recent Developments
- Competition Deep Dive
- Assumptions & Acronyms Used


