Azelaic Acid Derivatives Market Size and Share Forecast Outlook 2025 to 2035

The Azelaic Acid Derivatives Market is expected to record a valuation of USD 1,241.4 million in 2025 and USD 3,952.3 million in 2035, with an increase of USD 2,710.9 million, which equals a growth of more than 218% over the decade. The overall expansion represents a CAGR of 12.3% and a more than 3X increase in market size.
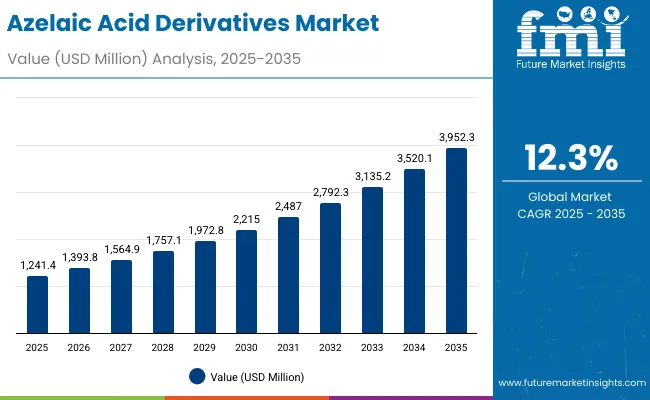
Quick Stats for Azelaic Acid Derivatives Market

  • Azelaic Acid Derivatives Market Value (2025): USD 1,241.4 million
  • Azelaic Acid Derivatives Market Forecast Value (2035): USD 3,952.3 million
  • Azelaic Acid Derivatives Market Forecast CAGR: 12.3%
  • Leading Segment in Azelaic Acid Derivatives Market in 2025: Acne treatment (46.6%)
  • Key Growth Regions in the Azelaic Acid Derivatives Market: North America, East Asia, South Asia & Pacific, Europe
  • Top Key Players in Azelaic Acid Derivatives Market: Paula’s Choice, The Ordinary, SkinCeuticals, Murad, Sesderma, Eucerin, La Roche-Posay, Azelique, Glytone, Allergan

Azelaic Acid Derivatives Market

Azelaic Acid Derivatives Market Key Takeaways

Metric Value
Market Estimated Value in (2025E) USD 1,241.4 million
Market Forecast Value in (2035F) USD 3,952.3 million
Forecast CAGR (2025 to 2035) 12.3%

During the first five-year period from 2025 to 2030, the market increases from USD 1,241.4 million to USD 2,215.0 million, adding USD 973.6 million, which accounts for 35.9% of the total decade growth. This phase records steady adoption in acne care, pigmentation reduction, and anti-inflammatory applications, driven by dermatological awareness and rising demand for dermatologist-tested and clinical-grade claims. Creams and lotions dominate this period as they cater to over 42% of daily-use formulations, serving both prescription and OTC skincare.

The second half from 2030 to 2035 contributes USD 1,737.3 million, equal to 64.1% of total growth, as the market jumps from USD 2,215.0 million to USD 3,952.3 million. This acceleration is powered by widespread consumer adoption of e-commerce, the premiumization of clean-label and vegan azelaic acid products, and deeper penetration in emerging economies such as India and China. Serums and gels, alongside targeted spot treatments, capture a rising share above 50% by the end of the decade. Digital-first brands with subscription models further drive specialty beauty and pharmacy channels, expanding consumer reach globally.

From 2020 to 2024, the Azelaic Acid Derivatives Market grew from an estimated USD 800 million to USD 1,150 million, driven by acne-focused solutions and dermatologist-backed products. During this period, the competitive landscape was dominated by specialist skincare brands controlling nearly 70% of revenue, with leaders such as Paula’s Choice, The Ordinary, and La Roche-Posay focusing on acne treatments and pigmentation reduction. Differentiation relied heavily on concentration efficacy (10%-20% azelaic acid formulations), skin sensitivity tolerability, and affordability. Vegan and clean-label claims gained traction but were still niche, contributing less than 15% of the total market value.

Demand for azelaic acid derivatives is expected to expand to USD 1,241.4 million in 2025, and the revenue mix will shift as serums, gels, and spot treatments grow to over 55% share by 2035. Traditional leaders face rising competition from clinical-grade entrants offering prescription-strength formulations, while digital-native brands emphasize vegan, cruelty-free, and subscription-based models. Major companies are pivoting to omnichannel strategies, with e-commerce and specialty beauty stores gaining market share over mass retail. Competitive advantage is moving away from price alone to clinical validation, consumer trust, and brand positioning around safe, effective skin transformation.

Why the Azelaic Acid Derivatives Market is Growing?

Advances in clinical skincare have established azelaic acid as a gold standard for acne treatment, pigmentation correction, and inflammatory skin conditions. Its multifunctional nature anti-inflammatory, brightening, and acne-combating makes it versatile across dermatologist prescriptions and consumer beauty routines. Growing awareness of long-term skin health has expanded its adoption in serums and spot treatments, which are increasingly favored for precision skincare.

Pharmacy-driven distribution has provided credibility, with 37.6% market share in 2025, while e-commerce is rising sharply due to consumer preference for online consultations, product education, and subscription convenience. The rise of vegan, clean-label, and dermatologist-tested claims has further boosted consumer trust and market expansion. Segment growth is expected to be led by acne treatment applications, cream and lotion formats in the early phase, and serums and gels in the later decade due to premiumization and personalization. Countries such as India (CAGR 19.4%) and China (CAGR 17.3%) will act as key accelerators, while the USA maintains its position as the largest individual market.

Segmental Analysis

The market is segmented by function, product type, channel, claim, and geography, highlighting the demand for multifunctional skincare supported by dermatological efficacy. Functions include acne treatment, pigmentation reduction, anti-inflammatory, and brightening. Product types encompass creams/lotions, serums, gels, and spot treatments. Channels include pharmacies, e-commerce, specialty beauty stores, and mass retail. Claims highlight dermatologist-tested, clinical-grade, vegan, and clean-label. Regionally, the scope spans North America, Europe, East Asia, South Asia & Pacific, Latin America, and the Middle East & Africa.
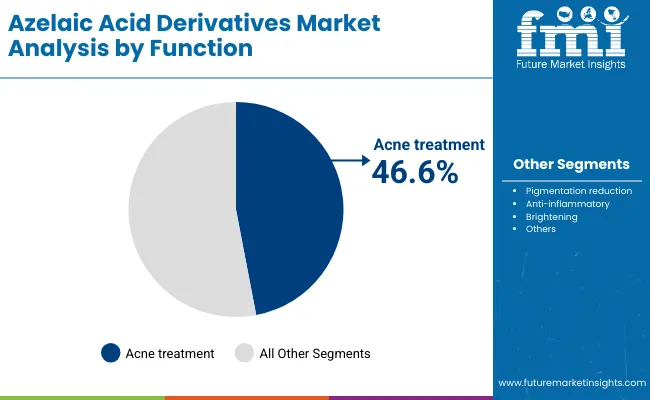
Insights into the Function Segment with Acne Treatment Leading in Market Share

Azelaic Acid Derivatives Market By Funtion

Function Segment Market Value Share, 2025
Acne treatment 46.6%
Others 53.4%

The acne treatment segment is projected to contribute nearly half of the Azelaic Acid Derivatives Market revenue in 2025, maintaining its lead as the dominant function category. This is driven by the high prevalence of acne among younger demographics, rising prescription usage, and growing adoption of OTC azelaic acid formulations. With its dual benefits of reducing acne-causing bacteria and soothing inflammation, the segment will continue to anchor the market. Expansion in tele-dermatology and online pharmacy platforms further fuels its reach.
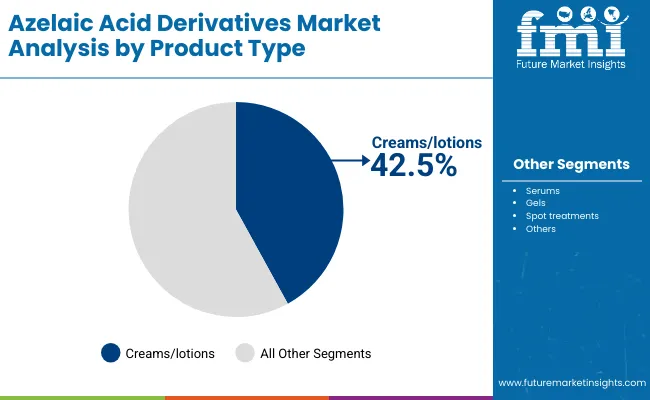
Insights into the Product Type Segment with Creams and Lotions Dominating

Azelaic Acid Derivatives Market By Product

Product Type Segment Market Value Share, 2025
Creams/lotions 42.5%
Others 57.5%

Creams and lotions hold the largest share in 2025 due to their accessibility, affordability, and widespread consumer acceptance. Positioned as both prescription and OTC solutions, they cater to acne management and pigmentation reduction, serving as the first-choice entry point for azelaic acid adoption. Their ease of use and compatibility with daily skincare routines ensure broad applicability across demographics. By 2035, serums and gels are expected to gain faster growth, but creams and lotions remain an essential backbone of the market.
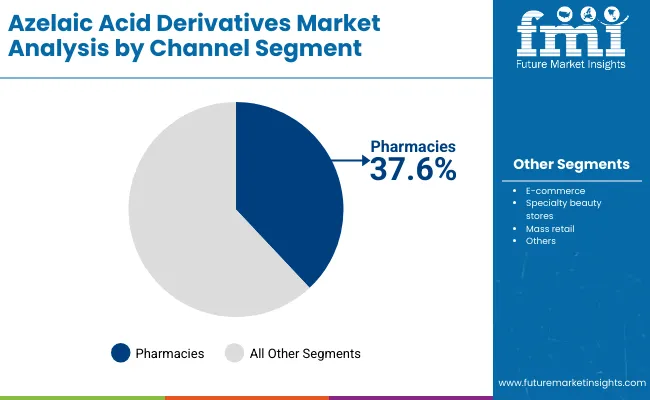
Insights into the Channel Segment with Pharmacies Retaining Strong Hold

Azelaic Acid Derivatives Market By Channel

Channel Segment Market Value Share, 2025
Pharmacies 37.6%
Others 62.4%

Pharmacies are expected to hold the dominant channel share in 2025, underscoring consumer reliance on trusted medical retail formats for dermatology-backed solutions. Their credibility in dispensing clinical-grade skincare has solidified their importance in early adoption markets such as the USA and Europe. However, with e-commerce platforms scaling globally, the online channel is forecasted to outpace traditional retail growth by 2035, particularly in Asia-Pacific.

Why the Azelaic Acid Derivatives Market is Growing?

Drivers

Rising Prevalence of Acne, Pigmentation, and Skin Sensitivity Disorders

The foremost driver for the Azelaic Acid Derivatives Market is the growing incidence of acne and hyperpigmentation, especially among younger populations in both developed and emerging markets. According to global dermatology studies, acne affects nearly 85% of people aged 12-24, and pigmentation issues rank among the top three dermatological concerns worldwide. Azelaic acid derivatives offer a dual-action benefit: they are highly effective against acne-causing bacteria while simultaneously reducing post-inflammatory hyperpigmentation.

This versatility positions them as a first-choice ingredient for both prescription and OTC dermatology products. The market is further propelled by a rise in consumer awareness about skin health, with patients increasingly seeking safer alternatives to harsher treatments like benzoyl peroxide or retinoids. As more consumers turn to multi-functional, skin-friendly active ingredients, azelaic acid adoption will accelerate across both clinical and cosmetic segments.

Expansion of Clean-Label, Vegan, and Dermatologist-Tested Skincare Products

Another major growth driver is the strong consumer preference shift toward clean-label, vegan, cruelty-free, and dermatologist-tested formulations. Azelaic acid derivatives naturally fit into these claims due to their plant and grain origins (derived from wheat, barley, or rye) and their proven safety profile. Brands such as The Ordinary, Paula’s Choice, and La Roche-Posay have leveraged this positioning effectively, making azelaic acid a hero ingredient in their clean and minimalist skincare portfolios.

In addition, clinical validation and dermatologist endorsements boost consumer trust, especially in markets like the USA and Europe where clinical-grade performance strongly influences purchasing behavior. The convergence of clinical efficacy and ethical claims is fueling the rapid premiumization of azelaic acid derivatives, expanding their appeal across mass, specialty, and luxury skincare segments.

Restraints

Competition from Established Actives such as Retinoids and Niacinamide

A major restraint in the market is the intense competition azelaic acid derivatives face from other well-established skincare actives like retinoids, niacinamide, salicylic acid, and vitamin C. These ingredients already dominate consumer awareness, brand marketing, and clinical skincare formulations. For instance, niacinamide is often promoted as a multifunctional ingredient for brightening and barrier support, directly competing with azelaic acid’s pigmentation reduction and anti-inflammatory roles. Similarly, retinoids remain the gold standard for acne and anti-aging, leaving azelaic acid in a secondary position unless heavily differentiated. This competitive overlap makes it challenging for brands to justify premium pricing or establish strong consumer loyalty around azelaic acid without significant marketing investments.

Limited Consumer Awareness and Delayed Results

While dermatologists widely recognize the benefits of azelaic acid, mainstream consumer awareness remains relatively low compared to more “trendy” actives like hyaluronic acid or vitamin C. Furthermore, azelaic acid derivatives often require consistent use over several weeks before visible results are observed. This delayed gratification effect creates friction with consumers who expect rapid improvements in acne and pigmentation. Misconceptions about irritation (despite azelaic acid being generally well-tolerated) also hinder adoption among sensitive-skin consumers. Together, these factors slow down product penetration in mass retail channels and require brands to invest significantly in education campaigns, dermatologist collaborations, and transparent clinical trial communication.

Key Trends

Shift Toward Serums, Spot Treatments, and Personalized Skincare

While creams and lotions currently dominate the market (42.5% share in 2025), the fastest-growing trend is the rise of serums, gels, and spot treatments. Consumers are increasingly drawn to targeted solutions that promise precision benefits such as fading dark spots or addressing localized breakouts rather than relying solely on general creams. This trend aligns with the broader movement toward personalized skincare, where azelaic acid concentrations are adjusted for individual needs (e.g., 10% for sensitive users, 15-20% for severe acne). By 2035, serums and spot treatments are expected to capture a larger market share, driven by premium packaging, subscription models, and digital-first consumer engagement through e-commerce platforms.

Strong Growth in Emerging Markets (India, China, and Southeast Asia)

The market is witnessing its strongest acceleration in Asia, particularly India and China, which are forecasted to grow at CAGRs of 19.4% and 17.3%, respectively. Rising disposable incomes, increasing urbanization, and heightened interest in clinical skincare are fueling demand. Consumers in these regions are also more open to dermatologist consultations and telemedicine services, which directly promote azelaic acid derivatives as part of acne and pigmentation treatment regimens. The adoption of e-commerce giants like Tmall in China and Nykaa in India further supports distribution expansion, enabling international brands to penetrate regional markets quickly. By 2035, these countries will significantly increase their global share, making Asia-Pacific a hub for future demand.
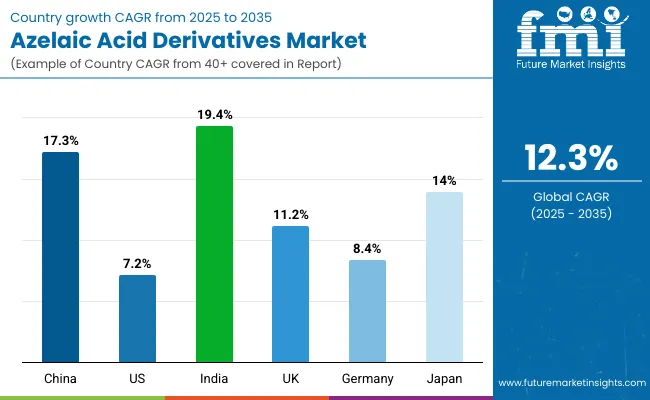
Analysis of Azelaic Acid Derivatives Market By Key Countries

Azelaic Acid Derivatives Market By Country

Countries Estimated CAGR (2025 to 2035)
China 17.3%
USA 7.2%
India 19.4%
UK 11.2%
Germany 8.4%
Japan 14.0%

The Azelaic Acid Derivatives Market shows significant country-level variation in growth trajectories between 2025 and 2035, reflecting differences in consumer maturity, dermatological awareness, and retail access. India (CAGR 19.4%) and China (CAGR 17.3%) are the fastest-growing markets, driven by a rising middle class, expanding e-commerce ecosystems, and high unmet needs for acne and pigmentation solutions. Dermatology consultations and telemedicine are gaining traction in these regions, accelerating prescription-based azelaic acid adoption. Japan also records a strong 14.0% CAGR, supported by advanced skincare routines, high consumer trust in clinical-grade formulations, and demand for brightening products that align with local beauty standards. Together, Asia-Pacific economies are projected to outpace North America and Europe in relative growth, though starting from a smaller base.

In contrast, mature markets such as the USA (7.2% CAGR), Germany (8.4% CAGR), and the UK (11.2% CAGR) show steadier but slower growth, reflecting saturation in acne and pigmentation treatment segments. In the USA, azelaic acid adoption is already established through both prescription and OTC channels, but competition with retinoids and niacinamide limits acceleration. Germany’s growth is modest, anchored by pharmacies and clinical endorsements, while the UK demonstrates stronger momentum due to consumer interest in vegan, dermatologist-tested, and clean-label claims. These developed markets will remain the largest revenue contributors in absolute terms, but their share of the global market is expected to decline as emerging economies drive the next wave of expansion.
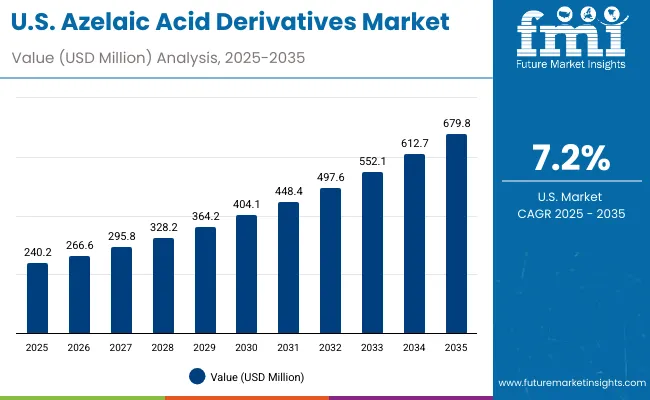
Sales Outlook for Azelaic Acid Derivatives in the United States

Azelaic Acid Derivatives Market Usa

Year USA Azelaic Acid Derivatives Market (USD Million)
2025 240.2
2026 266.6
2027 295.8
2028 328.2
2029 364.2
2030 404.1
2031 448.4
2032 497.6
2033 552.1
2034 612.7
2035 679.8

The Azelaic Acid Derivatives Market in the United States is projected to grow at a CAGR of 7.2%, driven by increasing adoption of clinical-grade skincare and prescription formulations. Dermatologists widely prescribe azelaic acid for acne and pigmentation, reinforcing its strong positioning in pharmacies. Over-the-counter (OTC) formulations are gaining visibility in retail and e-commerce, especially among consumers seeking gentler alternatives to retinoids and benzoyl peroxide. Digital-native skincare brands are boosting consumer awareness through direct-to-consumer (D2C) education campaigns and subscription-based models. Clean-label, vegan, and dermatologist-tested claims resonate strongly with USA consumers, further pushing demand across both specialty beauty stores and online platforms.

  • Dermatologists continue to drive prescriptions for acne and pigmentation disorders.
  • E-commerce channels and D2C subscription models are expanding market penetration.
  • Clinical-grade positioning enhances consumer trust and OTC adoption.

Growth and Expansion Outlook for Azelaic Acid Derivatives in the United Kingdom

The Azelaic Acid Derivatives Market in the United Kingdom is expected to grow at a CAGR of 11.2%, supported by demand for vegan, cruelty-free, and dermatologist-tested products. The UK consumer base is highly receptive to clean-label skincare, and azelaic acid has gained traction as a trusted active for sensitive skin and long-term acne management. Premium brands such as Paula’s Choice, La Roche-Posay, and The Ordinary have captured strong market shares by positioning azelaic acid within multi-step skincare routines. Additionally, pharmacies and specialty beauty retailers remain critical in reinforcing credibility, while e-commerce platforms like Boots and Cult Beauty ensure broad availability. The growing popularity of tele-dermatology consultations also supports wider adoption.

  • UK consumers favor dermatologist-tested, vegan, and clean-label azelaic acid products.
  • Premium and mass brands alike are integrating azelaic acid into routine-based skincare.
  • E-commerce platforms and pharmacies remain critical distribution channels.

Growth and Expansion Outlook for Azelaic Acid Derivatives in India

India is witnessing rapid growth in the Azelaic Acid Derivatives Market, which is forecast to expand at a CAGR of 19.4% through 2035, the fastest among global markets. Rising disposable incomes, urbanization, and heightened awareness of acne and pigmentation disorders are fueling strong demand. Adoption is expanding beyond tier-1 cities into tier-2 and tier-3 regions, supported by cost-effective launches and expanding e-commerce distribution. Dermatologists increasingly prescribe azelaic acid as a safer alternative for long-term acne management, while digital pharmacies and telemedicine platforms are accelerating access across smaller cities. Mass-market appeal is also supported by affordable creams and lotions, while premium serums and spot treatments cater to affluent urban consumers.
  • Strong adoption across both metro and tier-2/3 cities due to affordability and digital access.
  • Dermatologists are driving adoption through prescription-strength formulations.
  • E-commerce and telemedicine platforms are expanding distribution reach nationwide.

Sales Outlook for Azelaic Acid Derivatives in China

Azelaic Acid Derivatives Market China

The Azelaic Acid Derivatives Market in China is expected to grow at a CAGR of 17.3%, one of the highest globally. Growth is driven by strong consumer demand for brightening and pigmentation correction solutions, alongside rising awareness of acne care in urban centers. E-commerce giants such as Tmall and JD.com play a pivotal role in accelerating brand adoption, especially for international players. Local skincare brands are also innovating with affordable formulations, making azelaic acid accessible to younger consumers. Municipal and regional dermatology clinics are promoting clinical-grade products, while social media platforms such as Xiaohongshu are creating viral awareness around azelaic acid benefits. As demand for high-efficacy, clean-label skincare rises, China is positioned to become one of the most dynamic markets globally.
  • Brightening and pigmentation care is the strongest growth driver among Chinese consumers.
  • E-commerce platforms dominate distribution and accelerate adoption for both local and global brands.
  • Local players are increasing affordability, supporting rapid uptake among younger demographics.

Opportunity Analysis of USA Azelaic Acid Derivatives Market

Azelaic Acid Derivatives Market Usa 2

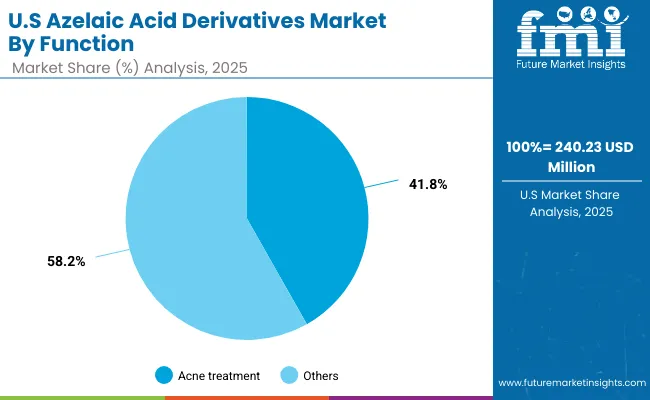
Function Segment Market Value Share, 2025
Acne treatment 41.8%
Others 58.2%

The USA Azelaic Acid Derivatives Market is valued at USD 240.23 million in 2025, with acne treatment leading at 41.8% share, followed by other applications such as pigmentation reduction, anti-inflammatory use, and brightening at 58.2%. The dominance of acne treatment reflects the high prevalence of acne among adolescents and young adults, as well as dermatologists’ reliance on azelaic acid as a safe, prescription-supported active. The segment benefits from established pharmacy distribution, strong clinical validation, and increasing OTC adoption across mass retail and e-commerce channels.

This advantage positions acne treatment products as an essential tool for addressing long-term dermatological concerns, particularly among consumers seeking gentler alternatives to retinoids and benzoyl peroxide. Pigmentation correction and brightening applications are gaining momentum, especially in multi-active formulations. As clean-label and vegan positioning grows in importance, brands are expected to further expand azelaic acid offerings beyond acne into holistic skin health routines.
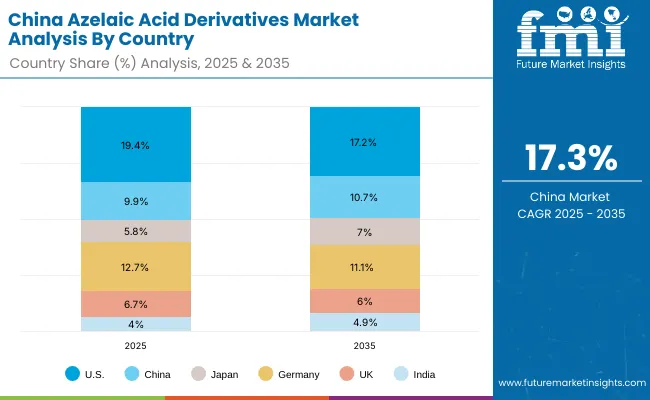
  • Market size for the USA in 2025 is USD 240.23 million
  • Global market share is approximately 19.4% in 2025
  • Acne treatment leads at 41.8% due to high clinical acceptance and consumer demand

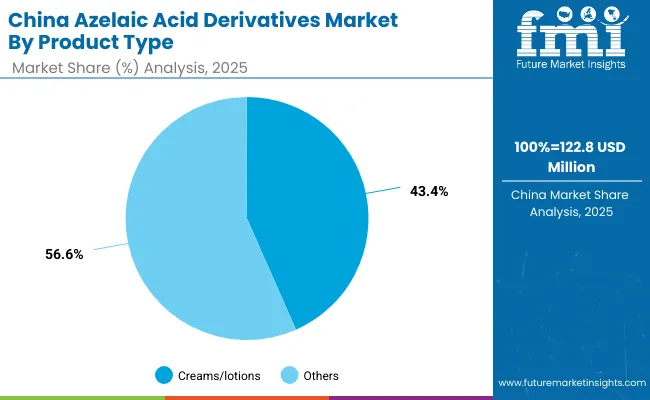
Opportunity Analysis of China Azelaic Acid Derivatives Market

Azelaic Acid Derivatives Market China 2

Product Type Segment Market Value Share, 2025
Creams/lotions 43.4%
Others 56.6%

The China Azelaic Acid Derivatives Market is valued at USD 122.8 million in 2025, with creams and lotions leading at 43.4% share, followed by serums, gels, and spot treatments at 56.6%. The dominance of creams and lotions is a direct outcome of China’s skincare culture, where moisturizers and daily-use formulations remain the preferred format for acne and pigmentation care. These products are affordable, accessible through both pharmacies and e-commerce platforms, and trusted by dermatologists for sensitive-skin use.

This advantage positions creams and lotions as the foundation of consumer adoption in early stages. However, the “others” segment, which includes serums and spot treatments, is rapidly gaining momentum, fueled by premiumization, influencer-led marketing, and high adoption among younger consumers seeking precision skincare. By 2035, serums are expected to capture a much larger share as Chinese consumers increasingly favor multifunctional, higher-concentration solutions.
  • Market size for China in 2025 is USD 122.8 million
  • Global market share is approximately 9.9% in 2025
  • Creams/lotions lead at 43.4% due to cultural preference for daily-use skincare

Competitive Landscape of Azelaic Acid Derivatives Market

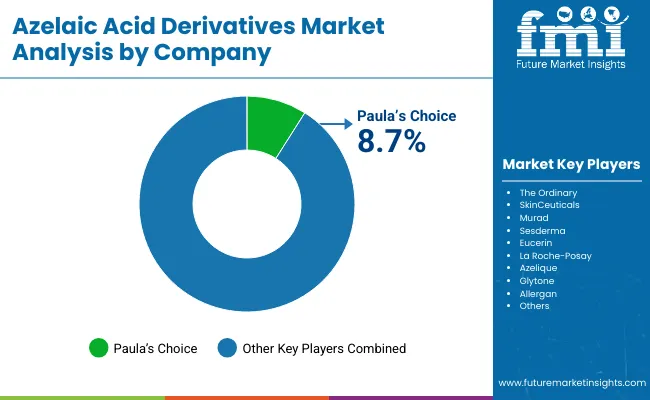
Azelaic Acid Derivatives Market By Company

The Azelaic Acid Derivatives Market is moderately fragmented, with a mix of dermatology-backed leaders, clinical-grade innovators, and niche-focused indie brands competing across multiple skincare applications. Market leader Paula’s Choice holds the largest individual share at 8.7% in 2025, driven by its cult-favorite 10% Azelaic Acid Booster, which has become a benchmark product globally. Its success is reinforced by strong dermatologist endorsements, effective positioning for acne and pigmentation, and a trusted clean-label identity.

Other leading players, including The Ordinary, SkinCeuticals, Murad, Eucerin, and La Roche-Posay, strengthen the landscape with clinical-grade positioning and diverse product portfolios across creams, serums, and gels. Their strategies emphasize dermatologist-tested claims, e-commerce expansion, and collaborations with dermatology clinics to boost credibility. Indie brands like Azelique and Glytone focus on niche positioning, offering targeted azelaic acid spot treatments and gel formulations, while Allergan leverages its pharmaceutical expertise to anchor prescription-strength azelaic acid derivatives in dermatology practices.

Competitive differentiation is shifting away from concentration percentages alone toward ecosystem strength combining clean-label claims, e-commerce strategies, dermatologist endorsements, and personalized skincare offerings. Subscription-based models, AI-driven product recommendations, and multifunctional hybrid formulations are emerging as critical levers for sustainable competitive advantage.

  • On March 14, 2023, Paula’s Choice expanded its portfolio by introducing an upgraded 10% Azelaic Acid Booster with enhanced soothing ingredients. The launch emphasized dual-action acne and pigmentation treatment, strengthening its position as a dermatologist-trusted brand.
  • On July 6, 2023, The Ordinary released a limited-edition Azelaic Acid Suspension 10% with eco-friendly packaging, reinforcing its clean-label and sustainability positioning. This move targeted environmentally conscious millennials and Gen Z consumers.

Scope of the Report

Item Value
Quantitative Units USD 3,952.3 million
Function Acne treatment, Pigmentation reduction, Anti-inflammatory, Brightening
Product Type Creams/lotions, Serums, Gels, Spot treatments
Channel Pharmacies, E-commerce, Specialty beauty stores, Mass retail
Claim Dermatologist-tested, Clinical-grade, Vegan, Clean-label
Regions Covered North America, Europe, Asia-Pacific, Latin America, Middle East & Africa
Country Covered United States, Canada, Germany, France, United Kingdom, China, Japan, India, Brazil, South Africa
Key Companies Profiled Paula’s Choice, The Ordinary, SkinCeuticals, Murad, Sesderma, Eucerin, La Roche- Posay, Azelique, Glytone, Allergan
Additional Attributes Dollar sales by function and product type, adoption trends in acne treatment and pigmentation reduction, rising demand for dermatologist-tested and vegan claims, segment-specific growth in creams/lotions and serums, e-commerce and pharmacy channel expansion, integration of clinical-grade positioning with consumer skincare, regional trends influenced by Asia-Pacific premiumization, and innovations in nanotechnology-based formulations and hybrid actives.

key Segments

By Function:

  • Acne treatment
  • Pigmentation reduction
  • Repair & nourishment
  • Brightening

By Product Type:

  • Serums
  • Creams & lotions
  • Gels
  • Spot treatments

By Channel:

  • E-commerce
  • Pharmacies
  • Mass retail
  • Specialty beauty stores

By Claim:

  • Dermatologist-tested
  • Vegan
  • Clinical-grade
  • Clean-label

By Region:

  • North America
  • Latin America
  • Europe
  • East Asia
  • South Asia & Pacific
  • Middle East and Africa

Table of Content

  1. Executive Summary
    • Global Market Outlook
    • Demand-side Trends
    • Supply-side Trends
    • Technology Roadmap Analysis
    • Analysis and Recommendations
  2. Market Overview
    • Market Coverage / Taxonomy
    • Market Definition / Scope / Limitations
  3. Market Background
    • Market Dynamics
      • Drivers
      • Restraints
      • Opportunity
      • Trends
    • Scenario Forecast
      • Demand in Optimistic Scenario
      • Demand in Likely Scenario
      • Demand in Conservative Scenario
    • Opportunity Map Analysis
    • Product Life Cycle Analysis
    • Supply Chain Analysis
      • Supply Side Participants and their Roles
        • Producers
        • Mid-Level Participants (Traders/ Agents/ Brokers)
        • Wholesalers and Distributors
      • Value Added and Value Created at Node in the Supply Chain
      • List of Raw Material Suppliers
      • List of Existing and Potential Buyer’s
    • Investment Feasibility Matrix
    • Value Chain Analysis
      • Profit Margin Analysis
      • Wholesalers and Distributors
      • Retailers
    • PESTLE and Porter’s Analysis
    • Regulatory Landscape
      • By Key Regions
      • By Key Countries
    • Regional Parent Market Outlook
    • Production and Consumption Statistics
    • Import and Export Statistics
  4. Global Market Analysis 2020 to 2024 and Forecast, 2025 to 2035
    • Historical Market Size Value (USD Million) & Volume (Units) Analysis, 2020 to 2024
    • Current and Future Market Size Value (USD Million) & Volume (Units) Projections, 2025 to 2035
      • Y-o-Y Growth Trend Analysis
      • Absolute $ Opportunity Analysis
  5. Global Market Analysis 2020 to 2024 and Forecast 2025 to 2035, By Function
    • Introduction / Key Findings
    • Historical Market Size Value (USD Million) & Volume (Units) Analysis By Function, 2020 to 2024
    • Current and Future Market Size Value (USD Million) & Volume (Units) Analysis and Forecast By Function, 2025 to 2035
      • Acne treatment
      • Pigmentation reduction
      • Repair & nourishment
      • Brightening
    • Y-o-Y Growth Trend Analysis By Function, 2020 to 2024
    • Absolute $ Opportunity Analysis By Function, 2025 to 2035
  6. Global Market Analysis 2020 to 2024 and Forecast 2025 to 2035, By Product Type
    • Introduction / Key Findings
    • Historical Market Size Value (USD Million) & Volume (Units) Analysis By Product Type, 2020 to 2024
    • Current and Future Market Size Value (USD Million) & Volume (Units) Analysis and Forecast By Product Type, 2025 to 2035
      • Serums
      • Creams & lotions
      • Gels
      • Spot treatments
    • Y-o-Y Growth Trend Analysis By Product Type, 2020 to 2024
    • Absolute $ Opportunity Analysis By Product Type, 2025 to 2035
  7. Global Market Analysis 2020 to 2024 and Forecast 2025 to 2035, By Channel
    • Introduction / Key Findings
    • Historical Market Size Value (USD Million) & Volume (Units) Analysis By Channel, 2020 to 2024
    • Current and Future Market Size Value (USD Million) & Volume (Units) Analysis and Forecast By Channel, 2025 to 2035
      • E-commerce
      • Pharmacies
      • Mass retail
      • Specialty beauty stores
    • Y-o-Y Growth Trend Analysis By Channel, 2020 to 2024
    • Absolute $ Opportunity Analysis By Channel, 2025 to 2035
  8. Global Market Analysis 2020 to 2024 and Forecast 2025 to 2035, By Claim
    • Introduction / Key Findings
    • Historical Market Size Value (USD Million) & Volume (Units) Analysis By Claim, 2020 to 2024
    • Current and Future Market Size Value (USD Million) & Volume (Units) Analysis and Forecast By Claim, 2025 to 2035
      • Dermatologist-tested
      • Vegan
      • Clinical-grade
      • Clean-label
    • Y-o-Y Growth Trend Analysis By Claim, 2020 to 2024
    • Absolute $ Opportunity Analysis By Claim, 2025 to 2035
  9. Global Market Analysis 2020 to 2024 and Forecast 2025 to 2035, By Region
    • Introduction
    • Historical Market Size Value (USD Million) & Volume (Units) Analysis By Region, 2020 to 2024
    • Current Market Size Value (USD Million) & Volume (Units) Analysis and Forecast By Region, 2025 to 2035
      • North America
      • Latin America
      • Europe
      • East Asia
      • South Asia & Pacific
      • Middle East and Africa
    • Market Attractiveness Analysis By Region
  10. North America Market Analysis 2020 to 2024 and Forecast 2025 to 2035, By Country
    • Historical Market Size Value (USD Million) & Volume (Units) Trend Analysis By Market Taxonomy, 2020 to 2024
    • Market Size Value (USD Million) & Volume (Units) Forecast By Market Taxonomy, 2025 to 2035
      • By Country
        • USA
        • Canada
      • By Function
      • By Product Type
      • By Channel
      • By Claim
    • Market Attractiveness Analysis
      • By Country
      • By Function
      • By Product Type
      • By Channel
      • By Claim
    • Key Takeaways
  11. Latin America Market Analysis 2020 to 2024 and Forecast 2025 to 2035, By Country
    • Historical Market Size Value (USD Million) & Volume (Units) Trend Analysis By Market Taxonomy, 2020 to 2024
    • Market Size Value (USD Million) & Volume (Units) Forecast By Market Taxonomy, 2025 to 2035
      • By Country
        • Brazil
        • Mexico
        • Colombia
        • Rest of Latin America
      • By Function
      • By Product Type
      • By Channel
      • By Claim
    • Market Attractiveness Analysis
      • By Country
      • By Function
      • By Product Type
      • By Channel
      • By Claim
    • Key Takeaways
  12. Europe Market Analysis 2020 to 2024 and Forecast 2025 to 2035, By Country
    • Historical Market Size Value (USD Million) & Volume (Units) Trend Analysis By Market Taxonomy, 2020 to 2024
    • Market Size Value (USD Million) & Volume (Units) Forecast By Market Taxonomy, 2025 to 2035
      • By Country
        • Germany
        • UK
        • France
        • Italy
        • Spain
        • Belgium
        • Netherlands
        • Nordic
        • Switzerland
        • Russia
        • Poland
        • Rest of Europe
      • By Function
      • By Product Type
      • By Channel
      • By Claim
    • Market Attractiveness Analysis
      • By Country
      • By Function
      • By Product Type
      • By Channel
      • By Claim
    • Key Takeaways
  13. East Asia Market Analysis 2020 to 2024 and Forecast 2025 to 2035, By Country
    • Historical Market Size Value (USD Million) & Volume (Units) Trend Analysis By Market Taxonomy, 2020 to 2024
    • Market Size Value (USD Million) & Volume (Units) Forecast By Market Taxonomy, 2025 to 2035
      • By Country
        • China
        • Japan
        • South Korea
      • By Function
      • By Product Type
      • By Channel
      • By Claim
    • Market Attractiveness Analysis
      • By Country
      • By Function
      • By Product Type
      • By Channel
      • By Claim
    • Key Takeaways
  14. South Asia & Pacific Market Analysis 2020 to 2024 and Forecast 2025 to 2035, By Country
    • Historical Market Size Value (USD Million) & Volume (Units) Trend Analysis By Market Taxonomy, 2020 to 2024
    • Market Size Value (USD Million) & Volume (Units) Forecast By Market Taxonomy, 2025 to 2035
      • By Country
        • India
        • Thailand
        • Malaysia
        • Indonesia
        • Singapore
        • Vietnam
        • Australia
        • New Zealand
        • Rest of South Asia
      • By Function
      • By Product Type
      • By Channel
      • By Claim
    • Market Attractiveness Analysis
      • By Country
      • By Function
      • By Product Type
      • By Channel
      • By Claim
    • Key Takeaways
  15. Middle East and Africa Market Analysis 2020 to 2024 and Forecast 2025 to 2035, By Country
    • Historical Market Size Value (USD Million) & Volume (Units) Trend Analysis By Market Taxonomy, 2020 to 2024
    • Market Size Value (USD Million) & Volume (Units) Forecast By Market Taxonomy, 2025 to 2035
      • By Country
        • Turkey
        • UAE
        • Saudi Arabia
        • Israel
        • Other GCC Countries
        • North Africa
        • South Africa
      • By Function
      • By Product Type
      • By Channel
      • By Claim
    • Market Attractiveness Analysis
      • By Country
      • By Function
      • By Product Type
      • By Channel
      • By Claim
    • Key Takeaways
  16. Key Countries Market Analysis
    • USA
      • Pricing Analysis
      • Market Share Analysis, 2024
        • By Function
        • By Product Type
        • By Channel
        • By Claim
    • Canada
      • Pricing Analysis
      • Market Share Analysis, 2024
        • By Function
        • By Product Type
        • By Channel
        • By Claim
    • Brazil
      • Pricing Analysis
      • Market Share Analysis, 2024
        • By Function
        • By Product Type
        • By Channel
        • By Claim
    • Mexico
      • Pricing Analysis
      • Market Share Analysis, 2024
        • By Function
        • By Product Type
        • By Channel
        • By Claim
    • Colombia
      • Pricing Analysis
      • Market Share Analysis, 2024
        • By Function
        • By Product Type
        • By Channel
        • By Claim
    • Germany
      • Pricing Analysis
      • Market Share Analysis, 2024
        • By Function
        • By Product Type
        • By Channel
        • By Claim
    • UK
      • Pricing Analysis
      • Market Share Analysis, 2024
        • By Function
        • By Product Type
        • By Channel
        • By Claim
    • France
      • Pricing Analysis
      • Market Share Analysis, 2024
        • By Function
        • By Product Type
        • By Channel
        • By Claim
    • Italy
      • Pricing Analysis
      • Market Share Analysis, 2024
        • By Function
        • By Product Type
        • By Channel
        • By Claim
    • Spain
      • Pricing Analysis
      • Market Share Analysis, 2024
        • By Function
        • By Product Type
        • By Channel
        • By Claim
    • Belgium
      • Pricing Analysis
      • Market Share Analysis, 2024
        • By Function
        • By Product Type
        • By Channel
        • By Claim
    • Netherlands
      • Pricing Analysis
      • Market Share Analysis, 2024
        • By Function
        • By Product Type
        • By Channel
        • By Claim
    • Nordic
      • Pricing Analysis
      • Market Share Analysis, 2024
        • By Function
        • By Product Type
        • By Channel
        • By Claim
    • Switzerland
      • Pricing Analysis
      • Market Share Analysis, 2024
        • By Function
        • By Product Type
        • By Channel
        • By Claim
    • Russia
      • Pricing Analysis
      • Market Share Analysis, 2024
        • By Function
        • By Product Type
        • By Channel
        • By Claim
    • Poland
      • Pricing Analysis
      • Market Share Analysis, 2024
        • By Function
        • By Product Type
        • By Channel
        • By Claim
    • China
      • Pricing Analysis
      • Market Share Analysis, 2024
        • By Function
        • By Product Type
        • By Channel
        • By Claim
    • Japan
      • Pricing Analysis
      • Market Share Analysis, 2024
        • By Function
        • By Product Type
        • By Channel
        • By Claim
    • South Korea
      • Pricing Analysis
      • Market Share Analysis, 2024
        • By Function
        • By Product Type
        • By Channel
        • By Claim
    • India
      • Pricing Analysis
      • Market Share Analysis, 2024
        • By Function
        • By Product Type
        • By Channel
        • By Claim
    • Thailand
      • Pricing Analysis
      • Market Share Analysis, 2024
        • By Function
        • By Product Type
        • By Channel
        • By Claim
    • Indonesia
      • Pricing Analysis
      • Market Share Analysis, 2024
        • By Function
        • By Product Type
        • By Channel
        • By Claim
    • Australia
      • Pricing Analysis
      • Market Share Analysis, 2024
        • By Function
        • By Product Type
        • By Channel
        • By Claim
    • New Zealand
      • Pricing Analysis
      • Market Share Analysis, 2024
        • By Function
        • By Product Type
        • By Channel
        • By Claim
    • Turkey
      • Pricing Analysis
      • Market Share Analysis, 2024
        • By Function
        • By Product Type
        • By Channel
        • By Claim
    • UAE
      • Pricing Analysis
      • Market Share Analysis, 2024
        • By Function
        • By Product Type
        • By Channel
        • By Claim
    • Saudi Arabia
      • Pricing Analysis
      • Market Share Analysis, 2024
        • By Function
        • By Product Type
        • By Channel
        • By Claim
    • Israel
      • Pricing Analysis
      • Market Share Analysis, 2024
        • By Function
        • By Product Type
        • By Channel
        • By Claim
    • North Africa
      • Pricing Analysis
      • Market Share Analysis, 2024
        • By Function
        • By Product Type
        • By Channel
        • By Claim
    • South Africa
      • Pricing Analysis
      • Market Share Analysis, 2024
        • By Function
        • By Product Type
        • By Channel
        • By Claim
  17. Market Structure Analysis
    • Competition Dashboard
    • Competition Benchmarking
    • Market Share Analysis of Top Players
      • By Regional
      • By Function
      • By Product Type
      • By Channel
      • By Claim
  18. Competition Analysis
    • Competition Deep Dive
      • Paula’s Choice
        • Overview
        • Product Portfolio
        • Profitability by Market Segments (Product/Age /Sales Channel/Region)
        • Sales Footprint
        • Strategy Overview
          • Marketing Strategy
          • Product Strategy
          • Channel Strategy
      • The Ordinary
        • Overview
        • Product Portfolio
        • Profitability by Market Segments (Product/Age /Sales Channel/Region)
        • Sales Footprint
        • Strategy Overview
          • Marketing Strategy
          • Product Strategy
          • Channel Strategy
      • SkinCeuticals
        • Overview
        • Product Portfolio
        • Profitability by Market Segments (Product/Age /Sales Channel/Region)
        • Sales Footprint
        • Strategy Overview
          • Marketing Strategy
          • Product Strategy
          • Channel Strategy
      • Murad
        • Overview
        • Product Portfolio
        • Profitability by Market Segments (Product/Age /Sales Channel/Region)
        • Sales Footprint
        • Strategy Overview
          • Marketing Strategy
          • Product Strategy
          • Channel Strategy
      • Sesderma
        • Overview
        • Product Portfolio
        • Profitability by Market Segments (Product/Age /Sales Channel/Region)
        • Sales Footprint
        • Strategy Overview
          • Marketing Strategy
          • Product Strategy
          • Channel Strategy
      • Eucerin
        • Overview
        • Product Portfolio
        • Profitability by Market Segments (Product/Age /Sales Channel/Region)
        • Sales Footprint
        • Strategy Overview
          • Marketing Strategy
          • Product Strategy
          • Channel Strategy
      • La Roche-Posay
        • Overview
        • Product Portfolio
        • Profitability by Market Segments (Product/Age /Sales Channel/Region)
        • Sales Footprint
        • Strategy Overview
          • Marketing Strategy
          • Product Strategy
          • Channel Strategy
      • Azelique
        • Overview
        • Product Portfolio
        • Profitability by Market Segments (Product/Age /Sales Channel/Region)
        • Sales Footprint
        • Strategy Overview
          • Marketing Strategy
          • Product Strategy
          • Channel Strategy
      • Glytone
        • Overview
        • Product Portfolio
        • Profitability by Market Segments (Product/Age /Sales Channel/Region)
        • Sales Footprint
        • Strategy Overview
          • Marketing Strategy
          • Product Strategy
          • Channel Strategy
      • Allergan
        • Overview
        • Product Portfolio
        • Profitability by Market Segments (Product/Age /Sales Channel/Region)
        • Sales Footprint
        • Strategy Overview
          • Marketing Strategy
          • Product Strategy
          • Channel Strategy
  19. Assumptions & Acronyms Used
  20. Research Methodology

List of Tables

  • Table 1: Global Market Value (USD Million) Forecast by Region, 2020-2035
  • Table 2: Global Market Volume (Units) Forecast by Region, 2020-2035
  • Table 3: Global Market Value (USD Million) Forecast by Function, 2020-2035
  • Table 4: Global Market Volume (Units) Forecast by Function, 2020-2035
  • Table 5: Global Market Value (USD Million) Forecast by Product Type, 2020-2035
  • Table 6: Global Market Volume (Units) Forecast by Product Type, 2020-2035
  • Table 7: Global Market Value (USD Million) Forecast by Channel, 2020-2035
  • Table 8: Global Market Volume (Units) Forecast by Channel, 2020-2035
  • Table 9: Global Market Value (USD Million) Forecast by Claim, 2020-2035
  • Table 10: Global Market Volume (Units) Forecast by Claim, 2020-2035
  • Table 11: North America Market Value (USD Million) Forecast by Country, 2020-2035
  • Table 12: North America Market Volume (Units) Forecast by Country, 2020-2035
  • Table 13: North America Market Value (USD Million) Forecast by Function, 2020-2035
  • Table 14: North America Market Volume (Units) Forecast by Function, 2020-2035
  • Table 15: North America Market Value (USD Million) Forecast by Product Type, 2020-2035
  • Table 16: North America Market Volume (Units) Forecast by Product Type, 2020-2035
  • Table 17: North America Market Value (USD Million) Forecast by Channel, 2020-2035
  • Table 18: North America Market Volume (Units) Forecast by Channel, 2020-2035
  • Table 19: North America Market Value (USD Million) Forecast by Claim, 2020-2035
  • Table 20: North America Market Volume (Units) Forecast by Claim, 2020-2035
  • Table 21: Latin America Market Value (USD Million) Forecast by Country, 2020-2035
  • Table 22: Latin America Market Volume (Units) Forecast by Country, 2020-2035
  • Table 23: Latin America Market Value (USD Million) Forecast by Function, 2020-2035
  • Table 24: Latin America Market Volume (Units) Forecast by Function, 2020-2035
  • Table 25: Latin America Market Value (USD Million) Forecast by Product Type, 2020-2035
  • Table 26: Latin America Market Volume (Units) Forecast by Product Type, 2020-2035
  • Table 27: Latin America Market Value (USD Million) Forecast by Channel, 2020-2035
  • Table 28: Latin America Market Volume (Units) Forecast by Channel, 2020-2035
  • Table 29: Latin America Market Value (USD Million) Forecast by Claim, 2020-2035
  • Table 30: Latin America Market Volume (Units) Forecast by Claim, 2020-2035
  • Table 31: Europe Market Value (USD Million) Forecast by Country, 2020-2035
  • Table 32: Europe Market Volume (Units) Forecast by Country, 2020-2035
  • Table 33: Europe Market Value (USD Million) Forecast by Function, 2020-2035
  • Table 34: Europe Market Volume (Units) Forecast by Function, 2020-2035
  • Table 35: Europe Market Value (USD Million) Forecast by Product Type, 2020-2035
  • Table 36: Europe Market Volume (Units) Forecast by Product Type, 2020-2035
  • Table 37: Europe Market Value (USD Million) Forecast by Channel, 2020-2035
  • Table 38: Europe Market Volume (Units) Forecast by Channel, 2020-2035
  • Table 39: Europe Market Value (USD Million) Forecast by Claim, 2020-2035
  • Table 40: Europe Market Volume (Units) Forecast by Claim, 2020-2035
  • Table 41: East Asia Market Value (USD Million) Forecast by Country, 2020-2035
  • Table 42: East Asia Market Volume (Units) Forecast by Country, 2020-2035
  • Table 43: East Asia Market Value (USD Million) Forecast by Function, 2020-2035
  • Table 44: East Asia Market Volume (Units) Forecast by Function, 2020-2035
  • Table 45: East Asia Market Value (USD Million) Forecast by Product Type, 2020-2035
  • Table 46: East Asia Market Volume (Units) Forecast by Product Type, 2020-2035
  • Table 47: East Asia Market Value (USD Million) Forecast by Channel, 2020-2035
  • Table 48: East Asia Market Volume (Units) Forecast by Channel, 2020-2035
  • Table 49: East Asia Market Value (USD Million) Forecast by Claim, 2020-2035
  • Table 50: East Asia Market Volume (Units) Forecast by Claim, 2020-2035
  • Table 51: South Asia & Pacific Market Value (USD Million) Forecast by Country, 2020-2035
  • Table 52: South Asia & Pacific Market Volume (Units) Forecast by Country, 2020-2035
  • Table 53: South Asia & Pacific Market Value (USD Million) Forecast by Function, 2020-2035
  • Table 54: South Asia & Pacific Market Volume (Units) Forecast by Function, 2020-2035
  • Table 55: South Asia & Pacific Market Value (USD Million) Forecast by Product Type, 2020-2035
  • Table 56: South Asia & Pacific Market Volume (Units) Forecast by Product Type, 2020-2035
  • Table 57: South Asia & Pacific Market Value (USD Million) Forecast by Channel, 2020-2035
  • Table 58: South Asia & Pacific Market Volume (Units) Forecast by Channel, 2020-2035
  • Table 59: South Asia & Pacific Market Value (USD Million) Forecast by Claim, 2020-2035
  • Table 60: South Asia & Pacific Market Volume (Units) Forecast by Claim, 2020-2035
  • Table 61: Middle East and Africa Market Value (USD Million) Forecast by Country, 2020-2035
  • Table 62: Middle East and Africa Market Volume (Units) Forecast by Country, 2020-2035
  • Table 63: Middle East and Africa Market Value (USD Million) Forecast by Function, 2020-2035
  • Table 64: Middle East and Africa Market Volume (Units) Forecast by Function, 2020-2035
  • Table 65: Middle East and Africa Market Value (USD Million) Forecast by Product Type, 2020-2035
  • Table 66: Middle East and Africa Market Volume (Units) Forecast by Product Type, 2020-2035
  • Table 67: Middle East and Africa Market Value (USD Million) Forecast by Channel, 2020-2035
  • Table 68: Middle East and Africa Market Volume (Units) Forecast by Channel, 2020-2035
  • Table 69: Middle East and Africa Market Value (USD Million) Forecast by Claim, 2020-2035
  • Table 70: Middle East and Africa Market Volume (Units) Forecast by Claim, 2020-2035

List of Figures

  • Figure 1: Global Market Value (USD Million) by Function, 2025-2035
  • Figure 2: Global Market Value (USD Million) by Product Type, 2025-2035
  • Figure 3: Global Market Value (USD Million) by Channel, 2025-2035
  • Figure 4: Global Market Value (USD Million) by Claim, 2025-2035
  • Figure 5: Global Market Value (USD Million) by Region, 2025-2035
  • Figure 6: Global Market Value (USD Million) Analysis by Region, 2020-2035
  • Figure 7: Global Market Volume (Units) Analysis by Region, 2020-2035
  • Figure 8: Global Market Value Share (%) and BPS Analysis by Region, 2025-2035
  • Figure 9: Global Market Y-o-Y Growth (%) Projections by Region, 2025-2035
  • Figure 10: Global Market Value (USD Million) Analysis by Function, 2020-2035
  • Figure 11: Global Market Volume (Units) Analysis by Function, 2020-2035
  • Figure 12: Global Market Value Share (%) and BPS Analysis by Function, 2025-2035
  • Figure 13: Global Market Y-o-Y Growth (%) Projections by Function, 2025-2035
  • Figure 14: Global Market Value (USD Million) Analysis by Product Type, 2020-2035
  • Figure 15: Global Market Volume (Units) Analysis by Product Type, 2020-2035
  • Figure 16: Global Market Value Share (%) and BPS Analysis by Product Type, 2025-2035
  • Figure 17: Global Market Y-o-Y Growth (%) Projections by Product Type, 2025-2035
  • Figure 18: Global Market Value (USD Million) Analysis by Channel, 2020-2035
  • Figure 19: Global Market Volume (Units) Analysis by Channel, 2020-2035
  • Figure 20: Global Market Value Share (%) and BPS Analysis by Channel, 2025-2035
  • Figure 21: Global Market Y-o-Y Growth (%) Projections by Channel, 2025-2035
  • Figure 22: Global Market Value (USD Million) Analysis by Claim, 2020-2035
  • Figure 23: Global Market Volume (Units) Analysis by Claim, 2020-2035
  • Figure 24: Global Market Value Share (%) and BPS Analysis by Claim, 2025-2035
  • Figure 25: Global Market Y-o-Y Growth (%) Projections by Claim, 2025-2035
  • Figure 26: Global Market Attractiveness by Function, 2025-2035
  • Figure 27: Global Market Attractiveness by Product Type, 2025-2035
  • Figure 28: Global Market Attractiveness by Channel, 2025-2035
  • Figure 29: Global Market Attractiveness by Claim, 2025-2035
  • Figure 30: Global Market Attractiveness by Region, 2025-2035
  • Figure 31: North America Market Value (USD Million) by Function, 2025-2035
  • Figure 32: North America Market Value (USD Million) by Product Type, 2025-2035
  • Figure 33: North America Market Value (USD Million) by Channel, 2025-2035
  • Figure 34: North America Market Value (USD Million) by Claim, 2025-2035
  • Figure 35: North America Market Value (USD Million) by Country, 2025-2035
  • Figure 36: North America Market Value (USD Million) Analysis by Country, 2020-2035
  • Figure 37: North America Market Volume (Units) Analysis by Country, 2020-2035
  • Figure 38: North America Market Value Share (%) and BPS Analysis by Country, 2025-2035
  • Figure 39: North America Market Y-o-Y Growth (%) Projections by Country, 2025-2035
  • Figure 40: North America Market Value (USD Million) Analysis by Function, 2020-2035
  • Figure 41: North America Market Volume (Units) Analysis by Function, 2020-2035
  • Figure 42: North America Market Value Share (%) and BPS Analysis by Function, 2025-2035
  • Figure 43: North America Market Y-o-Y Growth (%) Projections by Function, 2025-2035
  • Figure 44: North America Market Value (USD Million) Analysis by Product Type, 2020-2035
  • Figure 45: North America Market Volume (Units) Analysis by Product Type, 2020-2035
  • Figure 46: North America Market Value Share (%) and BPS Analysis by Product Type, 2025-2035
  • Figure 47: North America Market Y-o-Y Growth (%) Projections by Product Type, 2025-2035
  • Figure 48: North America Market Value (USD Million) Analysis by Channel, 2020-2035
  • Figure 49: North America Market Volume (Units) Analysis by Channel, 2020-2035
  • Figure 50: North America Market Value Share (%) and BPS Analysis by Channel, 2025-2035
  • Figure 51: North America Market Y-o-Y Growth (%) Projections by Channel, 2025-2035
  • Figure 52: North America Market Value (USD Million) Analysis by Claim, 2020-2035
  • Figure 53: North America Market Volume (Units) Analysis by Claim, 2020-2035
  • Figure 54: North America Market Value Share (%) and BPS Analysis by Claim, 2025-2035
  • Figure 55: North America Market Y-o-Y Growth (%) Projections by Claim, 2025-2035
  • Figure 56: North America Market Attractiveness by Function, 2025-2035
  • Figure 57: North America Market Attractiveness by Product Type, 2025-2035
  • Figure 58: North America Market Attractiveness by Channel, 2025-2035
  • Figure 59: North America Market Attractiveness by Claim, 2025-2035
  • Figure 60: North America Market Attractiveness by Country, 2025-2035
  • Figure 61: Latin America Market Value (USD Million) by Function, 2025-2035
  • Figure 62: Latin America Market Value (USD Million) by Product Type, 2025-2035
  • Figure 63: Latin America Market Value (USD Million) by Channel, 2025-2035
  • Figure 64: Latin America Market Value (USD Million) by Claim, 2025-2035
  • Figure 65: Latin America Market Value (USD Million) by Country, 2025-2035
  • Figure 66: Latin America Market Value (USD Million) Analysis by Country, 2020-2035
  • Figure 67: Latin America Market Volume (Units) Analysis by Country, 2020-2035
  • Figure 68: Latin America Market Value Share (%) and BPS Analysis by Country, 2025-2035
  • Figure 69: Latin America Market Y-o-Y Growth (%) Projections by Country, 2025-2035
  • Figure 70: Latin America Market Value (USD Million) Analysis by Function, 2020-2035
  • Figure 71: Latin America Market Volume (Units) Analysis by Function, 2020-2035
  • Figure 72: Latin America Market Value Share (%) and BPS Analysis by Function, 2025-2035
  • Figure 73: Latin America Market Y-o-Y Growth (%) Projections by Function, 2025-2035
  • Figure 74: Latin America Market Value (USD Million) Analysis by Product Type, 2020-2035
  • Figure 75: Latin America Market Volume (Units) Analysis by Product Type, 2020-2035
  • Figure 76: Latin America Market Value Share (%) and BPS Analysis by Product Type, 2025-2035
  • Figure 77: Latin America Market Y-o-Y Growth (%) Projections by Product Type, 2025-2035
  • Figure 78: Latin America Market Value (USD Million) Analysis by Channel, 2020-2035
  • Figure 79: Latin America Market Volume (Units) Analysis by Channel, 2020-2035
  • Figure 80: Latin America Market Value Share (%) and BPS Analysis by Channel, 2025-2035
  • Figure 81: Latin America Market Y-o-Y Growth (%) Projections by Channel, 2025-2035
  • Figure 82: Latin America Market Value (USD Million) Analysis by Claim, 2020-2035
  • Figure 83: Latin America Market Volume (Units) Analysis by Claim, 2020-2035
  • Figure 84: Latin America Market Value Share (%) and BPS Analysis by Claim, 2025-2035
  • Figure 85: Latin America Market Y-o-Y Growth (%) Projections by Claim, 2025-2035
  • Figure 86: Latin America Market Attractiveness by Function, 2025-2035
  • Figure 87: Latin America Market Attractiveness by Product Type, 2025-2035
  • Figure 88: Latin America Market Attractiveness by Channel, 2025-2035
  • Figure 89: Latin America Market Attractiveness by Claim, 2025-2035
  • Figure 90: Latin America Market Attractiveness by Country, 2025-2035
  • Figure 91: Europe Market Value (USD Million) by Function, 2025-2035
  • Figure 92: Europe Market Value (USD Million) by Product Type, 2025-2035
  • Figure 93: Europe Market Value (USD Million) by Channel, 2025-2035
  • Figure 94: Europe Market Value (USD Million) by Claim, 2025-2035
  • Figure 95: Europe Market Value (USD Million) by Country, 2025-2035
  • Figure 96: Europe Market Value (USD Million) Analysis by Country, 2020-2035
  • Figure 97: Europe Market Volume (Units) Analysis by Country, 2020-2035
  • Figure 98: Europe Market Value Share (%) and BPS Analysis by Country, 2025-2035
  • Figure 99: Europe Market Y-o-Y Growth (%) Projections by Country, 2025-2035
  • Figure 100: Europe Market Value (USD Million) Analysis by Function, 2020-2035
  • Figure 101: Europe Market Volume (Units) Analysis by Function, 2020-2035
  • Figure 102: Europe Market Value Share (%) and BPS Analysis by Function, 2025-2035
  • Figure 103: Europe Market Y-o-Y Growth (%) Projections by Function, 2025-2035
  • Figure 104: Europe Market Value (USD Million) Analysis by Product Type, 2020-2035
  • Figure 105: Europe Market Volume (Units) Analysis by Product Type, 2020-2035
  • Figure 106: Europe Market Value Share (%) and BPS Analysis by Product Type, 2025-2035
  • Figure 107: Europe Market Y-o-Y Growth (%) Projections by Product Type, 2025-2035
  • Figure 108: Europe Market Value (USD Million) Analysis by Channel, 2020-2035
  • Figure 109: Europe Market Volume (Units) Analysis by Channel, 2020-2035
  • Figure 110: Europe Market Value Share (%) and BPS Analysis by Channel, 2025-2035
  • Figure 111: Europe Market Y-o-Y Growth (%) Projections by Channel, 2025-2035
  • Figure 112: Europe Market Value (USD Million) Analysis by Claim, 2020-2035
  • Figure 113: Europe Market Volume (Units) Analysis by Claim, 2020-2035
  • Figure 114: Europe Market Value Share (%) and BPS Analysis by Claim, 2025-2035
  • Figure 115: Europe Market Y-o-Y Growth (%) Projections by Claim, 2025-2035
  • Figure 116: Europe Market Attractiveness by Function, 2025-2035
  • Figure 117: Europe Market Attractiveness by Product Type, 2025-2035
  • Figure 118: Europe Market Attractiveness by Channel, 2025-2035
  • Figure 119: Europe Market Attractiveness by Claim, 2025-2035
  • Figure 120: Europe Market Attractiveness by Country, 2025-2035
  • Figure 121: East Asia Market Value (USD Million) by Function, 2025-2035
  • Figure 122: East Asia Market Value (USD Million) by Product Type, 2025-2035
  • Figure 123: East Asia Market Value (USD Million) by Channel, 2025-2035
  • Figure 124: East Asia Market Value (USD Million) by Claim, 2025-2035
  • Figure 125: East Asia Market Value (USD Million) by Country, 2025-2035
  • Figure 126: East Asia Market Value (USD Million) Analysis by Country, 2020-2035
  • Figure 127: East Asia Market Volume (Units) Analysis by Country, 2020-2035
  • Figure 128: East Asia Market Value Share (%) and BPS Analysis by Country, 2025-2035
  • Figure 129: East Asia Market Y-o-Y Growth (%) Projections by Country, 2025-2035
  • Figure 130: East Asia Market Value (USD Million) Analysis by Function, 2020-2035
  • Figure 131: East Asia Market Volume (Units) Analysis by Function, 2020-2035
  • Figure 132: East Asia Market Value Share (%) and BPS Analysis by Function, 2025-2035
  • Figure 133: East Asia Market Y-o-Y Growth (%) Projections by Function, 2025-2035
  • Figure 134: East Asia Market Value (USD Million) Analysis by Product Type, 2020-2035
  • Figure 135: East Asia Market Volume (Units) Analysis by Product Type, 2020-2035
  • Figure 136: East Asia Market Value Share (%) and BPS Analysis by Product Type, 2025-2035
  • Figure 137: East Asia Market Y-o-Y Growth (%) Projections by Product Type, 2025-2035
  • Figure 138: East Asia Market Value (USD Million) Analysis by Channel, 2020-2035
  • Figure 139: East Asia Market Volume (Units) Analysis by Channel, 2020-2035
  • Figure 140: East Asia Market Value Share (%) and BPS Analysis by Channel, 2025-2035
  • Figure 141: East Asia Market Y-o-Y Growth (%) Projections by Channel, 2025-2035
  • Figure 142: East Asia Market Value (USD Million) Analysis by Claim, 2020-2035
  • Figure 143: East Asia Market Volume (Units) Analysis by Claim, 2020-2035
  • Figure 144: East Asia Market Value Share (%) and BPS Analysis by Claim, 2025-2035
  • Figure 145: East Asia Market Y-o-Y Growth (%) Projections by Claim, 2025-2035
  • Figure 146: East Asia Market Attractiveness by Function, 2025-2035
  • Figure 147: East Asia Market Attractiveness by Product Type, 2025-2035
  • Figure 148: East Asia Market Attractiveness by Channel, 2025-2035
  • Figure 149: East Asia Market Attractiveness by Claim, 2025-2035
  • Figure 150: East Asia Market Attractiveness by Country, 2025-2035
  • Figure 151: South Asia & Pacific Market Value (USD Million) by Function, 2025-2035
  • Figure 152: South Asia & Pacific Market Value (USD Million) by Product Type, 2025-2035
  • Figure 153: South Asia & Pacific Market Value (USD Million) by Channel, 2025-2035
  • Figure 154: South Asia & Pacific Market Value (USD Million) by Claim, 2025-2035
  • Figure 155: South Asia & Pacific Market Value (USD Million) by Country, 2025-2035
  • Figure 156: South Asia & Pacific Market Value (USD Million) Analysis by Country, 2020-2035
  • Figure 157: South Asia & Pacific Market Volume (Units) Analysis by Country, 2020-2035
  • Figure 158: South Asia & Pacific Market Value Share (%) and BPS Analysis by Country, 2025-2035
  • Figure 159: South Asia & Pacific Market Y-o-Y Growth (%) Projections by Country, 2025-2035
  • Figure 160: South Asia & Pacific Market Value (USD Million) Analysis by Function, 2020-2035
  • Figure 161: South Asia & Pacific Market Volume (Units) Analysis by Function, 2020-2035
  • Figure 162: South Asia & Pacific Market Value Share (%) and BPS Analysis by Function, 2025-2035
  • Figure 163: South Asia & Pacific Market Y-o-Y Growth (%) Projections by Function, 2025-2035
  • Figure 164: South Asia & Pacific Market Value (USD Million) Analysis by Product Type, 2020-2035
  • Figure 165: South Asia & Pacific Market Volume (Units) Analysis by Product Type, 2020-2035
  • Figure 166: South Asia & Pacific Market Value Share (%) and BPS Analysis by Product Type, 2025-2035
  • Figure 167: South Asia & Pacific Market Y-o-Y Growth (%) Projections by Product Type, 2025-2035
  • Figure 168: South Asia & Pacific Market Value (USD Million) Analysis by Channel, 2020-2035
  • Figure 169: South Asia & Pacific Market Volume (Units) Analysis by Channel, 2020-2035
  • Figure 170: South Asia & Pacific Market Value Share (%) and BPS Analysis by Channel, 2025-2035
  • Figure 171: South Asia & Pacific Market Y-o-Y Growth (%) Projections by Channel, 2025-2035
  • Figure 172: South Asia & Pacific Market Value (USD Million) Analysis by Claim, 2020-2035
  • Figure 173: South Asia & Pacific Market Volume (Units) Analysis by Claim, 2020-2035
  • Figure 174: South Asia & Pacific Market Value Share (%) and BPS Analysis by Claim, 2025-2035
  • Figure 175: South Asia & Pacific Market Y-o-Y Growth (%) Projections by Claim, 2025-2035
  • Figure 176: South Asia & Pacific Market Attractiveness by Function, 2025-2035
  • Figure 177: South Asia & Pacific Market Attractiveness by Product Type, 2025-2035
  • Figure 178: South Asia & Pacific Market Attractiveness by Channel, 2025-2035
  • Figure 179: South Asia & Pacific Market Attractiveness by Claim, 2025-2035
  • Figure 180: South Asia & Pacific Market Attractiveness by Country, 2025-2035
  • Figure 181: Middle East and Africa Market Value (USD Million) by Function, 2025-2035
  • Figure 182: Middle East and Africa Market Value (USD Million) by Product Type, 2025-2035
  • Figure 183: Middle East and Africa Market Value (USD Million) by Channel, 2025-2035
  • Figure 184: Middle East and Africa Market Value (USD Million) by Claim, 2025-2035
  • Figure 185: Middle East and Africa Market Value (USD Million) by Country, 2025-2035
  • Figure 186: Middle East and Africa Market Value (USD Million) Analysis by Country, 2020-2035
  • Figure 187: Middle East and Africa Market Volume (Units) Analysis by Country, 2020-2035
  • Figure 188: Middle East and Africa Market Value Share (%) and BPS Analysis by Country, 2025-2035
  • Figure 189: Middle East and Africa Market Y-o-Y Growth (%) Projections by Country, 2025-2035
  • Figure 190: Middle East and Africa Market Value (USD Million) Analysis by Function, 2020-2035
  • Figure 191: Middle East and Africa Market Volume (Units) Analysis by Function, 2020-2035
  • Figure 192: Middle East and Africa Market Value Share (%) and BPS Analysis by Function, 2025-2035
  • Figure 193: Middle East and Africa Market Y-o-Y Growth (%) Projections by Function, 2025-2035
  • Figure 194: Middle East and Africa Market Value (USD Million) Analysis by Product Type, 2020-2035
  • Figure 195: Middle East and Africa Market Volume (Units) Analysis by Product Type, 2020-2035
  • Figure 196: Middle East and Africa Market Value Share (%) and BPS Analysis by Product Type, 2025-2035
  • Figure 197: Middle East and Africa Market Y-o-Y Growth (%) Projections by Product Type, 2025-2035
  • Figure 198: Middle East and Africa Market Value (USD Million) Analysis by Channel, 2020-2035
  • Figure 199: Middle East and Africa Market Volume (Units) Analysis by Channel, 2020-2035
  • Figure 200: Middle East and Africa Market Value Share (%) and BPS Analysis by Channel, 2025-2035
  • Figure 201: Middle East and Africa Market Y-o-Y Growth (%) Projections by Channel, 2025-2035
  • Figure 202: Middle East and Africa Market Value (USD Million) Analysis by Claim, 2020-2035
  • Figure 203: Middle East and Africa Market Volume (Units) Analysis by Claim, 2020-2035
  • Figure 204: Middle East and Africa Market Value Share (%) and BPS Analysis by Claim, 2025-2035
  • Figure 205: Middle East and Africa Market Y-o-Y Growth (%) Projections by Claim, 2025-2035
  • Figure 206: Middle East and Africa Market Attractiveness by Function, 2025-2035
  • Figure 207: Middle East and Africa Market Attractiveness by Product Type, 2025-2035
  • Figure 208: Middle East and Africa Market Attractiveness by Channel, 2025-2035
  • Figure 209: Middle East and Africa Market Attractiveness by Claim, 2025-2035
  • Figure 210: Middle East and Africa Market Attractiveness by Country, 2025-2035

Frequently Asked Questions

How big is the Azelaic Acid Derivatives Market in 2025?

The Azelaic Acid Derivatives Market is estimated to be valued at USD 1,241.4 million in 2025.

What will be the size of the Azelaic Acid Derivatives Market in 2035?

The market size for the Azelaic Acid Derivatives Market is projected to reach USD 3,952.3 million by 2035.

How much will be the Azelaic Acid Derivatives Market growth between 2025 and 2035?

The Azelaic Acid Derivatives Market is expected to grow at a 12.3% CAGR between 2025 and 2035.

What are the key product types in the Azelaic Acid Derivatives Market?

The key product types in the Azelaic Acid Derivatives Market are creams/lotions, serums, gels, and spot treatments.

Which function segment will contribute significant share in the Azelaic Acid Derivatives Market in 2025?

In terms of function, the acne treatment segment will command 46.6% share in the Azelaic Acid Derivatives Market in 2025.

Explore Similar Insights

Future Market Insights

Azelaic Acid Derivatives Market