

- Market Size (2026)
- USD 36.2 Bn
- Forecast (2036)
- USD 57.9 Bn
- CAGR (2026 to 2036)
- 4.8%
How big is the Beauty & Cosmetic Packaging Market in 2026?
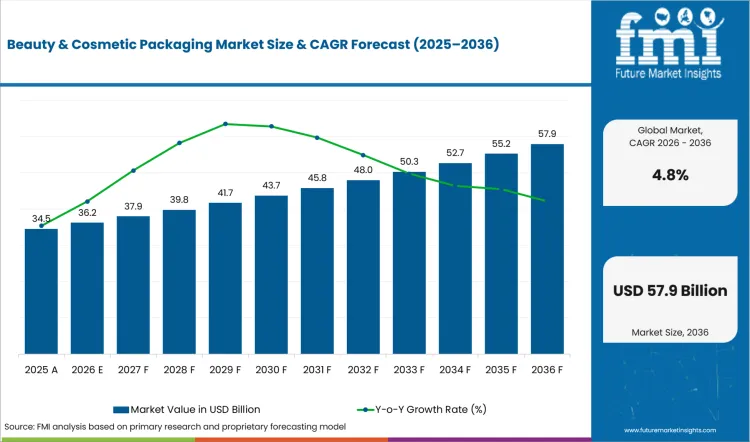
USD 36.2 billion in 2026 and USD 57.9 billion by 2036 at a 4.8% CAGR.
Demand for beauty and cosmetic packaging is projected to expand at a CAGR of 4.8% between 2026 and 2036, with the market valuation expected to increase from USD 36.2 billion in 2026 to USD 57.9 billion by 2036. Growth is supported by the strong presence of established packaging suppliers and ongoing investments in dispensing and skincare packaging solutions that address evolving brand and consumer requirements. Aptar’s Beauty business, for instance, supplies fragrance and facial skincare packaging formats that align with key demand trends in the cosmetic packaging industry. AptarGroup reported in February 2026 that its Beauty segment generated USD 1.309 billion in net sales during 2025, highlighting the commercial strength of advanced beauty packaging solutions and their contribution to overall market expansion.
In Asia Pacific, China and India are expected to support shorter package trials than Japan and Germany across new beauty launches. Newer brands often test several shapes before choosing one format for wider distribution through large retail networks. CHEMEXCIL published its annual report in September 2025 and valued India's cosmetics and toiletries exports at USD 2.711 billion during fiscal 2024-25. Established markets give more weight to finish consistency and formula contact records during supplier approval. Packaging teams use the beauty and personal care packaging analysis to compare tooling control with filling-line trials.
| Metric | Value |
|---|---|
| 2025 Market Size | USD 34.5 billion |
| 2026 Market Size | USD 36.2 billion |
| 2036 Market Size | USD 57.9 billion |
| Forecast CAGR (2026-2036) | 4.8% |
| Material Focus | Plastic (52.0% share in 2026) |
| Product Focus | Bottles (32.0% share in 2026) |
| Application Focus | Skincare (34.0% share in 2026) |
Summary of the Beauty & Cosmetic Packaging Market
| Market Signal | Commercial Impact |
|---|---|
| Demand and Growth Drivers | Beauty packaging plays a much larger role than simply holding a product. For brands, packaging protects product quality, shapes consumer perception and helps justify a product's price positioning.
|
| Product and Segment View | Plastic continues to dominate beauty packaging because it offers a balance of design flexibility and decorating options. Its adaptability makes it suitable for both mass-market products and premium beauty launches.
|
| Geography and Growth Outlook | Market dynamics vary considerably across regions. Compared with more mature markets, India and China often enable faster product launches because of their strong manufacturing ecosystems and extensive packaging supply chains.
|
| Competitive Landscape | Competition in the industry ranges from global dispensing specialists to highly focused beauty packaging suppliers. While product breadth remains important, suppliers are competing on technical expertise and innovation.
|
| Analyst Perspective | Successful packaging is rarely defined by appearance alone. The most effective packaging solutions balance branding objectives with practical considerations such as formula protection and production efficiency.
|
Source: FMI's proprietary forecasting model and primary research
How is the beauty & cosmetic packaging market segmented?
material, product, application, price tier, sustainability, and region
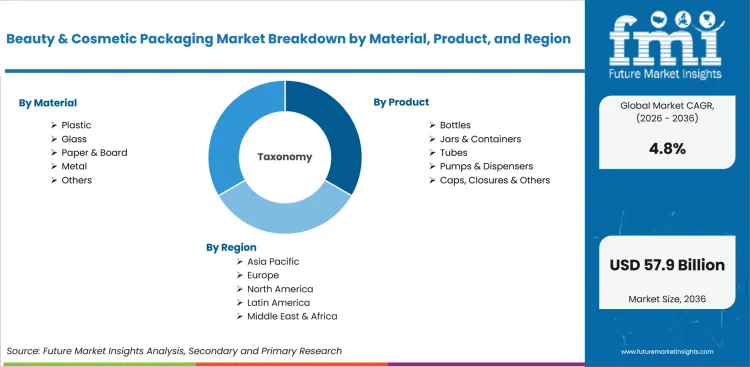
The market is segmented by material, product, application, price tier, sustainability, and region. Material segmentation includes plastic, glass, paperboard, and metal packaging used across different beauty and personal care formats. Product categories cover bottles, jars, tubes, pumps, and dispensing closures. Applications span skincare, haircare, color cosmetics, and fragrances across both mass-market and premium segments. Sustainability analysis compares conventional packaging with recycled, recyclable, and refillable alternatives. Regional assessment covers North America, Latin America, Europe, East Asia, South Asia and Pacific, Oceania, and the Middle East & Africa, with each region evaluated separately to reflect differences in demand patterns and market dynamics.
What supports demand for plastic within the material category?
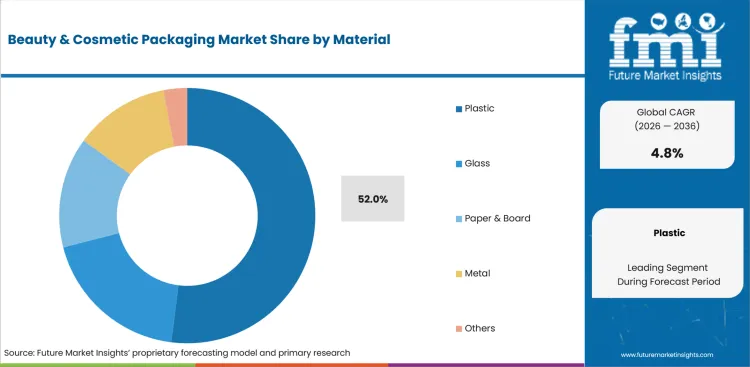
Formula contact and closure fit decide if a plastic format is ready for the first commercial design review. Aptar Beauty introduced its HDP pump in February 2025 with a 3.5 cc dose and a metal-free spring outside the dosage chamber. HDP shows why brand teams confirm product contact and shipping locks ahead of larger body care or haircare packaging programs.
- By material, plastic is projected to account for 52.0% in 2026 owing to its broad forming range. Plastic supports bottles and closures across several neck sizes used by beauty contract fillers during production. Color matching and surface decoration help brand teams distinguish mass or premium product lines at retail. Familiar plastic formats reduce the need for major filling-line changes during a controlled package refresh.
- Demand for plastic is expected to grow among skincare and haircare brands supported by its lower transport weight. Supplier reviews now combine recycled-content records with formula contact tests and closure checks during launch approval. The PCR cosmetic packaging study helps teams compare resin traceability before selecting a recycled-content supplier. Production approval follows after decoration adhesion remains stable across storage and transport tests under routine handling.
How are bottles positioned within the product category?
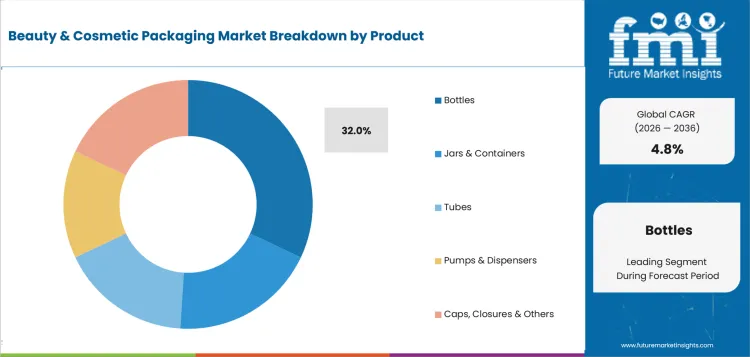
Bottle programs connect shelf appearance to filling speed and controlled dispensing across liquid beauty formulas. Quadpack introduced Dropify Bottle in January 2025 for oils and serums that need one-handed application. Dropify releases a controlled dose after the user presses the side button during a skincare routine.
- Bottles are set to hold 32.0% share in 2026 due to their broad use across lotions and serums. Standard neck finishes give brands several pump choices without changing the selected primary container shape. Contract fillers understand bottle handling across labeling and cartoning equipment during repeated commercial production runs. Familiar handling lowers trial risk during large production runs across several related product sizes and price tiers.
- Skincare and haircare teams are expected to purchase more bottles due to clean dosing and familiar shelf presentation. Smaller formats in the single-portion cosmetic packaging help brands test premium formulas before larger launches. A single bottle family supports travel and full-size products within one consistent visual identity across a coordinated launch. Consistent geometry protects shelf recognition across several retail price tiers during later range expansion programs.
What drives skincare demand within the application category?
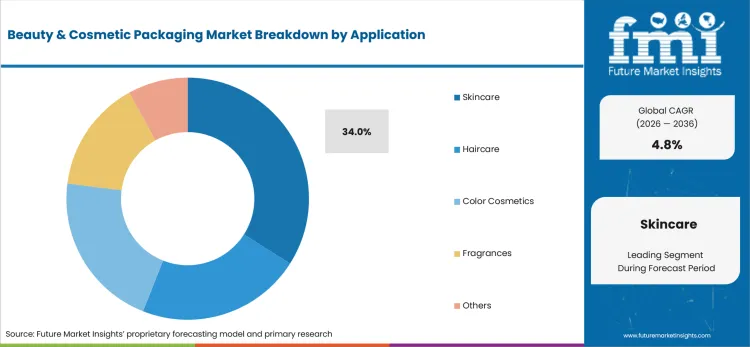
Skincare packaging carries high formula-protection risk because air exposure or poor dosing changes the user experience. Aptar Beauty introduced its Derma Series in May 2025 for dermocosmetic brands seeking controlled dispensing. Derma Series combines packaging design and regulatory support for sensitive formulas sold through dermocosmetic channels. Dermocosmetic teams therefore review the pack as a delivery system instead of treating it as a decorated container.
- By application, skincare is forecast to represent 34.0% in 2026 driven by frequent launches of creams and serums. These formulas need packs that protect product integrity and deliver a repeatable dose during daily consumer use. Skincare teams also review closure cleanliness after repeated opening and routine bathroom storage during consumer tests. Storage tests confirm that the selected format supports the intended daily-use period without leakage or visible residue.
- Premium skincare programs are expected to purchase more controlled-dosing packs due to formula protection and precise application. Brands compare pumps with the airless packaging outlook ahead of format selection for oxygen-sensitive products. Decorated samples then test shelf presence and hand feel against the intended retail price position.
What are the drivers, restraints, and opportunities in the beauty & cosmetic packaging market?
Driver: frequent product launches are expected to support package redesigns. Restraint: formula contact and decoration tests are anticipated to extend approval. Opportunity: refillable and airless formats are projected to widen repeat-use programs.
- Driver: product launches are expected to create recurring demand for packs that protect formulas and show a clear identity on shelf.
- Restraint: compatibility testing extends approval after a new resin or closure changes product contact and filling behavior.
- Opportunity: refillable and airless systems pair controlled dosing with a durable outer pack that supports repeated use.
Brand owners refresh packs to separate nearby formulas and support clear price steps across a product family. The USA Food and Drug Administration reported in July 2026 that 1,298,361 active cosmetic products were listed under MoCRA as of June 30, 2026. The listing volume increases the value of accurate labels and controlled package specifications during release. Suppliers improve their position by providing decorated samples with product contact records and a realistic route to repeat production.
A material change often stops after design review because decoration and product contact must be tested together. European Union packaging rules entered into force on February 11, 2025 under the Packaging and packaging waste regulation. The regulation is scheduled to apply from August 12, 2026 and places greater attention on recyclability or packaging reduction. European brand teams therefore request evidence for the complete pack during formal supplier approval reviews. A claim based on one component does not explain how the finished pump or closure performs.
Refill systems create room for suppliers that protect formulas and simplify replacement during daily use. Quadpack announced in July 2025 that its Kierspe plant added PET dip-in production for monomaterial lip-gloss bottles. Regional production is expected to shorten lead times and reduce dependence on distant components during new launch programs. The mono-material airless dispensers analysis helps brands compare refill mechanics with recycling routes before approving a complete pack.
Which country CAGRs are profiled in the beauty & cosmetic packaging market?
.webp "Top Country Growth Comparison Beauty & Cosmetic Packaging Market Cagr (2026 2036)")
| Country | CAGR |
|---|---|
| United States | 4.1% |
| China | 6.2% |
| India | 7.4% |
| Germany | 3.6% |
| France | 3.9% |
| Japan | 3.2% |
| South Korea | 5.6% |
Source: FMI's proprietary forecasting model and primary research
How do country-level CAGRs compare in the beauty & cosmetic packaging market?
Country growth reflects the pace of beauty launches and the distance between design teams or packaging plants. India and China support shorter trial cycles across expanding local brand portfolios and closely connected converting networks. Germany and Japan give more weight to finish consistency, while France retains luxury capability across fragrance and skincare. South Korea links fast brand feedback to nearby manufacturing partners serving export programs and repeated product launches. Country evidence uses HS 3304 beauty-product trade as a demand signal instead of a direct packaging value. These differences shape supplier selection around mold ownership and sampling speed or documentation quality during commercial planning.
- American brands manage national retail programs and frequent online product launches across several price tiers. Beauty and cosmetic packaging demand in the United States is forecast to rise at 4.1% CAGR over the forecast period. Data from UN Comtrade accessed in January 2026 showed 2024 United States exports under HS 3304 at USD 6.41 billion. International shipments require bottles and closures that retain appearance across long distribution routes and repeated handling. AptarGroup and Silgan Holdings provide domestic dispensing capability and launch support for these national programs. Brands are trying alternatives such as mini packaging to compare trial-size formats before committing to wider national volume.
- China-based beauty launches often move from concept to decorated sample inside a closely connected converting network. China is estimated to post 6.2% CAGR over the forecast period owing to local brands and rapid format testing. Export programs need stable decoration and secure closures across several destinations and product categories annually. For instance, UN Comtrade data retrieved in January 2026 recorded Chinese exports under HS 3304 at USD 4.77 billion during 2024.
- Indian brands combine premium presentation with strict target prices across skincare and color cosmetic launches. Adoption of beauty and cosmetic packaging in India is estimated to expand at 7.4% CAGR from 2026 to 2036. India’s trade base supports demand for local bottles and caps with several reliable decoration choices. Official UN Comtrade data in January 2026 placed India’s 2024 exports under HS 3304 at USD 542 million. Brands are valuing mold access and quick sampling before a launch scales across local production centers. FMI’s cosmetic filling machines outlook explains why pack geometry must fit available production equipment before nationwide distribution.
- German packaging decisions give repeatable production more weight than a dramatic prototype shown during an early design review. Industry in Germany is projected to record 3.6% CAGR over the assessment period supported by detailed approval and European material rules. International programs need stable decoration and traceable components across many destinations and related product families. A January 2026 extraction from UN Comtrade valued Germany’s 2024 exports under HS 3304 at USD 4.41 billion. Companies such as Gerresheimer and Quadpack provide regional manufacturing experience in rigid formats used for fragrance and skincare.
- France industry outlook is anticipated to advance at 3.9% CAGR over the assessment period led by luxury launches and specialist supply. French brands use packaging to carry luxury cues across fragrance and premium skincare without weakening daily dispensing performance. French export scale creates recurring work for glass bottles and custom closures serving international beauty brands. According to UN Comtrade data retrieved in January 2026, France exported USD 12.3 billion under HS 3304 during 2024. Repeat briefs depend on combining fine decoration with dependable filling and assembly across international product releases.
- Japanese brand teams expect a decorated pack to look identical across every batch and every refill component. Beauty and cosmetic packaging in Japan is predicted to advance at 3.2% CAGR from 2026 to 2036. UN Comtrade data downloaded in January 2026 showed Japan exported USD 3.54 billion under HS 3304 during 2024. Long-haul programs support demand for precise closures and surface finishes that survive extended distribution routes. Shiseido and Kao shape local expectations for compact formats and careful dosing in established domestic programs. Supplier selection rests on repeatability and controlled production records before visual novelty enters the final review.
- South Korean beauty brands shorten the feedback loop between online launches and packaging changes across skincare or makeup lines. Sales are forecast to expand at 5.6% CAGR during the assessment period reinforced by export-based product cycles. A January 2026 UN Comtrade query recorded South Korea’s 2024 exports under HS 3304 at USD 8.8 billion. Regional trade activity supports frequent demand for airless bottles and applicators used in regional brand programs.
Who are the notable companies in the beauty & cosmetic packaging market?
AptarGroup, Albéa Group, Amcor, Gerresheimer, HCP Packaging, Silgan Holdings, Quadpack, Toly Group, Cosmopak, and Libo Cosmetics are notable suppliers across dispensing, rigid formats, color cosmetics, and custom beauty packaging.
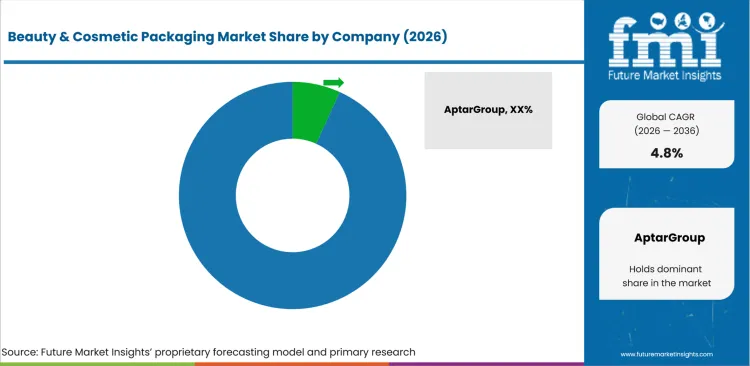
Competition combines global dispensing groups with specialists in glass and color cosmetics across mass or premium programs. Large suppliers suit brands that need one technical standard across several plants and product categories. Specialist companies remain relevant for unusual shapes or detailed decoration that requires close design work during tooling trials. Amcor completed its combination with Berry Global in April 2025 and now offers a broader packaging portfolio under one company. Procurement teams use the pump and dispenser packaging outlook to compare mechanism depth ahead of reviews on local sampling and repeat delivery. Final selection rests on formula contact evidence, mold ownership and practical support during filling-line trials.
- AptarGroup and Silgan Holdings compete directly in pumps and dispensing closures for skincare or personal care lines. Their position rests on established mechanisms and technical support for brands that need repeat dosing across several filling locations and related product families.
- Albéa Group and Amcor cover broad beauty packaging needs across tubes or rigid formats used by multinational brands. Both groups suit programs that require consistent specifications across several manufacturing regions and more than one beauty product category with coordinated decoration standards.
- Gerresheimer and Quadpack combine rigid bottle or jar expertise with documented regional manufacturing access for beauty programs. Their position is relevant when glass quality or refill design carries more weight than a broad commodity format range during detailed technical review. Both suppliers also support brand teams that need regional production access and controlled decoration trials ahead of formal approval.
- HCP Packaging and Toly Group focus on color cosmetics and custom presentation across compacts or stick formats. Cosmopak and Libo Cosmetics receive attention when shape and decoration must work with dependable closure performance during transport and repeated consumer use. These specialists suit programs that require closer design support ahead of commercial tooling and sampling reviews.
Competitive Benchmarking: Beauty & Cosmetic Packaging Market
| Company | Dispensing and Closure Depth | Rigid Beauty Format Range | Refill or Recyclability Evidence | Service Reach |
|---|---|---|---|---|
| AptarGroup | High | Medium | High | Global |
| Albéa Group | Medium | High | High | Global |
| Amcor | Medium | High | High | Global |
| Gerresheimer | Low | High | Medium | Global |
| HCP Packaging | Medium | High | Medium | Global |
| Silgan Holdings | High | Medium | Medium | Global |
| Quadpack | High | High | High | Global |
| Toly Group | Medium | High | High | Regional; Europe, Asia and North America |
| Cosmopak | Low | Medium | Medium | Regional; North America and Asia |
| Libo Cosmetics | Medium | High | Medium | Regional; Asia, Europe and North America |
Scoring basis: High indicates direct and substantial capability supported by documented products or operations. Medium indicates relevant but partial coverage. Low indicates limited direct evidence in the assessed dimension.
Source: Future Market Insights competitive analysis, 2026. Ratings reflect relative portfolio relevance and workflow fit. Service capability and geographic reach shape the remaining comparison.
Key Developments in the Beauty & Cosmetic Packaging Market
- January 2026, Aptar Beauty, launched NeoDropper Autoload for prestige and dermocosmetic skincare formulas that require controlled dosing and stronger formula protection during daily use and repeated handling.
- September 2025, Amcor, announced the Grace actuator head for its mono-material Wave 2CC pump ahead of exhibitions in Monaco and London serving prestige skincare and fragrance brands. Its 100% polyolefin head handles free-flowing lotions or thicker creams and supports production with Amcor CleanStream recycled polypropylene, giving beauty brands a dispensing option designed for polyolefin recycling streams where suitable collection infrastructure exists.
- September 2025, Toly Group, worked with Eastman to launch Gemini for premium color cosmetics with glass-like clarity and certified recycled content ahead of its Luxe Pack Monaco presentation. Gemini is the first compact made with Eastman Cristal One Renew IM812 and supports up to 100% certified recycled content through molecular recycling, giving brand teams a documented material route before international makeup launches.
- January 2026, Quadpack, introduced Linea PP Panstick for foundation and contour formulas that need a refillable mechanism and several decoration choices across premium makeup programs and retail price tiers. Linea PP Panstick uses a snap-on refill and a POM-free mechanism with European-made components, giving makeup brands a simpler material structure and shorter regional supply route during commercial launch planning in Europe.
Key Players in the Beauty & Cosmetic Packaging Market
Dispensing and closure specialists
- AptarGroup
- Silgan Holdings
Rigid packaging and full-service suppliers
- Albéa Group
- Amcor
- Gerresheimer
- Quadpack
Color cosmetics and custom-design specialists
- HCP Packaging
- Toly Group
- Cosmopak
- Libo Cosmetics
Beauty & Cosmetic Packaging Market - Report Scope
| Report Attribute | Coverage |
|---|---|
| Market Breakdown | Material, Product, Application, Price Tier, Sustainability, and Region |
| Quantitative Units | USD billion |
| Market Definition | Primary packaging for beauty and cosmetic formulas includes containers and dispensing components used across skincare, haircare, color cosmetics and fragrances. |
| Regions Covered | North America, Latin America, Europe, East Asia, South Asia and Pacific, Oceania, and Middle East and Africa |
| Countries Covered | United States, China, India, Germany, France, Japan, South Korea and other countries within the regional model |
| Key Companies Profiled | AptarGroup, Albéa Group, Amcor, Gerresheimer, HCP Packaging, Silgan Holdings, Quadpack, Toly Group, Cosmopak and Libo Cosmetics |
| Approach | Demand-side review of beauty launches and pack formats combined with supplier portfolio analysis and country forecast reconciliation |
Source: Future Market Insights - analysis driven by proprietary forecasting models and primary research
Beauty & Cosmetic Packaging Market - Research Methodology
| Method | Application |
|---|---|
| Primary Research | Primary interviews cover beauty brand packaging teams and contract fillers across major manufacturing and retail regions worldwide. Discussions examine pack redesign timing and product contact requirements together with mold control or decoration approval. Responses from mass and premium programs show where technical support changes supplier selection during launch approval. Interview findings also identify production issues that delay a controlled launch across regional filling locations. |
| Desk Research | Desk research reviews official trade data and cosmetics regulation together with verified supplier portfolios or dated product releases. Government and trade-body sources support country conditions across beauty product demand and current packaging rules worldwide. |
| Market Sizing and Forecasting | The base combines supplier revenue signals with beauty product trade and primary feedback on documented package replacement cycles worldwide. Segment shares reflect format use across skincare or color cosmetics programs during the base year. Country forecasts compare launch activity and local manufacturing access against material rules in each profiled economy. |
| Data Validation | Independent source types are compared before any figure enters the market sizing and forecast model. Company evidence confirms relevant products and documented service reach for the competitive comparison across regions. Official trade data tests each country’s exposure to packaged beauty products sold across international markets. Primary interviews test filling-line fit and decoration approval across mass or premium beauty launch programs. Large differences are reviewed against replacement cycles or known plant changes before values are reconciled across each section. |
Source: Future Market Insights (FMI) analysis, based on proprietary forecasting model and primary research
Beauty & Cosmetic Packaging Market by Segments
Beauty & Cosmetic Packaging Market segmented by Material:
- Plastic
- Glass
- Paper and Board
- Metal
- Other Materials
Beauty & Cosmetic Packaging Market segmented by Product:
- Bottles
- Jars and Containers
- Tubes
- Pumps and Dispensers
- Caps, Closures and Other Products
Beauty & Cosmetic Packaging Market segmented by Application:
- Skincare
- Haircare
- Color Cosmetics
- Fragrances
- Other Applications
Beauty & Cosmetic Packaging Market segmented by Price Tier:
- Mass
- Premium and Prestige
Beauty & Cosmetic Packaging Market segmented by Sustainability:
- Conventional
- Recycled or Recyclable
- Refillable
Beauty & Cosmetic Packaging Market by Region:
- North America
- United States
- Canada
- Latin America
- Brazil
- Mexico
- Other Latin American Countries
- Europe
- Germany
- France
- United Kingdom
- Italy
- Spain
- Other European Countries
- East Asia
- China
- Japan
- South Korea
- South Asia and Pacific
- India
- ASEAN Countries
- Other South Asian and Pacific Countries
- Oceania
- Australia
- New Zealand
- Middle East and Africa
- Gulf Cooperation Council Countries
- South Africa
- Other Middle Eastern and African Countries
Research Sources and Bibliography
- Amcor. (2025, April 30). Amcor completes combination with Berry Global.
- Amcor. (2025, September 10). Exhibitions to highlight Amcor's beauty packaging innovations.
- Aptar Beauty. (2025, February 3). Aptar Beauty launches HDP, a new high-dose all-plastic pump.
- Aptar Beauty. (2025, May 21). Aptar Beauty introduces Derma Series.
- Aptar Beauty. (2026, January 29). Aptar Beauty launches NeoDropper Autoload, a next-generation dropper with automatic filling and precise applicator.
- AptarGroup, Inc. (2026, February 5). Aptar reports fourth quarter and annual 2025 results.
- CHEMEXCIL. (2025, September 4). 62nd annual report 2024-25.
- European Commission. (2025, February 11). Packaging and packaging waste regulation.
- Quadpack. (2025, January 28). Dropify your skincare routine!
- Quadpack. (2025, July 15). Quadpack brings PET dip-in production to Europe.
- Quadpack. (2026, January 27). Linea PP Panstick blends sustainability, sophistication and performance.
- Toly Group. (2025, September 17). Toly and Eastman introduce Gemini: A new standard in sustainable luxury packaging.
- USA Food and Drug Administration. (2026, July 2). Registration and listing of cosmetic product facilities and products.
- United Nations Statistics Division. (n.d.). UN Comtrade database.
- United Nations Statistics Division. (2024). HS 3304 classification detail.
This bibliography is provided for reader reference and uses primary government, standards-body, official trade body, and company sources.
This Report Answers
- How large is the beauty and cosmetic packaging market in 2026 and 2036?
- Which CAGR is projected for the beauty and cosmetic packaging market from 2026 to 2036?
- Which material and product formats hold the disclosed 2026 segment positions?
- Which technical factors support demand for plastic and bottle packaging?
- How do formula contact and decoration trials affect package approval?
- Why do country CAGRs differ across established and expanding beauty markets?
- Which competitive dimensions separate dispensing groups from rigid packaging specialists?
- How does FMI validate market size and country forecasts?
- Which factors should purchasers review before approving refillable or airless suppliers?
Frequently Asked Questions
What is driving growth in the Beauty & Cosmetic Packaging Market?
Frequent beauty launches create repeat demand for packs that protect formulas and present a clear identity. Refill systems add demand after brands define replenishment routes and stable component supply for repeat purchases.
Who are the key players in the Beauty & Cosmetic Packaging Market?
AptarGroup and Albéa Group supply dispensing or broad beauty formats for established international brand programs. Amcor and Gerresheimer add rigid packaging scale for brands requiring custom beauty applications across several regions.
What is a notable restraint in the Beauty & Cosmetic Packaging Market?
Formula contact and decoration trials often extend approval before a new pack reaches volume production. A material change also needs evidence for closure performance across repeated filling-line use and normal storage.
Why should executives track the Beauty & Cosmetic Packaging Market?
Packaging choices affect formula protection and brand presentation across every retail or online sales channel. Executives also need clear visibility into material rules and refill economics before approving long-term tooling.
What business problem does the Beauty & Cosmetic Packaging Market address?
The market supplies containers and dispensing parts that protect beauty formulas during distribution or use. The selected pack also gives related product lines a repeatable physical identity across several retail formats.
What should procurement leaders evaluate before selecting suppliers?
Procurement leaders should review product contact data and decorated samples carefully before approving a supplier. They should confirm mold ownership and support for filling-line trials before signing a commercial agreement.
What limits return on investment for purchasers?
Tooling expense reduces returns after launch volume remains below the approved production case for several seasons. Weak refill uptake also leaves brands carrying extra components without enough repeat purchases from regular customers.
How do suppliers build long-term account confidence?
Suppliers build confidence by matching approved finishes and dosing performance across repeat orders from several plants. Fast technical response protects the relationship after formula changes or filling-line problems appear during commercial production.
Preview the report firsthand - request a free sample
Get SampleGet the brochure for pricing and purchase details.
Get PDFTable of Content
- Key Takeaways
- Market Size and CAGR
- Top Growth Driver
- Fastest Growing Segment
- Leading Region
- Key Companies
- Emerging Opportunities
- Executive Summary
- Global Market Outlook
- Demand-side Trends
- Supply-side Trends
- Technology Roadmap Analysis
- Analysis and Recommendations
- Analyst Perspective (What is happening? Why now? What should investors know?)
- Key Questions Answered
- How large is the market?
- What is the CAGR?
- What are key trends?
- Which region dominates?
- Who are the leaders?
- Market Overview
- Market Coverage / Taxonomy
- Market Definition / Scope / Limitations
- Research Methodology
- Chapter Orientation
- Analytical Lens and Working Hypotheses
- Market Structure, Signals, and Trend Drivers
- Benchmarking and Cross-market Comparability
- Market Sizing, Forecasting, and Opportunity Mapping
- Research Design and Evidence Framework
- Desk Research Programme (Secondary Evidence)
- Expert Input and Fieldwork (Primary Evidence)
- Tooling, Models, and Reference Databases
- Data Engineering and Model Build
- Quality Assurance and Audit Trail
- Market Background
- Market Dynamics (Drivers, Restraints, Opportunity, Trends)
- Scenario Forecast (Optimistic, Likely, Conservative)
- Impact Analysis
- AI Impact
- Sustainability Impact
- Regulatory Impact
- Technology Impact
- Consumer / Buyer Analysis
- Purchase Drivers
- Adoption Barriers
- Buyer Journey
- Opportunity Map Analysis
- Product Life Cycle Analysis
- Supply Chain Analysis
- Investment Feasibility Matrix
- Value Chain Analysis
- PESTLE and Porter's Analysis
- Regulatory Landscape
- Regional Parent Market Outlook
- Production and Consumption Statistics
- Import and Export Statistics
- Global Market Analysis and Forecast, 2021 to 2036
- Historical Market Size Value (USD Billion) Analysis, 2021 to 2025
- Current and Future Market Size Value (USD Billion) Projections, 2026 to 2036
- Y-o-Y Growth Trend Analysis
- Absolute $ Opportunity Analysis
- Global Market Pricing Analysis, 2021 to 2036
- Global Market Analysis and Forecast, By Material, 2021 to 2036
- Introduction / Key Findings
- Historical Market Size Value (USD Billion) Analysis By Material, 2021 to 2025
- Current and Future Market Size Value (USD Billion) Analysis and Forecast By Material, 2026 to 2036
- Plastic
- Glass
- Paper & Board
- Metal
- Others
- Plastic
- Y-o-Y Growth Trend Analysis By Material, 2021 to 2025
- Absolute $ Opportunity Analysis By Material, 2026 to 2036
- Global Market Analysis and Forecast, By Product, 2021 to 2036
- Introduction / Key Findings
- Historical Market Size Value (USD Billion) Analysis By Product, 2021 to 2025
- Current and Future Market Size Value (USD Billion) Analysis and Forecast By Product, 2026 to 2036
- Bottles
- Jars & Containers
- Tubes
- Pumps & Dispensers
- Caps, Closures & Others
- Bottles
- Y-o-Y Growth Trend Analysis By Product, 2021 to 2025
- Absolute $ Opportunity Analysis By Product, 2026 to 2036
- Global Market Analysis and Forecast, By Application, 2021 to 2036
- Introduction / Key Findings
- Historical Market Size Value (USD Billion) Analysis By Application, 2021 to 2025
- Current and Future Market Size Value (USD Billion) Analysis and Forecast By Application, 2026 to 2036
- Skincare
- Haircare
- Color Cosmetics
- Fragrances
- Others
- Skincare
- Y-o-Y Growth Trend Analysis By Application, 2021 to 2025
- Absolute $ Opportunity Analysis By Application, 2026 to 2036
- Global Market Analysis and Forecast, By Price Tier, 2021 to 2036
- Introduction / Key Findings
- Historical Market Size Value (USD Billion) Analysis By Price Tier, 2021 to 2025
- Current and Future Market Size Value (USD Billion) Analysis and Forecast By Price Tier, 2026 to 2036
- Mass
- Premium / Prestige
- Mass
- Y-o-Y Growth Trend Analysis By Price Tier, 2021 to 2025
- Absolute $ Opportunity Analysis By Price Tier, 2026 to 2036
- Global Market Analysis and Forecast, By Sustainability, 2021 to 2036
- Introduction / Key Findings
- Historical Market Size Value (USD Billion) Analysis By Sustainability, 2021 to 2025
- Current and Future Market Size Value (USD Billion) Analysis and Forecast By Sustainability, 2026 to 2036
- Conventional
- Recycled / Recyclable
- Refillable
- Conventional
- Y-o-Y Growth Trend Analysis By Sustainability, 2021 to 2025
- Absolute $ Opportunity Analysis By Sustainability, 2026 to 2036
- Global Market Analysis and Forecast, By Region, 2021 to 2036
- Introduction
- Historical Market Size Value (USD Billion) Analysis By Region, 2021 to 2025
- Current Market Size Value (USD Billion) Analysis and Forecast By Region, 2026 to 2036
- North America
- Latin America
- Western Europe
- Eastern Europe
- East Asia
- South Asia and Pacific
- Middle East & Africa
- Market Attractiveness Analysis By Region
- North America Market Analysis and Forecast, By Country, 2021 to 2036
- Historical Market Size Value (USD Billion) Trend Analysis By Market Taxonomy, 2021 to 2025
- Market Size Value (USD Billion) Forecast By Market Taxonomy, 2026 to 2036
- By Country
- USA
- Canada
- By Material
- By Product
- By Application
- By Price Tier
- By Sustainability
- By Country
- Market Attractiveness Analysis
- By Country
- By Material
- By Product
- By Application
- By Price Tier
- By Sustainability
- Key Takeaways
- Latin America Market Analysis and Forecast, By Country
- Historical Market Size Value (USD Billion) Trend Analysis By Market Taxonomy, 2021 to 2025
- Market Size Value (USD Billion) Forecast By Market Taxonomy, 2026 to 2036
- By Country
- Brazil
- Mexico
- Chile
- Rest of Latin America
- By Material
- By Product
- By Application
- By Price Tier
- By Sustainability
- By Country
- Market Attractiveness Analysis
- By Country
- By Material
- By Product
- By Application
- By Price Tier
- By Sustainability
- Key Takeaways
- Western Europe Market Analysis and Forecast, By Country
- Historical Market Size Value (USD Billion) Trend Analysis By Market Taxonomy, 2021 to 2025
- Market Size Value (USD Billion) Forecast By Market Taxonomy, 2026 to 2036
- By Country
- Germany
- UK
- Italy
- Spain
- France
- Nordic
- BENELUX
- Rest of Western Europe
- By Material
- By Product
- By Application
- By Price Tier
- By Sustainability
- By Country
- Market Attractiveness Analysis
- By Country
- By Material
- By Product
- By Application
- By Price Tier
- By Sustainability
- Key Takeaways
- Eastern Europe Market Analysis and Forecast, By Country
- Historical Market Size Value (USD Billion) Trend Analysis By Market Taxonomy, 2021 to 2025
- Market Size Value (USD Billion) Forecast By Market Taxonomy, 2026 to 2036
- By Country
- Russia
- Poland
- Hungary
- Balkan & Baltic
- Rest of Eastern Europe
- By Material
- By Product
- By Application
- By Price Tier
- By Sustainability
- By Country
- Market Attractiveness Analysis
- By Country
- By Material
- By Product
- By Application
- By Price Tier
- By Sustainability
- Key Takeaways
- East Asia Market Analysis and Forecast, By Country
- Historical Market Size Value (USD Billion) Trend Analysis By Market Taxonomy, 2021 to 2025
- Market Size Value (USD Billion) Forecast By Market Taxonomy, 2026 to 2036
- By Country
- China
- Japan
- South Korea
- By Material
- By Product
- By Application
- By Price Tier
- By Sustainability
- By Country
- Market Attractiveness Analysis
- By Country
- By Material
- By Product
- By Application
- By Price Tier
- By Sustainability
- Key Takeaways
- South Asia and Pacific Market Analysis and Forecast, By Country
- Historical Market Size Value (USD Billion) Trend Analysis By Market Taxonomy, 2021 to 2025
- Market Size Value (USD Billion) Forecast By Market Taxonomy, 2026 to 2036
- By Country
- India
- ASEAN
- Australia & New Zealand
- Rest of South Asia and Pacific
- By Material
- By Product
- By Application
- By Price Tier
- By Sustainability
- By Country
- Market Attractiveness Analysis
- By Country
- By Material
- By Product
- By Application
- By Price Tier
- By Sustainability
- Key Takeaways
- Middle East & Africa Market Analysis and Forecast, By Country
- Historical Market Size Value (USD Billion) Trend Analysis By Market Taxonomy, 2021 to 2025
- Market Size Value (USD Billion) Forecast By Market Taxonomy, 2026 to 2036
- By Country
- Kingdom of Saudi Arabia
- Other GCC Countries
- Türkiye
- South Africa
- Other African Union
- Rest of Middle East & Africa
- By Material
- By Product
- By Application
- By Price Tier
- By Sustainability
- By Country
- Market Attractiveness Analysis
- By Country
- By Material
- By Product
- By Application
- By Price Tier
- By Sustainability
- Key Takeaways
- Key Countries Market Analysis
- USA
- Pricing Analysis
- Market Share Analysis, 2025
- By Material
- By Product
- By Application
- By Price Tier
- By Sustainability
- Canada
- Pricing Analysis
- Market Share Analysis, 2025
- By Material
- By Product
- By Application
- By Price Tier
- By Sustainability
- Mexico
- Pricing Analysis
- Market Share Analysis, 2025
- By Material
- By Product
- By Application
- By Price Tier
- By Sustainability
- Brazil
- Pricing Analysis
- Market Share Analysis, 2025
- By Material
- By Product
- By Application
- By Price Tier
- By Sustainability
- Chile
- Pricing Analysis
- Market Share Analysis, 2025
- By Material
- By Product
- By Application
- By Price Tier
- By Sustainability
- Germany
- Pricing Analysis
- Market Share Analysis, 2025
- By Material
- By Product
- By Application
- By Price Tier
- By Sustainability
- UK
- Pricing Analysis
- Market Share Analysis, 2025
- By Material
- By Product
- By Application
- By Price Tier
- By Sustainability
- Italy
- Pricing Analysis
- Market Share Analysis, 2025
- By Material
- By Product
- By Application
- By Price Tier
- By Sustainability
- Spain
- Pricing Analysis
- Market Share Analysis, 2025
- By Material
- By Product
- By Application
- By Price Tier
- By Sustainability
- France
- Pricing Analysis
- Market Share Analysis, 2025
- By Material
- By Product
- By Application
- By Price Tier
- By Sustainability
- India
- Pricing Analysis
- Market Share Analysis, 2025
- By Material
- By Product
- By Application
- By Price Tier
- By Sustainability
- ASEAN
- Pricing Analysis
- Market Share Analysis, 2025
- By Material
- By Product
- By Application
- By Price Tier
- By Sustainability
- Australia & New Zealand
- Pricing Analysis
- Market Share Analysis, 2025
- By Material
- By Product
- By Application
- By Price Tier
- By Sustainability
- China
- Pricing Analysis
- Market Share Analysis, 2025
- By Material
- By Product
- By Application
- By Price Tier
- By Sustainability
- Japan
- Pricing Analysis
- Market Share Analysis, 2025
- By Material
- By Product
- By Application
- By Price Tier
- By Sustainability
- South Korea
- Pricing Analysis
- Market Share Analysis, 2025
- By Material
- By Product
- By Application
- By Price Tier
- By Sustainability
- Russia
- Pricing Analysis
- Market Share Analysis, 2025
- By Material
- By Product
- By Application
- By Price Tier
- By Sustainability
- Poland
- Pricing Analysis
- Market Share Analysis, 2025
- By Material
- By Product
- By Application
- By Price Tier
- By Sustainability
- Hungary
- Pricing Analysis
- Market Share Analysis, 2025
- By Material
- By Product
- By Application
- By Price Tier
- By Sustainability
- Kingdom of Saudi Arabia
- Pricing Analysis
- Market Share Analysis, 2025
- By Material
- By Product
- By Application
- By Price Tier
- By Sustainability
- Türkiye
- Pricing Analysis
- Market Share Analysis, 2025
- By Material
- By Product
- By Application
- By Price Tier
- By Sustainability
- South Africa
- Pricing Analysis
- Market Share Analysis, 2025
- By Material
- By Product
- By Application
- By Price Tier
- By Sustainability
- USA
- Market Structure Analysis
- Competition Dashboard
- Competition Benchmarking
- Market Share Analysis of Top Players
- By Regional
- By Material
- By Product
- By Application
- By Price Tier
- By Sustainability
- Emerging Startups
- Innovation Benchmarking
- Competition Analysis
- Competition Deep Dive
- AptarGroup
- Overview
- Product Portfolio
- Profitability by Market Segments
- Sales Footprint
- Strategy Overview
- Marketing Strategy
- Product Strategy
- Channel Strategy
- Albéa Group
- Berry Global
- Gerresheimer
- HCP Packaging
- Silgan Holdings
- Quadpack
- Toly Group
- Cosmopak
- Libo Cosmetics
- AptarGroup
- Case Studies
- Success Stories
- Recent Developments
- Competition Deep Dive
- Assumptions & Acronyms Used


