Benzyl Alcohol Market Size, Share, and Forecast Outlook 2025 to 2035

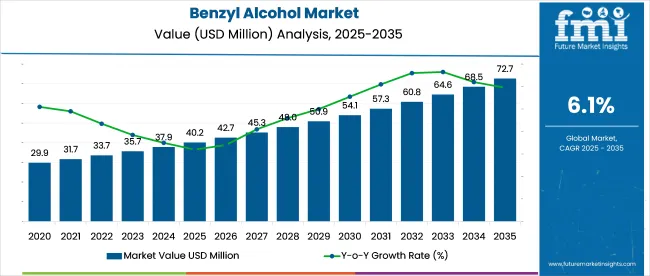
The benzyl alcohol market is projected to grow from USD 40.2 million in 2025 to USD 72.7 million by 2035, expanding at a CAGR of 6.1% throughout the forecast period. This growth is being supported by the compound’s extensive use across paints and coatings, pharmaceuticals, and personal care formulations, where its solvent, preservative, and stabilizing properties are critical.
Quick Stats in Benzyl Alcohol Market

  • Market Size (2025): USD 40.2 million
  • Market Forecast (2035): USD 72.7 million
  • CAGR (2025 to 2035): 6.1%
  • Top Grade Segment: Pharmaceuticals Grade (41.7% share in 2025)
  • Leading End Use Segment: Pharmaceuticals (38.2% share in 2025)
  • Top Growing Country: India (5.8% CAGR)

Benzyl Alcohol Market Market Value Analysis

Attributes Description
Estimated Industry Size (2025E) USD 40.2 million
Projected Industry Value (2035F) USD 72.7 million
Value-based CAGR (2025 to 2035) 6.1%

In 2024, global consumption crossed 90,000 tons, with Asia-Pacific accounting for over 40% due to rising drug formulation and specialty chemical production. In India and China, benzyl alcohol is increasingly used in injectable biologics and dermatological creams, where its bacteriostatic properties meet stringent pharmacopoeial standards.

In North America and Europe, pharmaceutical-grade material above 99.5% purity is driving procurement strategies across regulated markets. In the coatings sector, benzyl alcohol is gaining ground as a low-volatility solvent in water-based epoxy systems, especially in construction resins and protective finishes.

Demand from haircare and skincare segments is also increasing as formulators replace parabens with milder preservatives. Supply chain shifts are favoring integrated producers with toluene and benzyl chloride backward linkages. This structural advantage is improving margins while ensuring consistency in a market sensitive to purity and compliance.

As of 2025, the benzyl alcohol market is being recognized as a steadily expanding segment within its broader parent industries. Approximately 5-7% of the global solvents market is represented by benzyl alcohol, driven by its widespread use in coatings, inks, and cleaning formulations.

In the pharmaceutical excipients sector, a share of nearly 6-8% is maintained as benzyl alcohol continues to be used as a preservative and solvent in injectables. Around 4-5% of the personal care ingredients market is occupied by this compound due to its role in fragrance and preservative systems. Its contribution to the paints and coatings additives market is estimated at 3-4% while in the specialty chemicals arena the market share reaches about 7-9%.

Analyzing Benzyl Alcohol Market by Top Investment Segments

The market is gaining traction across key segments including pharmaceuticals grade, synthetic solvents, and pharmaceutical end uses. Demand is rising due to its solvent versatility, clinical safety profile, and increasing use in regulated drug formulations.
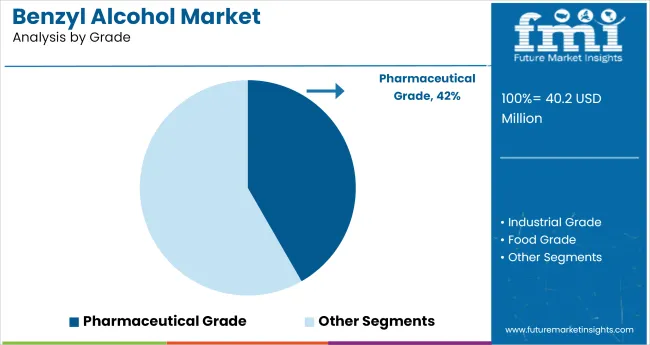
Pharmaceuticals Grade Benzyl Alcohol Leads Market with 41.7% Share

Benzyl Alcohol Market Analysis By Grade

Pharmaceuticals grade benzyl alcohol is expected to dominate the market with a 41.7% share by 2025. Its high purity, non-irritating properties, and proven safety in regulated formulations make it the preferred variant for medical use. It serves as a solvent, bacteriostatic agent, and preservative in injectables and dermatological drugs. The segment benefits from expanding demand in both developed and emerging healthcare markets.
  • Drug manufacturers use it extensively in parenteral formulations and topical creams.
  • Regulatory acceptance across global markets drives volume sales through contract manufacturing.
  • Rapid growth in biologics and injectables continues to push demand for pharmaceutical-grade solvents and excipients.

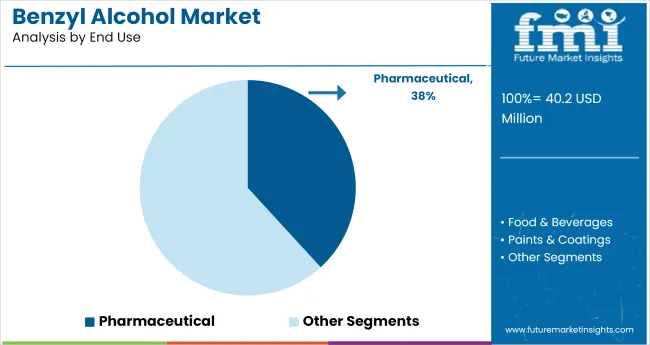
Pharmaceuticals to Dominate End Use Segment with 38.2% Market Share

Benzyl Alcohol Market Analysis By End Use

The pharmaceuticals end use segment is projected to capture 38.2% of the market by 2025. This growth is fueled by widespread use in injectables, antiseptic creams, and eye solutions. Benzyl alcohol ensures product stability, enhances solubility, and acts as a preservative across a broad range of therapies. It plays a critical role in multi-dose vials and skin formulations.
  • Large pharmaceutical companies rely on benzyl alcohol for its FDA-approved preservative role.
  • Growth in injectable drug production across Asia and Europe boosts usage.
  • Demand from dermatology and ophthalmology applications continues to strengthen segment expansion.

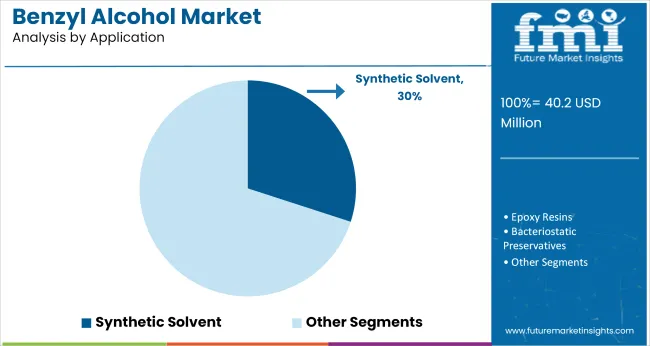
Synthetic Solvent Application Accounts for 30% of Market Share

Benzyl Alcohol Market Analysis By Application

Synthetic solvent usage is forecasted to represent 30% of the market by 2025. The compound serves as an effective solvent in inks, paints, coatings, and epoxy resins. Industrial applications dominate due to consistent use in surface finishes and adhesives.

  • Paint and ink manufacturers use it for consistent drying and dispersion qualities.
  • Infrastructure growth drives demand for coatings and sealants requiring benzyl-based solvents.
  • Favorable performance in both water- and oil-based systems boosts versatility across chemical sectors.

Top Benzyl Alcohol Market Dynamics

The market continues to expand as demand increases across paints & coatings, personal care, and pharmaceutical excipients. In 2024, global consumption surpassed 70,000 metric tons, with Asia Pacific leading due to aggressive infrastructure and cosmetics sector growth.

Shift Toward Low-VOC and High-Purity Grades Across Industries

Stringent VOC regulations in Europe and North America are driving demand for high-purity benzyl alcohol with minimal emissions. In 2024, more than 41% of new formulations in paints and cosmetics were based on benzyl alcohol grades compliant with EU REACH and USA EPA guidelines. Pharmaceutical manufacturers are prioritizing injection-grade material with >99.9% purity.

  • Low-VOC grades adopted in architectural and industrial coatings.
  • Injection-grade material used in sterile drug and vaccine production.
  • High-purity benzyl alcohol selected for allergen-free cosmetic lines.

Production Shifts and Feedstock Realignment Impacting Supply

Producers are shifting toward toluene oxidation and benzyl chloride hydrolysis to improve sustainability and reduce benzene-derived feedstocks. In China, several plants transitioned to integrated benzyl derivative platforms to support vertical supply chains. Feedstock volatility and freight rates are influencing procurement strategies in the USA and EU.
  • Toluene oxidation routes deployed to reduce environmental impact.
  • Integrated benzyl lines installed for captive use in esters and ethers.
  • Logistics cost pressures driving local sourcing in high-consumption regions.

Top Countries Producing, Utilizing, and Scaling Demand in the Benzyl Alcohol Market

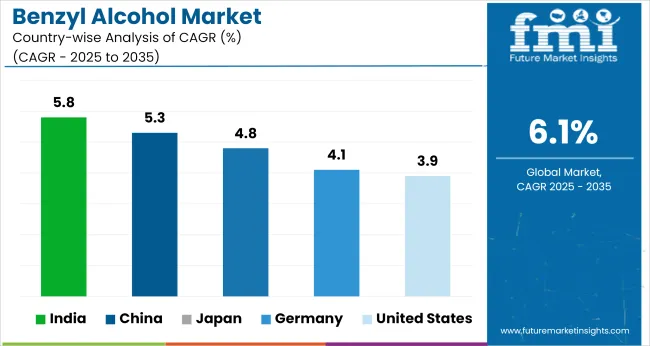
Benzyl Alcohol Market Cagr Analysis By Country

Country CAGR (2025 to 2035)
India 5.8%
China 5.3%
Japan 4.8%
Germany 4.1%
United States 3.9%

The global market is projected to grow at a 6.1% CAGR through 2035, but regional contributions vary significantly across BRICS and OECD nations. India leads with a 5.8% CAGR, just below the global average, yet remains the fastest-growing producer in Asia due to expanded capacity in Gujarat and increased downstream demand for preservatives in OTC drugs and topical formulations.

China follows at 5.3%, supported by industrial-scale applications in paints and inks, particularly in the Pearl River Delta. Stricter emissions norms are moderating growth. Japan grows at 4.8%, driven by niche use in ophthalmic and personal care segments, though limited domestic synthesis keeps import dependence high.

Germany (4.1%) and the United States (3.9%) underperform the global trend, reflecting slower innovation cycles and lower solvent demand in traditional sectors. ASEAN countries, while still small-scale players, are beginning to emerge as export destinations for BRICS-sourced benzyl alcohol, especially for food-grade applications.

The report provides insights across 40+ countries. The five below are highlighted for their strategic influence and growth trajectory.

Expansion Opportunities for Benzyl Alcohol in India

India’s market for benzyl alcohol is projected to achieve a CAGR of 5.8% from 2025 to 2035, making it the fastest-growing among key global economies. Rapid development in the pharmaceutical sector, especially in Gujarat and Telangana, is driving extensive usage in generic drug formulations.

The compound’s cost efficiency and safety profile make it an ideal excipient in multiple dosage forms. The demand is also climbing in cosmetic manufacturing, where brands are moving away from parabens. Industrial consumption is rising for resins, paints, and agrochemicals.

  • High-volume usage in low-cost pharmaceutical manufacturing
  • Reformulation trends in domestic skincare brands support growth
  • Growing demand in resin and ink manufacturing for export markets

Demand Forecast for Benzyl Alcohol in China

China’s market is projected to register a CAGR of 5.3% between 2025 and 2035. This growth is supported by strong expansion in the chemical and pharmaceutical manufacturing bases in provinces like Jiangsu and Zhejiang. The compound is widely used as a solvent and intermediate in dye and ink production, which continues to surge with global exports. Increasing domestic consumption of personal care products is also encouraging higher demand for safe preservatives like benzyl alcohol.

  • Expanding use in pharma intermediates and ink manufacturing
  • Rising cosmetic consumption drives preservative adoption
  • Increased export of processed chemicals and formulations

Benzyl Alcohol Demand Trends in Japan

Japan is expected to grow steadily at a CAGR of 4.8% through 2035. Strong demand in ophthalmic, injectable, and dermatological formulations drives continued pharmaceutical uptake. Consumer preference for mild preservatives in skincare, especially among aging populations, supports broader adoption across domestic cosmetic lines. Japanese manufacturers value the compound for its purity, safety, and ease of integration into high-compliance formulations.

  • Trusted for use in injectable and ophthalmic formulations
  • Preferred preservative in hypoallergenic skincare brands
  • Stable industrial application in specialty dyes and fine chemicals

Sales Forecast for Benzyl Alcohol in Germany

Sales of benzyl alcohol in Germany are on course to rise at a CAGR of 4.1% from 2025 to 2035. A robust industrial base, particularly in Baden-Württemberg and North Rhine-Westphalia, continues to fuel demand across pharmaceuticals, paints, and adhesives.

As REACH regulations tighten, manufacturers increasingly rely on safer solvent alternatives, strengthening the case for benzyl alcohol. Demand within pharmaceuticals remains steady due to continued use in injectable and oral drug preparations. The growth in sealants and high-performance coating systems adds a layer of industrial momentum.

  • Adoption in medical excipients remains strong in major drug hubs
  • Formulated into performance coatings for architectural and industrial use
  • Growth driven by REACH-compliant solvent replacement strategies

Market Overview for Benzyl Alcohol in the United States

Demand for benzyl alcohol in the USA is set to grow at a CAGR of 3.9% from 2025 to 2035. Rising pharmaceutical consumption, especially for injectable medications and topical antiseptics, continues to support stable market performance. Regulatory alignment with FDA standards allows the compound to maintain its relevance in over-the-counter and prescription formulations.

In the cosmetics segment, increased usage in preservative systems reflects a wider shift toward paraben-free solutions. Demand also holds steady in industrial applications such as printing inks and coatings.
  • Growth in parenteral drug formulation across major pharmaceutical hubs
  • Rising interest in clean-label cosmetic ingredients
  • Consistent use in industrial ink resins and protective coatings

Leading Benzyl Alcohol Providers

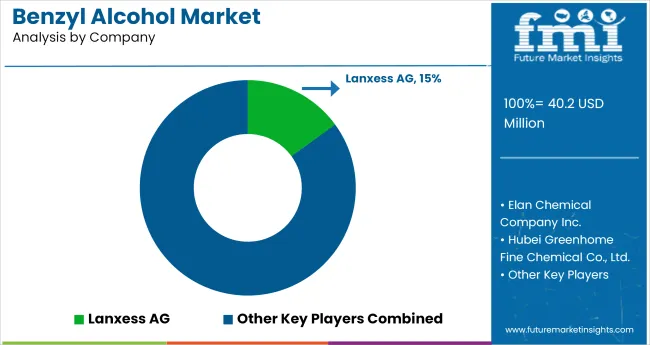
Benzyl Alcohol Market Analysis By Company

The industry is fragmented, with global and regional players competing across pharmaceutical, personal care, and industrial domains. Lanxess AG leads in high-purity benzyl alcohol production, particularly for excipient and solvent-grade formulations in Europe. Merck KGaA and Avantor, Inc. supply ultra-high-purity grades tailored for biotech and laboratory applications, benefiting from strong life sciences portfolios.

Wuhan Youji and Hubei Greenhome dominate China’s low-cost manufacturing, offering large-scale supply for resins and coatings. Elan Chemical and Pharmco-AAPER support the USA fragrance and food-grade segments, emphasizing regulatory compliance.

Synerzine Inc. focuses on aroma chemicals for flavors, while Finar Chemicals serves niche pharmaceutical clients in India. Ineos and Emerald Performance target bulk chemical processing applications, leveraging scale and established distribution.

Recent Benzyl Alcohol Industry News

  • In May 2025, Lanxess AG expanded its high-purity benzyl alcohol production capacity at the Kalama, Washington facility. This move strengthens its manufacturing footprint across North America and reinforces supply reliability for pharmaceutical and personal care sectors amid rising regional demand for ultra-pure aromatic alcohols.

Leading Brands in Benzyl Alcohol Market

  • Lanxess AG
  • Elan Chemical Company Inc.
  • Hubei Greenhome Fine Chemical Co., Ltd.
  • Pharmco-AAPER
  • Wuhan Youji Industries Co., Ltd.
  • Synerzine Inc.
  • Merck KGaA
  • Emerald Performance Materials
  • Avantor, Inc.
  • Finar Chemicals
  • Ineos

Report Coverage and Scope Summary

Report Attributes Details
Market Size (2025) USD 40.2 million
Projected Market Size (2035) USD 72.7 million
CAGR (2025 to 2035) 6.1%
Base Year for Estimation 2024
Historical Period 2020 to 2024
Projections Period 2025 to 2035
Quantitative Units USD million for market value
Grades Analyzed (Segment 1) Industrial Grade, Food Grade, Pharmaceuticals Grade, Others
End Uses Analyzed (Segment 2) Food & Beverages, Paints & Coatings, Pharmaceuticals, Others
Applications Analyzed (Segment 3) Cleaning Agent, Synthetic Solvent, Epoxy Resins, Bacteriostatic Preservatives, Dielectric Solvent, Others
Regions Covered North America, Latin America, Western Europe, Eastern Europe, East Asia, South Asia & Pacific, Central Asia, Russia & Belarus, Balkan & Baltic Countries, Middle East & Africa
Countries Covered United States, Canada, Germany, United Kingdom, France, Japan, China, India, South Korea, Brazil
Key Players Lanxess AG, Elan Chemical Company Inc., Hubei Greenhome Fine Chemical Co., Ltd., Pharmco-AAPER, Wuhan Youji Industries Co., Ltd., Synerzine Inc., Merck KGaA, Emerald Performance Materials, Avantor, Inc., Finar Chemicals, Ineos
Additional Attributes Dollar sales by grade and application, increasing usage in epoxy formulations and medical preservatives, rising demand in electronics and coatings, and strong regional growth in Asia and North America.

Top Segments Studied in the Benzyl Alcohol Market Report

By Grade:

The market is segmented into Industrial Grade, Food Grade, Pharmaceuticals Grade, and Others.

By End-use:

The market is classified into Food & Beverages, Paints & Coating, Pharmaceuticals, and Others.

By Application:

The market is segmented into Cleaning Agent, Synthetic Solvent, Epoxy Resins, Bacteriostatic Preservatives, Dielectric Solvent, and Others.

By Region:

The market is segmented as North America, Latin America, Western Europe, Eastern Europe, East Asia, South Asia & Pacific, Central Asia, Russia and Belarus, Balkan & Baltic Countries, Middle East and Africa.

Table of Content

  1. Executive Summary
    • Global Market Outlook
    • Demand-side Trends
    • Supply-side Trends
    • Technology Roadmap Analysis
    • Analysis and Recommendations
  2. Market Overview
    • Market Coverage / Taxonomy
    • Market Definition / Scope / Limitations
  3. Market Background
    • Market Dynamics
      • Drivers
      • Restraints
      • Opportunity
      • Trends
    • Scenario Forecast
      • Demand in Optimistic Scenario
      • Demand in Likely Scenario
      • Demand in Conservative Scenario
    • Opportunity Map Analysis
    • Product Life Cycle Analysis
    • Supply Chain Analysis
      • Supply Side Participants and their Roles
        • Producers
        • Mid-Level Participants (Traders/ Agents/ Brokers)
        • Wholesalers and Distributors
      • Value Added and Value Created at Node in the Supply Chain
      • List of Raw Material Suppliers
      • List of Existing and Potential Buyer’s
    • Investment Feasibility Matrix
    • Value Chain Analysis
      • Profit Margin Analysis
      • Wholesalers and Distributors
      • Retailers
    • PESTLE and Porter’s Analysis
    • Regulatory Landscape
      • By Key Regions
      • By Key Countries
    • Regional Parent Market Outlook
    • Production and Consumption Statistics
    • Import and Export Statistics
  4. Global Market Analysis 2020 to 2024 and Forecast, 2025 to 2035
    • Historical Market Size Value (USD Million) & Volume (MT) Analysis, 2020 to 2024
    • Current and Future Market Size Value (USD Million) & Volume (MT) Projections, 2025 to 2035
      • Y-o-Y Growth Trend Analysis
      • Absolute $ Opportunity Analysis
  5. Global Market Pricing Analysis 2020 to 2024 and Forecast 2025 to 2035
  6. Global Market Analysis 2020 to 2024 and Forecast 2025 to 2035, By Grade
    • Introduction / Key Findings
    • Historical Market Size Value (USD Million) & Volume (MT) Analysis By Grade, 2020 to 2024
    • Current and Future Market Size Value (USD Million) & Volume (MT) Analysis and Forecast By Grade, 2025 to 2035
      • Industrial Grade
      • Food Grade
      • Pharmaceuticals Grade
      • Others
    • Y-o-Y Growth Trend Analysis By Grade, 2020 to 2024
    • Absolute $ Opportunity Analysis By Grade, 2025 to 2035
  7. Global Market Analysis 2020 to 2024 and Forecast 2025 to 2035, By End-use
    • Introduction / Key Findings
    • Historical Market Size Value (USD Million) & Volume (MT) Analysis By End-use, 2020 to 2024
    • Current and Future Market Size Value (USD Million) & Volume (MT) Analysis and Forecast By End-use, 2025 to 2035
      • Food & Beverages
      • Paints & Coatings
      • Pharmaceuticals
      • Others
    • Y-o-Y Growth Trend Analysis By End-use, 2020 to 2024
    • Absolute $ Opportunity Analysis By End-use, 2025 to 2035
  8. Global Market Analysis 2020 to 2024 and Forecast 2025 to 2035, By Application
    • Introduction / Key Findings
    • Historical Market Size Value (USD Million) & Volume (MT) Analysis By Application, 2020 to 2024
    • Current and Future Market Size Value (USD Million) & Volume (MT) Analysis and Forecast By Application, 2025 to 2035
      • Cleaning Agent
      • Synthetic Solvent
      • Epoxy Resins
      • Bacteriostatic Preservatives
      • Dielectric Solvent
      • Others
    • Y-o-Y Growth Trend Analysis By Application, 2020 to 2024
    • Absolute $ Opportunity Analysis By Application, 2025 to 2035
  9. Global Market Analysis 2020 to 2024 and Forecast 2025 to 2035, By Region
    • Introduction
    • Historical Market Size Value (USD Million) & Volume (MT) Analysis By Region, 2020 to 2024
    • Current Market Size Value (USD Million) & Volume (MT) Analysis and Forecast By Region, 2025 to 2035
      • North America
      • Latin America
      • Western Europe
      • Eastern Europe
      • East Asia
      • South Asia & Pacific
      • Middle East and Africa
    • Market Attractiveness Analysis By Region
  10. North America Market Analysis 2020 to 2024 and Forecast 2025 to 2035, By Country
    • Historical Market Size Value (USD Million) & Volume (MT) Trend Analysis By Market Taxonomy, 2020 to 2024
    • Market Size Value (USD Million) & Volume (MT) Forecast By Market Taxonomy, 2025 to 2035
      • By Country
        • USA
        • Canada
        • Mexico
      • By Grade
      • By End-use
      • By Application
    • Market Attractiveness Analysis
      • By Country
      • By Grade
      • By End-use
      • By Application
    • Key Takeaways
  11. Latin America Market Analysis 2020 to 2024 and Forecast 2025 to 2035, By Country
    • Historical Market Size Value (USD Million) & Volume (MT) Trend Analysis By Market Taxonomy, 2020 to 2024
    • Market Size Value (USD Million) & Volume (MT) Forecast By Market Taxonomy, 2025 to 2035
      • By Country
        • Brazil
        • Argentina
        • Rest of LATAM
      • By Grade
      • By End-use
      • By Application
    • Market Attractiveness Analysis
      • By Country
      • By Grade
      • By End-use
      • By Application
    • Key Takeaways
  12. Western Europe Market Analysis 2020 to 2024 and Forecast 2025 to 2035, By Country
    • Historical Market Size Value (USD Million) & Volume (MT) Trend Analysis By Market Taxonomy, 2020 to 2024
    • Market Size Value (USD Million) & Volume (MT) Forecast By Market Taxonomy, 2025 to 2035
      • By Country
        • Germany
        • Italy
        • France
        • UK
        • Spain
        • BENELUX
        • Nordic
        • Rest of W.Europe
      • By Grade
      • By End-use
      • By Application
    • Market Attractiveness Analysis
      • By Country
      • By Grade
      • By End-use
      • By Application
    • Key Takeaways
  13. Eastern Europe Market Analysis 2020 to 2024 and Forecast 2025 to 2035, By Country
    • Historical Market Size Value (USD Million) & Volume (MT) Trend Analysis By Market Taxonomy, 2020 to 2024
    • Market Size Value (USD Million) & Volume (MT) Forecast By Market Taxonomy, 2025 to 2035
      • By Country
        • Russia
        • Hungary
        • Poland
        • Balkan & Baltics
        • Rest of E. Europe
      • By Grade
      • By End-use
      • By Application
    • Market Attractiveness Analysis
      • By Country
      • By Grade
      • By End-use
      • By Application
    • Key Takeaways
  14. East Asia Market Analysis 2020 to 2024 and Forecast 2025 to 2035, By Country
    • Historical Market Size Value (USD Million) & Volume (MT) Trend Analysis By Market Taxonomy, 2020 to 2024
    • Market Size Value (USD Million) & Volume (MT) Forecast By Market Taxonomy, 2025 to 2035
      • By Country
        • China
        • Japan
        • South Korea
      • By Grade
      • By End-use
      • By Application
    • Market Attractiveness Analysis
      • By Country
      • By Grade
      • By End-use
      • By Application
    • Key Takeaways
  15. South Asia & Pacific Market Analysis 2020 to 2024 and Forecast 2025 to 2035, By Country
    • Historical Market Size Value (USD Million) & Volume (MT) Trend Analysis By Market Taxonomy, 2020 to 2024
    • Market Size Value (USD Million) & Volume (MT) Forecast By Market Taxonomy, 2025 to 2035
      • By Country
        • India
        • Australia & New Zealand
        • ASEAN
        • Rest of SAP
      • By Grade
      • By End-use
      • By Application
    • Market Attractiveness Analysis
      • By Country
      • By Grade
      • By End-use
      • By Application
    • Key Takeaways
  16. Middle East and Africa Market Analysis 2020 to 2024 and Forecast 2025 to 2035, By Country
    • Historical Market Size Value (USD Million) & Volume (MT) Trend Analysis By Market Taxonomy, 2020 to 2024
    • Market Size Value (USD Million) & Volume (MT) Forecast By Market Taxonomy, 2025 to 2035
      • By Country
        • GCC Countries
        • Northern Africa
        • South Africa
        • Turkiye
        • Rest of MEA
      • By Grade
      • By End-use
      • By Application
    • Market Attractiveness Analysis
      • By Country
      • By Grade
      • By End-use
      • By Application
    • Key Takeaways
  17. Key Countries Market Analysis
    • USA
      • Pricing Analysis
      • Market Share Analysis, 2024
        • By Grade
        • By End-use
        • By Application
    • Canada
      • Pricing Analysis
      • Market Share Analysis, 2024
        • By Grade
        • By End-use
        • By Application
    • Brazil
      • Pricing Analysis
      • Market Share Analysis, 2024
        • By Grade
        • By End-use
        • By Application
    • Mexico
      • Pricing Analysis
      • Market Share Analysis, 2024
        • By Grade
        • By End-use
        • By Application
    • Argentina
      • Pricing Analysis
      • Market Share Analysis, 2024
        • By Grade
        • By End-use
        • By Application
  18. Market Structure Analysis
    • Competition Dashboard
    • Competition Benchmarking
    • Market Share Analysis of Top Players
      • By Regional
      • By Grade
      • By End-use
      • By Application
  19. Competition Analysis
    • Competition Deep Dive
      • Lanxess AG
        • Overview
        • Product Portfolio
        • Profitability by Market Segments (Product/Age /Sales Channel/Region)
        • Sales Footprint
        • Strategy Overview
          • Marketing Strategy
          • Product Strategy
          • Channel Strategy
      • Elan Chemical Company Inc.
        • Overview
        • Product Portfolio
        • Profitability by Market Segments (Product/Age /Sales Channel/Region)
        • Sales Footprint
        • Strategy Overview
          • Marketing Strategy
          • Product Strategy
          • Channel Strategy
      • Hubei Greenhome Fine Chemical Co., Ltd.
        • Overview
        • Product Portfolio
        • Profitability by Market Segments (Product/Age /Sales Channel/Region)
        • Sales Footprint
        • Strategy Overview
          • Marketing Strategy
          • Product Strategy
          • Channel Strategy
      • Pharmco-AAPER
        • Overview
        • Product Portfolio
        • Profitability by Market Segments (Product/Age /Sales Channel/Region)
        • Sales Footprint
        • Strategy Overview
          • Marketing Strategy
          • Product Strategy
          • Channel Strategy
      • Wuhan Youji Industries Co., Ltd.
        • Overview
        • Product Portfolio
        • Profitability by Market Segments (Product/Age /Sales Channel/Region)
        • Sales Footprint
        • Strategy Overview
          • Marketing Strategy
          • Product Strategy
          • Channel Strategy
      • Synerzine Inc.
        • Overview
        • Product Portfolio
        • Profitability by Market Segments (Product/Age /Sales Channel/Region)
        • Sales Footprint
        • Strategy Overview
          • Marketing Strategy
          • Product Strategy
          • Channel Strategy
      • Merck KGaA
        • Overview
        • Product Portfolio
        • Profitability by Market Segments (Product/Age /Sales Channel/Region)
        • Sales Footprint
        • Strategy Overview
          • Marketing Strategy
          • Product Strategy
          • Channel Strategy
      • Emerald Performance Materials
        • Overview
        • Product Portfolio
        • Profitability by Market Segments (Product/Age /Sales Channel/Region)
        • Sales Footprint
        • Strategy Overview
          • Marketing Strategy
          • Product Strategy
          • Channel Strategy
      • Avantor, Inc.
        • Overview
        • Product Portfolio
        • Profitability by Market Segments (Product/Age /Sales Channel/Region)
        • Sales Footprint
        • Strategy Overview
          • Marketing Strategy
          • Product Strategy
          • Channel Strategy
      • Finar Chemicals
        • Overview
        • Product Portfolio
        • Profitability by Market Segments (Product/Age /Sales Channel/Region)
        • Sales Footprint
        • Strategy Overview
          • Marketing Strategy
          • Product Strategy
          • Channel Strategy
      • Ineos
        • Overview
        • Product Portfolio
        • Profitability by Market Segments (Product/Age /Sales Channel/Region)
        • Sales Footprint
        • Strategy Overview
          • Marketing Strategy
          • Product Strategy
          • Channel Strategy
  20. Assumptions & Acronyms Used
  21. Research Methodology

List of Tables

  • Table 1: Global Market Value (USD Million) Forecast by Region, 2020-2035
  • Table 2: Global Market Volume (MT) Forecast by Region, 2020-2035
  • Table 3: Global Market Value (USD Million) Forecast by Grade, 2020-2035
  • Table 4: Global Market Volume (MT) Forecast by Grade, 2020-2035
  • Table 5: Global Market Value (USD Million) Forecast by End-use, 2020-2035
  • Table 6: Global Market Volume (MT) Forecast by End-use, 2020-2035
  • Table 7: Global Market Value (USD Million) Forecast by Application, 2020-2035
  • Table 8: Global Market Volume (MT) Forecast by Application, 2020-2035
  • Table 9: North America Market Value (USD Million) Forecast by Country, 2020-2035
  • Table 10: North America Market Volume (MT) Forecast by Country, 2020-2035
  • Table 11: North America Market Value (USD Million) Forecast by Grade, 2020-2035
  • Table 12: North America Market Volume (MT) Forecast by Grade, 2020-2035
  • Table 13: North America Market Value (USD Million) Forecast by End-use, 2020-2035
  • Table 14: North America Market Volume (MT) Forecast by End-use, 2020-2035
  • Table 15: North America Market Value (USD Million) Forecast by Application, 2020-2035
  • Table 16: North America Market Volume (MT) Forecast by Application, 2020-2035
  • Table 17: Latin America Market Value (USD Million) Forecast by Country, 2020-2035
  • Table 18: Latin America Market Volume (MT) Forecast by Country, 2020-2035
  • Table 19: Latin America Market Value (USD Million) Forecast by Grade, 2020-2035
  • Table 20: Latin America Market Volume (MT) Forecast by Grade, 2020-2035
  • Table 21: Latin America Market Value (USD Million) Forecast by End-use, 2020-2035
  • Table 22: Latin America Market Volume (MT) Forecast by End-use, 2020-2035
  • Table 23: Latin America Market Value (USD Million) Forecast by Application, 2020-2035
  • Table 24: Latin America Market Volume (MT) Forecast by Application, 2020-2035
  • Table 25: Western Europe Market Value (USD Million) Forecast by Country, 2020-2035
  • Table 26: Western Europe Market Volume (MT) Forecast by Country, 2020-2035
  • Table 27: Western Europe Market Value (USD Million) Forecast by Grade, 2020-2035
  • Table 28: Western Europe Market Volume (MT) Forecast by Grade, 2020-2035
  • Table 29: Western Europe Market Value (USD Million) Forecast by End-use, 2020-2035
  • Table 30: Western Europe Market Volume (MT) Forecast by End-use, 2020-2035
  • Table 31: Western Europe Market Value (USD Million) Forecast by Application, 2020-2035
  • Table 32: Western Europe Market Volume (MT) Forecast by Application, 2020-2035
  • Table 33: Eastern Europe Market Value (USD Million) Forecast by Country, 2020-2035
  • Table 34: Eastern Europe Market Volume (MT) Forecast by Country, 2020-2035
  • Table 35: Eastern Europe Market Value (USD Million) Forecast by Grade, 2020-2035
  • Table 36: Eastern Europe Market Volume (MT) Forecast by Grade, 2020-2035
  • Table 37: Eastern Europe Market Value (USD Million) Forecast by End-use, 2020-2035
  • Table 38: Eastern Europe Market Volume (MT) Forecast by End-use, 2020-2035
  • Table 39: Eastern Europe Market Value (USD Million) Forecast by Application, 2020-2035
  • Table 40: Eastern Europe Market Volume (MT) Forecast by Application, 2020-2035
  • Table 41: East Asia Market Value (USD Million) Forecast by Country, 2020-2035
  • Table 42: East Asia Market Volume (MT) Forecast by Country, 2020-2035
  • Table 43: East Asia Market Value (USD Million) Forecast by Grade, 2020-2035
  • Table 44: East Asia Market Volume (MT) Forecast by Grade, 2020-2035
  • Table 45: East Asia Market Value (USD Million) Forecast by End-use, 2020-2035
  • Table 46: East Asia Market Volume (MT) Forecast by End-use, 2020-2035
  • Table 47: East Asia Market Value (USD Million) Forecast by Application, 2020-2035
  • Table 48: East Asia Market Volume (MT) Forecast by Application, 2020-2035
  • Table 49: South Asia & Pacific Market Value (USD Million) Forecast by Country, 2020-2035
  • Table 50: South Asia & Pacific Market Volume (MT) Forecast by Country, 2020-2035
  • Table 51: South Asia & Pacific Market Value (USD Million) Forecast by Grade, 2020-2035
  • Table 52: South Asia & Pacific Market Volume (MT) Forecast by Grade, 2020-2035
  • Table 53: South Asia & Pacific Market Value (USD Million) Forecast by End-use, 2020-2035
  • Table 54: South Asia & Pacific Market Volume (MT) Forecast by End-use, 2020-2035
  • Table 55: South Asia & Pacific Market Value (USD Million) Forecast by Application, 2020-2035
  • Table 56: South Asia & Pacific Market Volume (MT) Forecast by Application, 2020-2035
  • Table 57: Middle East and Africa Market Value (USD Million) Forecast by Country, 2020-2035
  • Table 58: Middle East and Africa Market Volume (MT) Forecast by Country, 2020-2035
  • Table 59: Middle East and Africa Market Value (USD Million) Forecast by Grade, 2020-2035
  • Table 60: Middle East and Africa Market Volume (MT) Forecast by Grade, 2020-2035
  • Table 61: Middle East and Africa Market Value (USD Million) Forecast by End-use, 2020-2035
  • Table 62: Middle East and Africa Market Volume (MT) Forecast by End-use, 2020-2035
  • Table 63: Middle East and Africa Market Value (USD Million) Forecast by Application, 2020-2035
  • Table 64: Middle East and Africa Market Volume (MT) Forecast by Application, 2020-2035

List of Figures

  • Figure 1: Global Market Volume (MT) Forecast 2020-2035
  • Figure 2: Global Market Pricing Analysis
  • Figure 3: Global Market Value (USD Million) Forecast 2020-2035
  • Figure 4: Global Market Value Share and BPS Analysis by Grade, 2025 and 2035
  • Figure 5: Global Market Y-o-Y Growth Comparison by Grade, 2025-2035
  • Figure 6: Global Market Attractiveness Analysis by Grade
  • Figure 7: Global Market Value Share and BPS Analysis by End-use, 2025 and 2035
  • Figure 8: Global Market Y-o-Y Growth Comparison by End-use, 2025-2035
  • Figure 9: Global Market Attractiveness Analysis by End-use
  • Figure 10: Global Market Value Share and BPS Analysis by Application, 2025 and 2035
  • Figure 11: Global Market Y-o-Y Growth Comparison by Application, 2025-2035
  • Figure 12: Global Market Attractiveness Analysis by Application
  • Figure 13: Global Market Value (USD Million) Share and BPS Analysis by Region, 2025 and 2035
  • Figure 14: Global Market Y-o-Y Growth Comparison by Region, 2025-2035
  • Figure 15: Global Market Attractiveness Analysis by Region
  • Figure 16: North America Market Incremental $ Opportunity, 2025-2035
  • Figure 17: Latin America Market Incremental $ Opportunity, 2025-2035
  • Figure 18: Western Europe Market Incremental $ Opportunity, 2025-2035
  • Figure 19: Eastern Europe Market Incremental $ Opportunity, 2025-2035
  • Figure 20: East Asia Market Incremental $ Opportunity, 2025-2035
  • Figure 21: South Asia & Pacific Market Incremental $ Opportunity, 2025-2035
  • Figure 22: Middle East and Africa Market Incremental $ Opportunity, 2025-2035
  • Figure 23: North America Market Value Share and BPS Analysis by Country, 2025 and 2035
  • Figure 24: North America Market Value Share and BPS Analysis by Grade, 2025 and 2035
  • Figure 25: North America Market Y-o-Y Growth Comparison by Grade, 2025-2035
  • Figure 26: North America Market Attractiveness Analysis by Grade
  • Figure 27: North America Market Value Share and BPS Analysis by End-use, 2025 and 2035
  • Figure 28: North America Market Y-o-Y Growth Comparison by End-use, 2025-2035
  • Figure 29: North America Market Attractiveness Analysis by End-use
  • Figure 30: North America Market Value Share and BPS Analysis by Application, 2025 and 2035
  • Figure 31: North America Market Y-o-Y Growth Comparison by Application, 2025-2035
  • Figure 32: North America Market Attractiveness Analysis by Application
  • Figure 33: Latin America Market Value Share and BPS Analysis by Country, 2025 and 2035
  • Figure 34: Latin America Market Value Share and BPS Analysis by Grade, 2025 and 2035
  • Figure 35: Latin America Market Y-o-Y Growth Comparison by Grade, 2025-2035
  • Figure 36: Latin America Market Attractiveness Analysis by Grade
  • Figure 37: Latin America Market Value Share and BPS Analysis by End-use, 2025 and 2035
  • Figure 38: Latin America Market Y-o-Y Growth Comparison by End-use, 2025-2035
  • Figure 39: Latin America Market Attractiveness Analysis by End-use
  • Figure 40: Latin America Market Value Share and BPS Analysis by Application, 2025 and 2035
  • Figure 41: Latin America Market Y-o-Y Growth Comparison by Application, 2025-2035
  • Figure 42: Latin America Market Attractiveness Analysis by Application
  • Figure 43: Western Europe Market Value Share and BPS Analysis by Country, 2025 and 2035
  • Figure 44: Western Europe Market Value Share and BPS Analysis by Grade, 2025 and 2035
  • Figure 45: Western Europe Market Y-o-Y Growth Comparison by Grade, 2025-2035
  • Figure 46: Western Europe Market Attractiveness Analysis by Grade
  • Figure 47: Western Europe Market Value Share and BPS Analysis by End-use, 2025 and 2035
  • Figure 48: Western Europe Market Y-o-Y Growth Comparison by End-use, 2025-2035
  • Figure 49: Western Europe Market Attractiveness Analysis by End-use
  • Figure 50: Western Europe Market Value Share and BPS Analysis by Application, 2025 and 2035
  • Figure 51: Western Europe Market Y-o-Y Growth Comparison by Application, 2025-2035
  • Figure 52: Western Europe Market Attractiveness Analysis by Application
  • Figure 53: Eastern Europe Market Value Share and BPS Analysis by Country, 2025 and 2035
  • Figure 54: Eastern Europe Market Value Share and BPS Analysis by Grade, 2025 and 2035
  • Figure 55: Eastern Europe Market Y-o-Y Growth Comparison by Grade, 2025-2035
  • Figure 56: Eastern Europe Market Attractiveness Analysis by Grade
  • Figure 57: Eastern Europe Market Value Share and BPS Analysis by End-use, 2025 and 2035
  • Figure 58: Eastern Europe Market Y-o-Y Growth Comparison by End-use, 2025-2035
  • Figure 59: Eastern Europe Market Attractiveness Analysis by End-use
  • Figure 60: Eastern Europe Market Value Share and BPS Analysis by Application, 2025 and 2035
  • Figure 61: Eastern Europe Market Y-o-Y Growth Comparison by Application, 2025-2035
  • Figure 62: Eastern Europe Market Attractiveness Analysis by Application
  • Figure 63: East Asia Market Value Share and BPS Analysis by Country, 2025 and 2035
  • Figure 64: East Asia Market Value Share and BPS Analysis by Grade, 2025 and 2035
  • Figure 65: East Asia Market Y-o-Y Growth Comparison by Grade, 2025-2035
  • Figure 66: East Asia Market Attractiveness Analysis by Grade
  • Figure 67: East Asia Market Value Share and BPS Analysis by End-use, 2025 and 2035
  • Figure 68: East Asia Market Y-o-Y Growth Comparison by End-use, 2025-2035
  • Figure 69: East Asia Market Attractiveness Analysis by End-use
  • Figure 70: East Asia Market Value Share and BPS Analysis by Application, 2025 and 2035
  • Figure 71: East Asia Market Y-o-Y Growth Comparison by Application, 2025-2035
  • Figure 72: East Asia Market Attractiveness Analysis by Application
  • Figure 73: South Asia & Pacific Market Value Share and BPS Analysis by Country, 2025 and 2035
  • Figure 74: South Asia & Pacific Market Value Share and BPS Analysis by Grade, 2025 and 2035
  • Figure 75: South Asia & Pacific Market Y-o-Y Growth Comparison by Grade, 2025-2035
  • Figure 76: South Asia & Pacific Market Attractiveness Analysis by Grade
  • Figure 77: South Asia & Pacific Market Value Share and BPS Analysis by End-use, 2025 and 2035
  • Figure 78: South Asia & Pacific Market Y-o-Y Growth Comparison by End-use, 2025-2035
  • Figure 79: South Asia & Pacific Market Attractiveness Analysis by End-use
  • Figure 80: South Asia & Pacific Market Value Share and BPS Analysis by Application, 2025 and 2035
  • Figure 81: South Asia & Pacific Market Y-o-Y Growth Comparison by Application, 2025-2035
  • Figure 82: South Asia & Pacific Market Attractiveness Analysis by Application
  • Figure 83: Middle East and Africa Market Value Share and BPS Analysis by Country, 2025 and 2035
  • Figure 84: Middle East and Africa Market Value Share and BPS Analysis by Grade, 2025 and 2035
  • Figure 85: Middle East and Africa Market Y-o-Y Growth Comparison by Grade, 2025-2035
  • Figure 86: Middle East and Africa Market Attractiveness Analysis by Grade
  • Figure 87: Middle East and Africa Market Value Share and BPS Analysis by End-use, 2025 and 2035
  • Figure 88: Middle East and Africa Market Y-o-Y Growth Comparison by End-use, 2025-2035
  • Figure 89: Middle East and Africa Market Attractiveness Analysis by End-use
  • Figure 90: Middle East and Africa Market Value Share and BPS Analysis by Application, 2025 and 2035
  • Figure 91: Middle East and Africa Market Y-o-Y Growth Comparison by Application, 2025-2035
  • Figure 92: Middle East and Africa Market Attractiveness Analysis by Application
  • Figure 93: Global Market - Tier Structure Analysis
  • Figure 94: Global Market - Company Share Analysis

Frequently Asked Questions

What is the market size of the benzyl alcohol market?

The market is valued at USD 40.2 million in 2025 and is projected to reach USD 72.7 million by 2035.

What is the expected CAGR of the benzyl alcohol market?

The market is expected to expand at a CAGR of 6.1% between 2025 and 2035.

Which is the leading segment by grade in the benzyl alcohol market?

Pharmaceuticals grade holds the top position with a 41.7% share in 2025.

Which end-use segment generates the highest revenue in the benzyl alcohol market?

Pharmaceuticals dominate the market with a 38.2% share in 2025.

Which country is the top performer in the benzyl alcohol market?

India leads the market with a CAGR of 5.8% from 2025 to 2035.

Explore Similar Insights

Future Market Insights

Benzyl Alcohol Market