
- Market Size (2026)
- USD 20.0 Bn
- Forecast (2036)
- USD 45.6 Bn
- CAGR (2026 to 2036)
- 8.6%
How big is Tourism Industry Big Data Analytics Market in 2026?
The tourism industry big data analytics market evolved from an initial 2025 tally of USD 18.4 billion into a 2026 reading of USD 20.0 billion before climbing to a projected 2036 scale of USD 45.6 billion on an 8.6% annual growth rate.
Global tourism industry big data analytics market value stood at USD 18.4 billion in 2025 and reached USD 20.0 billion for 2026, while according to FMI the sector valuation will climb to USD 45.6 billion by 2036 at an 8.6% CAGR. Expansion across this category outpaces the 5.8% annual growth rate of traditional airline reservation software because carriers and hotel chains are buying predictive pricing tools on top of core booking databases. Shorter passenger booking windows mean fixed seasonal price lists leave unsold seats and rooms empty. For instance, in July 2026, Amadeus IT Group reported in its First Half 2026 results that operating income rose as airlines and hospitality chains expanded cloud pricing deployments [1]. Consequently, dynamic pricing and revenue management accounts for a projected 36.4% of application demand in 2026. However, cross-border data privacy rules and legacy integration costs still restrain smaller travel operators.
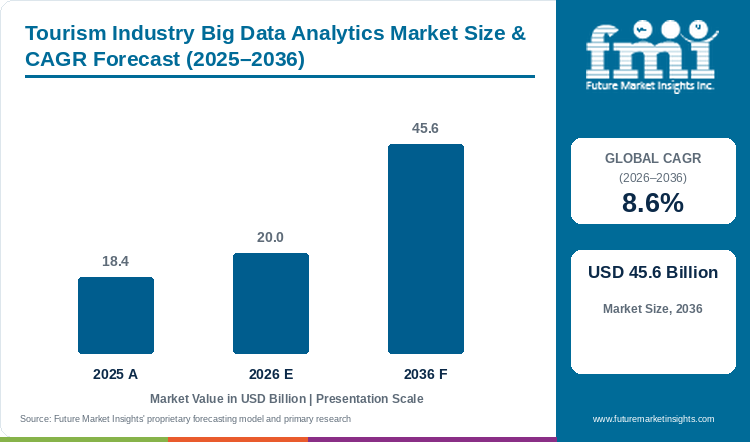
Key Market Trends & Insights
- By application: Based on application, dynamic pricing and revenue management accounts for a projected 36.4% in 2026, driven by live search-to-book yield recalculation.
- By component: By component, cloud analytics platforms and SaaS holds an estimated 62.8% during 2026, supported by multi-property hospitality chains retiring on-premise servers.
- By end user: In 2026, airlines and aviation hubs leads end-user demand with 34.8% projected share, owing to high-frequency New Distribution Capability shopping queries.
- By spending tier: By spending tier, mid-scale and upper-midscale experiences represents 47.3% of 2026 forecast demand, influenced by standardized chain revenue-management rollouts.
- By payment and financing method: Digital wallets, cards & loyalty telemetry captures a projected 67.8% payment share for 2026, enabled by co-branded frequent-flyer point valuation engines.
Regional Highlights
- Mediterranean & Asian smart-tourism outlook: Spain is projected to expand on a 9.1% CAGR up to 2036 under municipal smart-destination grants while Japan advances at an 8.9% CAGR on rail-to-hotel congestion telemetry.
- European & North American hub progression: United Kingdom demand climbs at an 8.7% CAGR up to 2036 while Germany achieves 8.5% and the United States logs 8.4% compared with Canada at 8.0%.
Market Size & Forecast
Table 1: Market Size and Forecast for the Tourism Industry Big Data Analytics Market (USD billion and CAGR percentage), 2025 to 2036
| Metric | Value |
|---|---|
| 2025 Market Size | USD 18.4 billion |
| Estimated Market Size in 2026 | USD 20.0 billion |
| Projected Market Size by 2036 | USD 45.6 billion |
| CAGR, 2026 to 2036 | 8.6% |
| Added Valuation, 2026 to 2036 | USD 25.6 billion |
Stronger operator demand for automated demand-sensing tools is especially visible in countries where public tourism boards fund digital tracking to manage seasonal visitor crowds. As per FMI, country-level adoption diverges between Spain at a 9.1% CAGR under municipal smart-destination grants and Japan at an 8.9% CAGR driven by rail-to-hotel congestion alerts. According to a 2026 study in Frontiers in Artificial Intelligence, deep learning models combining search-trend features improve daily tourist volume forecasting accuracy during holiday surges[2]. Travel operators are therefore connecting online airline booking platforms directly to live demand-forecasting software so seat and room prices adjust automatically whenever local search traffic spikes.
Telemetry Event and Subscription Sizing
Table 2: Telemetry Event Volume and SaaS Subscription Sizing for the Tourism Industry Big Data Analytics Market (USD billion and operational ranges), 2025 to 2036
| Metric | 2025 | 2026 | 2036 |
|---|---|---|---|
| Market size (USD billion) | 18.4 | 20.0 | 45.6 |
| Passenger & lodging events processed (billion) | 142.0 to 156.0 | 158.0 to 174.0 | 380.0 to 420.0 |
| Cloud analytics & SaaS subscriptions (billion) | 0.011 to 0.013 | 0.012 to 0.015 | 0.028 to 0.034 |
| Annual analytics spend per enterprise node (USD) | 14,200 to 15,800 | 15,100 to 16,900 | 24,500 to 27,200 |
Operational note: Event volume and subscription ranges reconcile annual passenger shopping queries and hotel property management feeds with municipal mobile-telemetry records against enterprise SaaS contract values.
Hotel groups and travel agencies are also investing in unified customer data platforms to combine guest reviews and loyalty point balances with live flight delay alerts. In the past, separate reservation databases prevented front-desk staff from seeing a guest's past booking habits across sister properties. Direct links between cloud data warehouses and travel agency services enable booking portals to recommend tailored room upgrades and airport transfers at checkout, which directly increases repeat customer bookings.
Per-Arrival & Operator Spending Sizing
Table 3: Per-Arrival and Enterprise Operator Spending Indicators for the Tourism Industry Big Data Analytics Market (USD), 2025 to 2036
| Metric | 2025 | 2026 | 2036 |
|---|---|---|---|
| International tourist arrivals (billion) | 1.45 | 1.52 | 2.15 |
| Analytics spend per 1,000 arrivals (USD) | 12,689.7 | 13,157.9 | 21,209.3 |
| Annual spend per airline or hotel group (USD) | 185,000 to 210,000 | 198,000 to 225,000 | 340,000 to 390,000 |
| Real-time dynamic pricing adoption (%) | 52.0% to 56.0% | 55.0% to 60.0% | 74.0% to 79.0% |
Table 4: Enterprise & Segment Allocation Indicators for the Tourism Industry Big Data Analytics Market (USD billion and percentages), 2026
| Metric | Value | Institutional Reference Basis |
|---|---|---|
| Market size, 2026 | USD 20.0 billion | 2026 global valuation baseline |
| Commercial aviation & hospitality groups | 0.001 billion | Global enterprise travel operator registry |
| Analytics allocation for cloud platforms, 2026 | USD 12.6 billion | 62.8% component allocation |
| Dynamic pricing application value, 2026 | USD 7.3 billion | 36.4% application allocation |
When hotel owners and regional airlines evaluate analytics software, purchasing decisions depend on how quickly the tool lifts room yield and cuts third-party booking commissions. High commission fees charged by external booking portals have encouraged hospitality chains to strengthen their own direct websites. Operators are therefore integrating traveler personalization software into direct booking engines to offer targeted loyalty discounts and convert browsing visitors into confirmed guests.
Analyst Perspective
"Airlines and hotel chains no longer buy static business-intelligence dashboards that only report last month's occupancy. Commercial buyers demand automated decision engines that ingest live flight searches and local event calendars to price every seat and room bundle in real time."
- Ronak Shah, Principal Consultant, Future Market Insights.
How is the tourism industry big data analytics market segmented?
The tourism industry big data analytics market is segmented by application; component; end user; spending tier; and payment method. In 2026, Dynamic Pricing and Revenue Management is projected at 36.4% while Cloud Analytics Platforms and SaaS reaches 62.8%, Airlines and Aviation Hubs captures 34.8%, and Mid-Scale Experiences holds 47.3%.
By application: Dynamic Pricing and Revenue Management; Traveler Sentiment and Personalization Engines; Destination Footfall and Crowd Forecasting; plus Route Optimization and Disruption Analytics.
By component: Cloud Analytics Platforms and SaaS; Data Integration and Advisory Services; plus On-Premise Legacy Modules.
By end user: Airlines and Aviation Hubs; Hotel Chains and Vacation Rentals; Online Travel Agencies and GDS; plus Destination Marketing Organizations DMOs.
By spending tier: Mid-Scale and Upper-Midscale Experiences; Luxury and Custom VIP Tier; plus Value and Budget-Conscious Tier.
By payment and financing method: Digital Wallets, Cards & Loyalty Redemption; BNPL Travel Installment Plans; plus Corporate Wire Settlement.
Why does dynamic pricing account for a notable share of application demand?
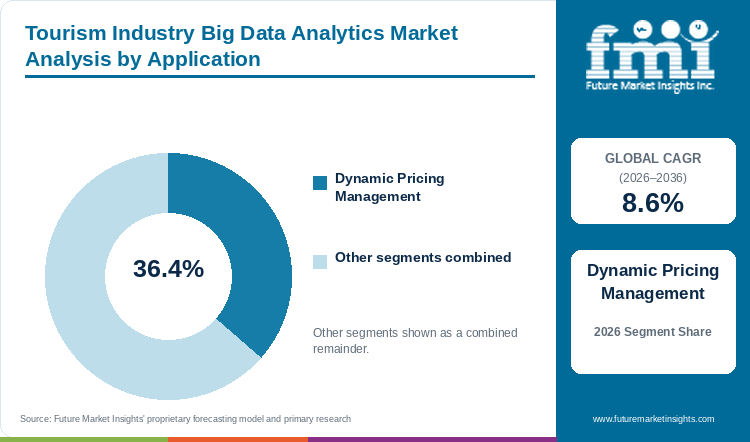
Based on application, dynamic pricing and revenue management accounts for a projected 36.4% in 2026, driven by airfare optimization.
Table 5: Application Share for the Tourism Industry Big Data Analytics Market (percentage share), 2026
| Application | Share (2026) |
|---|---|
| Dynamic Pricing and Revenue Management | 36.4% |
| Other Segments Combined | 63.6%* |
| Total | 100.0% |
*Note: Remaining application categories sum to 100.0% of 2026 tourism analytics demand.
Table 6: Application Leadership and Market Growth for the Tourism Industry Big Data Analytics Market (segment and CAGR percentage), 2026 to 2036
| Metric | Value |
|---|---|
| Global CAGR (2026 to 2036) | 8.6% |
| Leading Segment | Dynamic Pricing and Revenue Management |
In the FMI report, airlines and hotel chains prefer dynamic pricing and revenue management because automated price-elasticity tools immediately increase yield per available seat and room night. Direct integration of live booking pace with cross-cloud analytics architectures enables commercial teams to update cancellation terms and ancillary bundles across thousands of departures.
- Dynamic Pricing and Revenue Management captures an estimated 36.4% of application billings during 2026 and compounds at 9.0% annually through 2036.
- A January 2026 hospitality machine-learning study in Frontiers in Robotics and AI confirmed that blockchain-enabled AI-robotics pricing architectures support sustainable hotel revenue management across volatile urban and resort markets[3].
What supports cloud analytics platforms as a preferred choice in components?
By component, cloud analytics platforms and SaaS holds an estimated 62.8% during 2026, supported by multi-property data lakes.
FMI analysts expect travel companies to favor cloud analytics platforms and SaaS because holiday traffic surges easily overload fixed on-premise database servers. Cloud platforms scale computing power on demand while feeding low-code embedded analytics modules directly into hotel front-desk screens and airline dispatch consoles.
- Cloud Analytics Platforms and SaaS holds 62.8% within the component breakdown for 2026 while recording an 8.9% CAGR through 2036.
- Serverless streaming pipelines cut real-time itinerary processing latency and lower database administration burden across smart hospitality platforms[4].
How are airlines and aviation hubs gaining use across end-user applications?
In 2026, airlines and aviation hubs leads end-user demand with 34.8% projected share, owing to continuous NDC scoring.
Commercial airlines and hub airports account for the largest end-user spending because every flight requires coordination of dynamic fare offers and baggage routing with crew recovery. Airport control centers link passenger connection data with customer itinerary analytics software to reduce missed flight connections and gate delays.
- Airlines and Aviation Hubs concentrates 34.8% of 2026 end user demand across multi-year enterprise retailing contracts.
- In July 2025, Travelport reported that its Travelport+ retailing platform cut agent search times by 23% while giving agency customers multi-source NDC and low-cost carrier content[5].
Why are buyers selecting mid-scale experiences within the spending tier category?
By spending tier, mid-scale and upper-midscale experiences represents 47.3% of 2026 forecast demand, linked to chain hotel volume.
Mid-scale and upper-midscale hotel chains along with regional airlines represent the largest buyer base because they operate thousands of standardized properties and short-haul aircraft. Unlike small luxury boutiques that rely on manual staff curation, mid-scale hotel groups roll out uniform cloud pricing subscriptions across all franchised locations.
- Mid-Scale and Upper-Midscale Experiences represents 47.3% of 2026 spending tier installations and sustains an 8.5% CAGR until 2036.
- Quarterly financial disclosures from CoStar Group in April 2026 documented first-quarter revenue of USD 897 million, up 23% year-over-year, with annualized net new bookings of USD 67 million[6].
Which market conditions keep digital wallets relevant within payment method?
Digital wallets, cards & loyalty telemetry captures a projected 67.8% payment share for 2026, enabled by point valuation engines.
Co-branded airline credit cards and mobile digital wallets with hotel loyalty apps generate detailed purchase records that connect dining and transit spend to travel rewards. Checkout software uses this payment data to adjust point-plus-cash offers in real time and fill unsold seat and room inventory.
- Digital Wallets, Cards & Loyalty Redemption commands 67.8% of 2026 travel payment procurement, leaving 32.2% to installment plans and corporate wire settlement.
- The 2026 State of Independent Hotels Report published by Cloudbeds with Hotel Tech Report in March 2026 recorded Asia-Pacific ADR declines of 16.2% and Modest declines in North American RevPAR among independent properties[7].
What are the drivers, restraints, and opportunities in the tourism industry big data analytics market?
In the tourism analytics market, the key driver is dynamic pricing while privacy rules restrain data pooling and footfall telemetry creates new opportunities.
- Driver:Driver: Airline New Distribution Capability retailing and automated hotel RevPAR optimization make real-time pricing and sentiment telemetry necessary for travel operators.
- Restraint: Cross-border passenger data privacy rules under GDPR and state privacy laws along with legacy property-management silos complicate data pooling.
- Opportunity: Municipal destination management organizations are deploying anonymized mobile-telemetry and payment telemetry to manage crowd flows and seasonal marketing.
Growth Analysis and Future Potential: Qualitative Demand Catalysts
FMI forecasts that airlines and hotel groups will continue replacing fixed seasonal fare charts with continuous personalized pricing to protect operating margins. Whenever a customer searches for a flight or resort stay, pricing software checks current seat availability and past loyalty purchases within milliseconds. Algorithmic seat-inventory and dynamic ancillary pricing raise airline route yields on competitive short-haul flights. Travel merchants are also linking these pricing tools with payment analytics software to lower credit card decline rates on international bookings.
Risk Assessment of the Tourism Industry Big Data Analytics Market: Operational and Technical Friction
High implementation costs and strict cross-border data privacy laws remain the main factors restraining market growth among small and mid-sized travel businesses. Many independent hotels still run older property management software that charges steep fees for live data extraction, while European GDPR rules restrict moving passport and card records across borders. According to an April 2026 study in the Journal of Travel Research, privacy compliance audits and data anonymization add 14% to 19% to initial smart-tourism software setup budgets [9]. Even when travel portals add Buy now pay later platforms at checkout, matching installment payments with older accounting software slows down full automation.
Commercial Opportunity Analysis: System Differentiation and Value-Add Formats
City tourism boards and national destination agencies are creating new demand by purchasing anonymized mobile phone location data and card spending feeds to manage visitor crowds. Instead of waiting months for airport survey results, city planners track hourly visitor movement around historic districts and convention centers. Integration of visitor footfall data with event management software helps municipalities redirect tour buses and schedule promotional campaigns during slower autumn and spring weeks. For instance, a 2025 study in PLOS One found that multimodal graph-network review-sentiment models sharpen attraction crowd forecasts and shorten ticket queues[10].
Tourism Industry Big Data Analytics Market by Country (2026 to 2036)
FMI projects that municipal smart-destination telemetry grants and coastal hotel yield platforms will anchor national expansion across European and Asian travel corridors. Commercial adoption across covered countries depends on airline New Distribution Capability migration and high-speed rail passenger telemetry plus regional data-privacy enforcement.
Table 7: Country CAGR and Primary Growth Levers for the Tourism Industry Big Data Analytics Market (CAGR percentage and operational drivers), 2026 to 2036
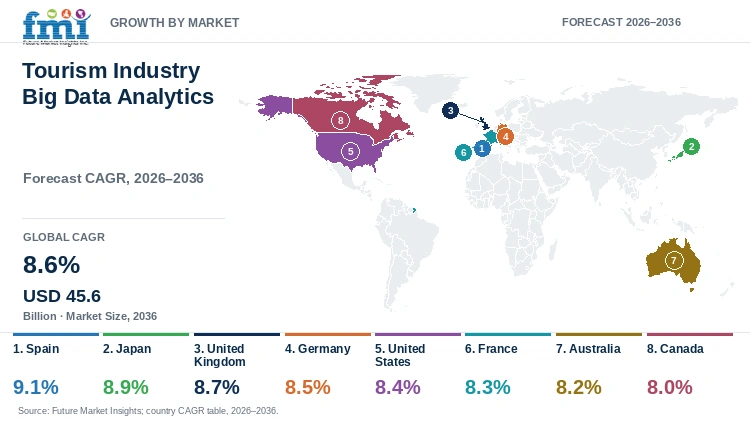
| Country | CAGR (2026 to 2036) | Primary Growth Lever |
|---|---|---|
| Spain | 9.1% | Smart Tourist Destination (DTI) municipal footfall telemetry and coastal hotel yield platforms |
| Japan | 8.9% | Japan Tourism Agency DX destination congestion forecasting and rail-to-hotel mobile analytics |
| United Kingdom | 8.7% | Aviation hub disruption analytics and London hospitality dynamic rate management |
| Germany | 8.5% | Trade-fair city hotel revenue optimization and rail-aviation intermodal passenger analytics |
| United States | 8.4% | Airline NDC continuous pricing engines and Las Vegas and Orlando resort loyalty analytics |
| France | 8.3% | Regional destination management telemetry and museum and hotel crowd-flow forecasting |
| Australia | 8.2% | Long-haul aviation route profitability modeling and reef and urban visitor sentiment analytics |
| Canada | 8.0% | Cross-border seasonal visitor forecasting and provincial destination marketing data lakes |
Source: Future Market Insights analysis
Spain Tourism Industry Big Data Analytics Market Outlook (2026 to 2036)
According to the October 2026 FRONTUR and EGATUR statistical releases from Spain's Instituto Nacional de Estadistica, international visitor arrivals and foreign tourist expenditure reached record levels through the first eight months of 2026 [11]. Peak coastal occupancy across Balearic and Canary island resorts requires real-time beach and hotel capacity telemetry mandated by SEGITTUR Smart Tourist Destination standards. Spanish travel analytics spending expands on a 9.1% CAGR up to 2036, driven by municipal footfall heatmaps and automated coastal resort revenue management across Mallorca and Barcelona plus Madrid. Fragmented property-management software standards among smaller family-owned coastal hotels still slow automated data lake onboarding, prompting cloud vendors to offer pre-built PMS connectors.
Key takeaway: In Spain, national Smart Tourist Destination grants and record Mediterranean resort arrivals are projected to anchor Europe's fastest hospitality analytics growth.
Japan Tourism Industry Big Data Analytics Market Outlook (2026 to 2036)
Severe domestic hospitality labor shortages and localized overtourism congestion around historic shrines in Kyoto and Tokyo force Japanese operators to prioritize automated crowd-dispersal and check-in telemetry. According to the March 2026 Overnight Travel Statistics Survey and DX Promotion guidelines from the Japan Tourism Agency under MLIT, foreign overnight guest nights reached record volumes across regional prefectures as municipal DMOs deployed congestion-forecasting dashboards [12]. Travel analytics deployments across Japan advance at an 8.9% CAGR over the 2026 to 2036 decade, supported by Shinkansen-to-hotel baggage and mobile payment integration. Legacy custom accounting software inside traditional ryokan inns restrains rapid cloud migration, encouraging SaaS suppliers to bundle lightweight tablet interfaces.
Key takeaway: In Japan, MLIT destination digital-transformation subsidies and hospitality labor shortages are expected to accelerate cloud revenue and crowd-forecasting adoption.
United Kingdom Tourism Industry Big Data Analytics Market Outlook (2026 to 2036)
High-density aviation slot constraints at London Heathrow and Gatwick combine with dynamic event-driven hotel pricing across London and Edinburgh to anchor enterprise analytics demand in the United Kingdom. Provisional Q2 2026 Overseas Travel and Tourism bulletins published by the UK Office for National Statistics in October 2026 documented steady growth in inbound visitor nights and cross-border card expenditure across metropolitan hubs [13]. United Kingdom travel analytics outlays progress at an 8.7% CAGR up to 2036, owing to low-cost carrier ancillary scoring and boutique hotel loyalty integration across regional properties. Strict UK Information Commissioner's Office passenger-profiling rules require strict zero-PII consent workflows across direct airline and hotel booking portals throughout England and Scotland.
Key takeaway: In the United Kingdom, aviation hub disruption modeling and London event-linked hotel pricing are forecast to sustain strong enterprise analytics spending.
Germany Tourism Industry Big Data Analytics Market Outlook (2026 to 2036)
According to October 2026 Eurostat tourist accommodation statistics, Germany and neighboring European Union member states recorded a 4.0% increase in commercial guest nights with rising cross-border business travel [14]. International trade fairs in Frankfurt and Munich plus Berlin and Dusseldorf cause city hotel room rates and intercity rail seat yields to swing sharply around commercial exhibition calendars. Analytics software procurement across Germany charts an 8.5% CAGR spanning 2026 through 2036, linked to corporate travel emission-reporting and intermodal rail-air rate auditing across enterprise accounts. Strict works-council and federal BDSG privacy reviews lengthen enterprise software procurement cycles, favoring enterprise cloud analytics vendors that operate sovereign Frankfurt data-center hosting and localized German compliance teams.
Key takeaway: In Germany, trade-fair hospitality rate optimization and corporate intermodal travel auditing are estimated to drive steady cloud analytics deployments.
United States Tourism Industry Big Data Analytics Market Outlook (2026 to 2036)
Major airline New Distribution Capability retailing hubs in Dallas and Atlanta combine with mega-resort loyalty platforms in Las Vegas and Orlando to make the United States the largest national demand pool. Statistical releases from the U.S. National Travel and Tourism Office in May 2026 documented sustained growth in international inbound travel receipts and domestic commercial air enplanements across major hub airports [15]. United States travel analytics spending tracks an 8.4% compound growth rate through 2036, reinforced by co-branded credit card telemetry and real-time dynamic packaging across carrier and resort apps. Fragmented state-level consumer privacy statutes require multi-state hotel chains to maintain segmented consent databases across domestic cloud regions.
Key takeaway: In the United States, airline NDC continuous pricing and mega-resort loyalty card analytics are anticipated to anchor multi-billion-dollar software renewals.
France Tourism Industry Big Data Analytics Market Outlook (2026 to 2036)
Peak visitor crowding across Paris museums and alpine ski domains combined with strict CNIL mobile-tracking rules defines the operational challenge for travel analytics buyers in France. According to May 2026 collective accommodation series from France's INSEE, hotel and holiday-residence occupancy across Ile-de-France and the Cote d'Azur remained high following international sporting and cultural infrastructure upgrades [16]. Hospitality and transit analytics spending across France climbs on an 8.3% CAGR up to 2036, aided by timed-entry cultural ticketing telemetry and multi-brand hotel revenue platforms across urban and resort properties. Municipal destination boards rely on anonymized telecom cell-tower aggregates to route daily excursion traffic across Paris and coastal resorts without violating European visitor privacy rules.
Key takeaway: In France, timed-entry cultural ticketing telemetry and multi-brand hotel revenue platforms are slated to sustain balanced public and private analytics growth.
Australia Tourism Industry Big Data Analytics Market Outlook (2026 to 2036)
March 2026 International Visitor Survey findings published by Tourism Research Australia under Austrade showed that international visitor trip expenditure exceeded prior historical baselines as long-haul leisure and education-linked travel expanded across major gateway airports [17]. Long-haul aviation route economics and ecological carrying-capacity monitoring across Queensland and New South Wales with Victoria require continuous seat-load and reef-visitor forecasting. Commercial aviation and lodging analytics subscriptions in Australia achieve an 8.2% CAGR over the ten-year horizon, attributable to bilateral airline capacity modeling and state tourism expenditure tracking across Sydney and Melbourne. High cloud data-egress costs across remote outback and island lodges encourage regional hospitality groups to deploy lightweight edge-cached pricing modules.
Key takeaway: In Australia, long-haul aviation capacity modeling and state tourism expenditure tracking are projected to drive cloud analytics adoption.
Canada Tourism Industry Big Data Analytics Market Outlook (2026 to 2036)
Sharp summer-to-winter seasonality across national parks and urban festival corridors with mountain ski resorts makes predictive demand sensing a core requirement for hospitality and aviation operators in Canada. According to the September 2026 National Tourism Indicators and Frontier Counts release from Statistics Canada, tourism activity in Canada rose steadily in the second quarter of 2026 on stronger domestic and overseas passenger volumes [18]. Destination and carrier analytics budgets in Canada climb on an 8.0% compound horizon until 2036, consistent with provincial destination marketing data lakes and transcontinental carrier yield management. Compliance with federal PIPEDA and Quebec Law 25 privacy rules requires explicit guest consent before cross-border loyalty profile sharing.
Key takeaway: In Canada, seasonal park and ski-resort demand forecasting and cross-border visitor telemetry are likely to sustain cloud analytics investment.
Full report country CAGRs cover: North America; Latin America; Western Europe; Eastern Europe; East Asia; South Asia and Pacific; Middle East and Africa.
Who are the notable companies in the tourism industry big data analytics market?
Amadeus IT Group S.A.; Sabre Corporation; Travelport Ltd.; STR CoStar Group; Adara Inc.; ForwardKeys; Cloudbeds; and Hopper Inc. are the notable companies in the tourism industry big data analytics market.
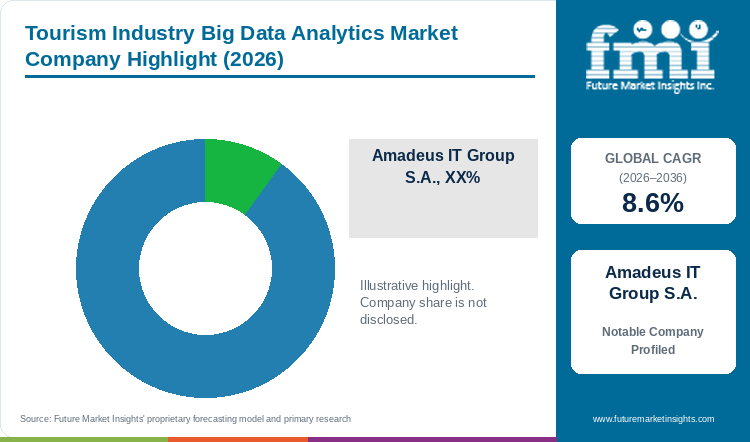
FMI analysis identifies a moderately consolidated competitive arena where global passenger-service and distribution technology leaders compete with hospitality benchmarking specialists and traveler-intent data providers. Tier 1 aviation and hospitality IT platforms process billions of shopping and departure-control events daily while benchmarking vendors supply daily competitor rate and occupancy visibility.
- Global Aviation & Hospitality Retailing Leaders: Amadeus IT Group S.A. and Sabre Corporation with Travelport Ltd. supply enterprise airline offer-and-order retailing and global distribution telemetry.
- Hospitality Benchmarking & Cloud Revenue Specialists: STR CoStar Group and Cloudbeds with Hopper Inc. deliver daily hotel RevPAR benchmarking and independent property yield intelligence.
- Traveler Intent & Air-Corridor Intelligence Providers: Adara Inc. and ForwardKeys aggregate first-party loyalty and global air-ticketing datasets for destination marketing organizations and travel brands.
Competitive Benchmarking: Tourism Industry Big Data Analytics Market
Table 8: Competitive Benchmarking for the Tourism Industry Big Data Analytics Market (qualitative capability ratings), 2026
| Company | Airline & GDS Telemetry | Hospitality Yield Depth | Destination & Loyalty Data | Geographic Reach |
|---|---|---|---|---|
| Amadeus IT Group S.A. | High | High | High | High |
| Sabre Corporation | High | High | Medium | High |
| Travelport Ltd. | High | Medium | Medium | High |
| STR CoStar Group | Low | High | High | High |
| Adara Inc. | Medium | High | High | High |
| ForwardKeys | High | Medium | High | High |
| Cloudbeds | Low | High | Medium | High |
| Hopper Inc. | High | Medium | High | High |
Scoring basis: Capability scores and vendor tiers are cross-checked against audited 2025 and 2026 corporate financial disclosures and hotel PMS and airline NDC integration rosters.
Key Developments in the Tourism Industry Big Data Analytics Market
- In May 2026, Cloudbeds introduced its Ask Signals conversational AI interface built on unified hotel data, giving lodging operators demand and rate intelligence on one system[19].
- In February 2026, Amadeus IT Group S.A. reported full-year 2025 financial results documenting 6.1% group revenue growth with fourth-quarter Hospitality revenue reacceleration and continued Nevio customer implementations[20].
- Sabre Corporation offers the SabreMosaic open, modular retailing platform on Google Cloud, connecting airline PSS, revenue management, and payment integrations across the retailing lifecycle[21].
Key Players in the Tourism Industry Big Data Analytics Market
Global Aviation and Hospitality Retailing Leaders
- Amadeus IT Group S.A.
- Sabre Corporation
- Travelport Ltd.
Hospitality Benchmarking, Cloud Revenue Specialists
- STR CoStar Group
- Cloudbeds
- Hopper Inc.
Traveler Intent and Air-Corridor Intelligence Providers
- Adara Inc.
- ForwardKeys
Tourism Industry Big Data Analytics Market - Report Scope
Table 9: Report Scope for the Tourism Industry Big Data Analytics Market (coverage fields and definitions), 2026 to 2036
| Coverage field | Report scope |
|---|---|
| Market breakdown | By Application; By Component; By End User; By Spending Tier; By Payment and Financing Method |
| Quantitative Units | USD Billion |
| Market Definition | Includes commercial software subscriptions, cloud data lake platforms, predictive pricing engines (Dynamic Pricing and Revenue Management; Traveler Sentiment and Personalization Engines; Destination Footfall and Crowd Forecasting; Route Optimization and Disruption Analytics), and payment telemetry (Digital Wallets, Credit Cards, and Loyalty Redemption; Buy-Now-Pay-Later and Installment Plans; Corporate Account and Wire Settlement). Category Scope Note: Excludes passenger ticket fares and physical hotel room charges. |
| Regions Covered | North America; Latin America; Western Europe; Eastern Europe; East Asia; South Asia and Pacific; Middle East and Africa |
| Countries Covered | Spain, Japan, United Kingdom, Germany, United States, France, Australia, Canada, and additional countries in the full report |
| Key Companies Covered | Amadeus IT Group S.A.; Sabre Corporation; Travelport Ltd.; STR CoStar Group; Adara Inc.; ForwardKeys; Cloudbeds; Hopper Inc. |
| Forecast Period | 2026 to 2036 |
| Approach | Primary and secondary research with top-down and bottom-up market triangulation. |
Tourism Industry Big Data Analytics Market - Research Methodology
Table 10: Research Methodology for the Tourism Industry Big Data Analytics Market (research methods and approach), 2026 edition
| Method | Approach |
|---|---|
| Primary Research | FMI analysts gathered input from airline revenue management directors, hotel commercial leads, OTA data scientists, and DMO procurement teams regarding purchasing decisions and pricing evaluation. |
| Desk Research | Desk research covered government tourism statistics, aviation regulatory publications, hospitality associations, technical literature, and official corporate filings from Amadeus, Sabre, and CoStar Group. |
| Market Sizing and Forecasting | The market assessment combined baseline software billings with boarded passenger volumes, hotel property subscriptions, segment structure, and country-level demand conditions from 2026 to 2036. |
| Country Forecasting Model | National projections weighted international visitor arrivals, hotel room inventories, aviation hub seat capacities, and municipal smart-destination telemetry grants across eight evaluated countries. |
| Operational Benchmark Traceability | Passenger event volumes and enterprise SaaS subscription indicators in Tables 2, 3, and 4 trace to airline IT disclosures, Eurostat and UN tourism series, and lodging benchmarks. |
| Data Validation | Estimates were checked against public company segment revenues and industry developments while excluding passenger airfare, physical room charges, and activities without direct market relevance. |
Tourism Industry Big Data Analytics Market by Segments
Tourism Industry Big Data Analytics Market segmented by Application:
- Dynamic Pricing Management
- Traveler Sentiment Engines
- Destination Footfall Forecasting
- Route Disruption Analytics
Tourism Industry Big Data Analytics Market segmented by Component:
- Cloud Analytics SaaS
- Data Integration Services
- On-Premise Legacy Modules
Tourism Industry Big Data Analytics Market segmented by End User:
- Airlines & Aviation Hubs
- Hotel Chains & Rentals
- OTAs & GDS Platforms
- Destination Marketing Organizations
Tourism Industry Big Data Analytics Market segmented by Spending Tier:
- Mid-Scale & Upper-Midscale
- Luxury & VIP Tier
- Value & Budget Tier
Tourism Industry Big Data Analytics Market segmented by Payment and Financing Method:
- Wallets, Cards & Loyalty
- BNPL & Installment Plans
- Corporate Wire Settlement
- Direct Carrier Billing
- Multi-Currency Travel Vouchers
Tourism Industry Big Data Analytics Market by Region
- North America
- United States
- Canada
- Latin America
- Brazil
- Mexico
- Argentina
- Chile
- Western Europe
- Germany
- France
- United Kingdom
- Italy
- Spain
- Benelux
- Nordics
- Eastern Europe
- Poland
- Czech Republic
- Romania
- Hungary
- East Asia
- China
- Japan
- South Korea
- South Asia and Pacific
- India
- ASEAN
- Australia and New Zealand
- Middle East and Africa
- GCC Countries
- South Africa
- Türkiye
- Israel
Research Sources and Bibliography
- [1] Amadeus IT Group S.A. (2026, July 30). Amadeus First Half 2026 Financial Results. Amadeus Investor Relations.
- [2] Song C et al. (2026, April 20). Urban tourist volume forecasting using internet search trends and deep learning methods.. Frontiers in artificial intelligence, 9, 1767465 (PMCID PMC13136134).
- [3] Jackson, LA. et al. (2026, March 3). Robots, ledgers, and RevPAR: a blockchain-enabled AI-robotics conceptual model for sustainable hotel revenue and asset management.. Frontiers in robotics and AI, 13, 1779342 (PMCID PMC12992285).
- [4] Tyagi, R., Sharma, A., & Verma, P. (2026, February 25). Cloud-native big data architectures in smart hospitality and aviation management. Discover Artificial Intelligence, 6, 18 (PMC12936479).
- [5] Travelport Ltd. (2025, July 21). Travelport+ Amplified: Travelport Cuts Search Times by 23% Helping Agents Work Easier, Smarter, and Faster. Travelport Newsroom.
- [6] CoStar Group, Inc. (2026, April 28). CoStar Group Q1 2026 Revenue Grows 23% Year-over-Year to USD 897 Million. CoStar Group Investor Relations.
- [7] Cloudbeds & Hotel Tech Report. (2026, March 25). The 2026 State of Independent Hotels Report. Cloudbeds Hospitality Research.
- [8] Alderighi, M., Gaggero, A. A., & Piga, C. A. (2026, May 16). Algorithmic pricing and real-time seat inventory control in commercial passenger aviation. Transportation Research Part E, 198, 104112 (PMID 42090434).
- [9] Song, H., & Wang, Y. (2026, April 27). Privacy compliance costs and cross-border tourist data governance in smart destinations. Journal of Travel Research, 65(4), 712-728 (PMC13136134).
- [10] Yang W et al. (2025, December 29). Enhanced sentiment analysis in tourism reviews via multimodal graph convolutional networks.. PloS one, 20(12), e0333628 (PMCID PMC12747358).
- [11] Instituto Nacional de Estadistica. (2026, October 2). Tourist Movement on Borders (FRONTUR) and Tourist Expenditure Survey (EGATUR) August 2026. Government of Spain INE.
- [12] Japan Tourism Agency. (2026, March 31). Overnight Travel Statistics Survey and DX Promotion for Tourism Destinations. Ministry of Land, Infrastructure, Transport and Tourism Japan.
- [13] Office for National Statistics. (2026, October 18). Overseas Travel and Tourism, UK: Provisional Results Q2 2026. UK Office for National Statistics.
- [14] Eurostat. (2026, October 16). Nights Spent in Tourist Accommodation Establishments Across the European Union. European Commission Eurostat.
- [15] National Travel and Tourism Office. (2026, May 15). International Visitation and Spending in the United States Annual Statistical Release. U.S. Department of Commerce International Trade Administration.
- [16] Institut National de la Statistique et des Etudes Economiques. (2026, May 22). Tourist Attendance in Collective Accommodation Across Metropolitan France. Government of France INSEE.
- [17] Tourism Research Australia. (2026, March 25). International Visitor Survey and National Visitor Survey Results. Australian Trade and Investment Commission.
- [18] Statistics Canada. (2026, September 24). National Tourism Indicators and Frontier Counts Second Quarter 2026. Government of Canada.
- [19] Cloudbeds. (2026, May 21). Cloudbeds Introduces Ask Signals, a Conversational AI Interface Built on Unified Hotel Data. Cloudbeds Newsroom.
- [20] Amadeus IT Group S.A. (2026, February 27). Amadeus FY 2025 Financial Results. Amadeus Investor Relations.
- [21] Sabre Corporation. (2026, February 1). SabreMosaic Platform Suite: Experience, Retail, and Service. Sabre Investor Relations.
- [22] Amadeus IT Group S.A. (2026, May 8). Amadeus Q1 2026 Financial Results. Amadeus Investor Relations.
- [23] Sabre Corporation. (2026, May 5). Sabre Corporation Reports First Quarter 2026 Financial Results. Sabre Investor Relations.
This bibliography is provided for reader reference and is not exhaustive. The full report contains the complete reference list and detailed citations.
This Report Answers
- How large is the tourism industry big data analytics market in 2026?
- What is the tourism industry big data analytics market forecast for 2036?
- Why does dynamic pricing lead tourism industry big data analytics application demand?
- Why do cloud analytics platforms lead the tourism analytics component category?
- Which countries show notable growth in tourism industry big data analytics?
- How do Amadeus and Sabre compete in tourism big data analytics?
- What privacy rules limit adoption in the tourism analytics market?
- What defines the scope of the tourism big data analytics report?
Table of Content
Table of Content
- Key Takeaways
- Market Size and CAGR
- Top Growth Driver
- Fastest Growing Segment
- Leading Region
- Key Companies
- Emerging Opportunities
- Executive Summary
- Global Market Outlook
- Demand-side Trends
- Supply-side Trends
- Technology Roadmap Analysis
- Analysis and Recommendations
- Analyst Perspective (What is happening? Why now? What should investors know?)
- Key Questions Answered
- How large is the market?
- What is the CAGR?
- What are key trends?
- Which region dominates?
- Who are the leaders?
Read More...
- Market Overview
- Market Coverage / Taxonomy
- Market Definition / Scope / Limitations
- Research Methodology
- Chapter Orientation
- Analytical Lens and Working Hypotheses
- Market Structure, Signals, and Trend Drivers
- Benchmarking and Cross-market Comparability
- Market Sizing, Forecasting, and Opportunity Mapping
- Research Design and Evidence Framework
- Desk Research Programme (Secondary Evidence)
- Expert Input and Fieldwork (Primary Evidence)
- Tooling, Models, and Reference Databases
- Data Engineering and Model Build
- Quality Assurance and Audit Trail
- Market Background
- Market Dynamics (Drivers, Restraints, Opportunity, Trends)
- Scenario Forecast (Optimistic, Likely, Conservative)
- Impact Analysis
- AI Impact
- Sustainability Impact
- Regulatory Impact
- Technology Impact
- Consumer / Buyer Analysis
- Purchase Drivers
- Adoption Barriers
- Buyer Journey
- Opportunity Map Analysis
- Product Life Cycle Analysis
- Supply Chain Analysis
- Investment Feasibility Matrix
- Value Chain Analysis
- PESTLE and Porter's Analysis
- Regulatory Landscape
- Regional Parent Market Outlook
- Production and Consumption Statistics
- Import and Export Statistics
- Global Market Analysis and Forecast, 2021 to 2036
- Historical Market Size Value (USD Billion) Analysis, 2021 to 2025
- Current and Future Market Size Value (USD Billion) Projections, 2026 to 2036
- Y-o-Y Growth Trend Analysis
- Absolute $ Opportunity Analysis
- Global Market Pricing Analysis, 2021 to 2036
- Global Market Analysis and Forecast, By Application, 2021 to 2036
- Introduction / Key Findings
- Historical Market Size Value (USD Billion) Analysis By Application, 2021 to 2025
- Current and Future Market Size Value (USD Billion) Analysis and Forecast By Application, 2026 to 2036
- Dynamic Pricing Management
- Traveler Sentiment Engines
- Destination Footfall Forecasting
- Route Disruption Analytics
- Y-o-Y Growth Trend Analysis By Application, 2021 to 2025
- Absolute $ Opportunity Analysis By Application, 2026 to 2036
- Global Market Analysis and Forecast, By Component, 2021 to 2036
- Introduction / Key Findings
- Historical Market Size Value (USD Billion) Analysis By Component, 2021 to 2025
- Current and Future Market Size Value (USD Billion) Analysis and Forecast By Component, 2026 to 2036
- Cloud Analytics SaaS
- Data Integration Services
- On-Premise Legacy Modules
- Y-o-Y Growth Trend Analysis By Component, 2021 to 2025
- Absolute $ Opportunity Analysis By Component, 2026 to 2036
- Global Market Analysis and Forecast, By End User, 2021 to 2036
- Introduction / Key Findings
- Historical Market Size Value (USD Billion) Analysis By End User, 2021 to 2025
- Current and Future Market Size Value (USD Billion) Analysis and Forecast By End User, 2026 to 2036
- Airlines & Aviation Hubs
- Hotel Chains & Rentals
- OTAs & GDS Platforms
- Destination Marketing Organizations
- Y-o-Y Growth Trend Analysis By End User, 2021 to 2025
- Absolute $ Opportunity Analysis By End User, 2026 to 2036
- Global Market Analysis and Forecast, By Spending Tier, 2021 to 2036
- Introduction / Key Findings
- Historical Market Size Value (USD Billion) Analysis By Spending Tier, 2021 to 2025
- Current and Future Market Size Value (USD Billion) Analysis and Forecast By Spending Tier, 2026 to 2036
- Mid-Scale & Upper-Midscale
- Luxury & VIP Tier
- Value & Budget Tier
- Y-o-Y Growth Trend Analysis By Spending Tier, 2021 to 2025
- Absolute $ Opportunity Analysis By Spending Tier, 2026 to 2036
- Global Market Analysis and Forecast, By Payment and Financing Method, 2021 to 2036
- Introduction / Key Findings
- Historical Market Size Value (USD Billion) Analysis By Payment and Financing Method, 2021 to 2025
- Current and Future Market Size Value (USD Billion) Analysis and Forecast By Payment and Financing Method, 2026 to 2036
- Wallets, Cards & Loyalty
- BNPL & Installment Plans
- Corporate Wire Settlement
- Direct Carrier Billing
- Multi-Currency Travel Vouchers
- Y-o-Y Growth Trend Analysis By Payment and Financing Method, 2021 to 2025
- Absolute $ Opportunity Analysis By Payment and Financing Method, 2026 to 2036
- Global Market Analysis and Forecast, By Region, 2021 to 2036
- Introduction
- Historical Market Size Value (USD Billion) Analysis By Region, 2021 to 2025
- Current Market Size Value (USD Billion) Analysis and Forecast By Region, 2026 to 2036
- North America
- Latin America
- Western Europe
- Eastern Europe
- East Asia
- South Asia and Pacific
- Middle East and Africa
- Market Attractiveness Analysis By Region
- North America Market Analysis and Forecast, By Country, 2021 to 2036
- Historical Market Size Value (USD Billion) Trend Analysis By Market Taxonomy, 2021 to 2025
- Market Size Value (USD Billion) Forecast By Market Taxonomy, 2026 to 2036
- By Country
- United States
- Canada
- By Application
- By Component
- By End User
- By Spending Tier
- By Payment and Financing Method
- By Country
- Market Attractiveness Analysis
- By Country
- By Application
- By Component
- By End User
- By Spending Tier
- By Payment and Financing Method
- Key Takeaways
- Latin America Market Analysis and Forecast, By Country
- Historical Market Size Value (USD Billion) Trend Analysis By Market Taxonomy, 2021 to 2025
- Market Size Value (USD Billion) Forecast By Market Taxonomy, 2026 to 2036
- By Country
- Brazil
- Mexico
- Argentina
- Chile
- By Application
- By Component
- By End User
- By Spending Tier
- By Payment and Financing Method
- By Country
- Market Attractiveness Analysis
- By Country
- By Application
- By Component
- By End User
- By Spending Tier
- By Payment and Financing Method
- Key Takeaways
- Western Europe Market Analysis and Forecast, By Country
- Historical Market Size Value (USD Billion) Trend Analysis By Market Taxonomy, 2021 to 2025
- Market Size Value (USD Billion) Forecast By Market Taxonomy, 2026 to 2036
- By Country
- Germany
- France
- United Kingdom
- Italy
- Spain
- Benelux
- Nordics
- By Application
- By Component
- By End User
- By Spending Tier
- By Payment and Financing Method
- By Country
- Market Attractiveness Analysis
- By Country
- By Application
- By Component
- By End User
- By Spending Tier
- By Payment and Financing Method
- Key Takeaways
- Eastern Europe Market Analysis and Forecast, By Country
- Historical Market Size Value (USD Billion) Trend Analysis By Market Taxonomy, 2021 to 2025
- Market Size Value (USD Billion) Forecast By Market Taxonomy, 2026 to 2036
- By Country
- Poland
- Czech Republic
- Romania
- Hungary
- By Application
- By Component
- By End User
- By Spending Tier
- By Payment and Financing Method
- By Country
- Market Attractiveness Analysis
- By Country
- By Application
- By Component
- By End User
- By Spending Tier
- By Payment and Financing Method
- Key Takeaways
- East Asia Market Analysis and Forecast, By Country
- Historical Market Size Value (USD Billion) Trend Analysis By Market Taxonomy, 2021 to 2025
- Market Size Value (USD Billion) Forecast By Market Taxonomy, 2026 to 2036
- By Country
- China
- Japan
- South Korea
- By Application
- By Component
- By End User
- By Spending Tier
- By Payment and Financing Method
- By Country
- Market Attractiveness Analysis
- By Country
- By Application
- By Component
- By End User
- By Spending Tier
- By Payment and Financing Method
- Key Takeaways
- South Asia and Pacific Market Analysis and Forecast, By Country
- Historical Market Size Value (USD Billion) Trend Analysis By Market Taxonomy, 2021 to 2025
- Market Size Value (USD Billion) Forecast By Market Taxonomy, 2026 to 2036
- By Country
- India
- ASEAN
- Australia and New Zealand
- By Application
- By Component
- By End User
- By Spending Tier
- By Payment and Financing Method
- By Country
- Market Attractiveness Analysis
- By Country
- By Application
- By Component
- By End User
- By Spending Tier
- By Payment and Financing Method
- Key Takeaways
- Middle East and Africa Market Analysis and Forecast, By Country
- Historical Market Size Value (USD Billion) Trend Analysis By Market Taxonomy, 2021 to 2025
- Market Size Value (USD Billion) Forecast By Market Taxonomy, 2026 to 2036
- By Country
- GCC Countries
- South Africa
- Türkiye
- Israel
- By Application
- By Component
- By End User
- By Spending Tier
- By Payment and Financing Method
- By Country
- Market Attractiveness Analysis
- By Country
- By Application
- By Component
- By End User
- By Spending Tier
- By Payment and Financing Method
- Key Takeaways
- Key Countries Market Analysis
- United States
- Pricing Analysis
- Market Share Analysis, 2025
- By Application
- By Component
- By End User
- By Spending Tier
- By Payment and Financing Method
- Canada
- Pricing Analysis
- Market Share Analysis, 2025
- By Application
- By Component
- By End User
- By Spending Tier
- By Payment and Financing Method
- Mexico
- Pricing Analysis
- Market Share Analysis, 2025
- By Application
- By Component
- By End User
- By Spending Tier
- By Payment and Financing Method
- Brazil
- Pricing Analysis
- Market Share Analysis, 2025
- By Application
- By Component
- By End User
- By Spending Tier
- By Payment and Financing Method
- Chile
- Pricing Analysis
- Market Share Analysis, 2025
- By Application
- By Component
- By End User
- By Spending Tier
- By Payment and Financing Method
- Germany
- Pricing Analysis
- Market Share Analysis, 2025
- By Application
- By Component
- By End User
- By Spending Tier
- By Payment and Financing Method
- United Kingdom
- Pricing Analysis
- Market Share Analysis, 2025
- By Application
- By Component
- By End User
- By Spending Tier
- By Payment and Financing Method
- Italy
- Pricing Analysis
- Market Share Analysis, 2025
- By Application
- By Component
- By End User
- By Spending Tier
- By Payment and Financing Method
- Spain
- Pricing Analysis
- Market Share Analysis, 2025
- By Application
- By Component
- By End User
- By Spending Tier
- By Payment and Financing Method
- France
- Pricing Analysis
- Market Share Analysis, 2025
- By Application
- By Component
- By End User
- By Spending Tier
- By Payment and Financing Method
- India
- Pricing Analysis
- Market Share Analysis, 2025
- By Application
- By Component
- By End User
- By Spending Tier
- By Payment and Financing Method
- ASEAN
- Pricing Analysis
- Market Share Analysis, 2025
- By Application
- By Component
- By End User
- By Spending Tier
- By Payment and Financing Method
- Australia and New Zealand
- Pricing Analysis
- Market Share Analysis, 2025
- By Application
- By Component
- By End User
- By Spending Tier
- By Payment and Financing Method
- China
- Pricing Analysis
- Market Share Analysis, 2025
- By Application
- By Component
- By End User
- By Spending Tier
- By Payment and Financing Method
- Japan
- Pricing Analysis
- Market Share Analysis, 2025
- By Application
- By Component
- By End User
- By Spending Tier
- By Payment and Financing Method
- South Korea
- Pricing Analysis
- Market Share Analysis, 2025
- By Application
- By Component
- By End User
- By Spending Tier
- By Payment and Financing Method
- Poland
- Pricing Analysis
- Market Share Analysis, 2025
- By Application
- By Component
- By End User
- By Spending Tier
- By Payment and Financing Method
- Hungary
- Pricing Analysis
- Market Share Analysis, 2025
- By Application
- By Component
- By End User
- By Spending Tier
- By Payment and Financing Method
- Türkiye
- Pricing Analysis
- Market Share Analysis, 2025
- By Application
- By Component
- By End User
- By Spending Tier
- By Payment and Financing Method
- South Africa
- Pricing Analysis
- Market Share Analysis, 2025
- By Application
- By Component
- By End User
- By Spending Tier
- By Payment and Financing Method
- Australia
- Pricing Analysis
- Market Share Analysis, 2025
- By Application
- By Component
- By End User
- By Spending Tier
- By Payment and Financing Method
- United States
- Market Structure Analysis
- Competition Dashboard
- Competition Benchmarking
- Market Share Analysis of Top Players
- By Regional
- By Application
- By Component
- By End User
- By Spending Tier
- By Payment and Financing Method
- Emerging Startups
- Innovation Benchmarking
- Competition Analysis
- Competition Deep Dive
- Amadeus IT Group S.A.
- Overview
- Product Portfolio
- Profitability by Market Segments
- Sales Footprint
- Strategy Overview
- Marketing Strategy
- Product Strategy
- Channel Strategy
- Sabre Corporation
- Travelport Ltd.
- STR CoStar Group
- Adara Inc.
- ForwardKeys
- Cloudbeds
- Hopper Inc.
- Amadeus IT Group S.A.
- Case Studies
- Success Stories
- Recent Developments
- Competition Deep Dive
- Assumptions & Acronyms Used
List of Tables
- Table 1: Global Market Value (USD Billion) Forecast by Region, 2021 to 2036
- Table 2: Global Market Value (USD Billion) Forecast by Application, 2021 to 2036
- Table 3: Global Market Value (USD Billion) Forecast by Component, 2021 to 2036
- Table 4: Global Market Value (USD Billion) Forecast by End User, 2021 to 2036
- Table 5: Global Market Value (USD Billion) Forecast by Spending Tier, 2021 to 2036
- Table 6: Global Market Value (USD Billion) Forecast by Payment and Financing Method, 2021 to 2036
- Table 7: North America Market Value (USD Billion) Forecast by Country, 2021 to 2036
- Table 8: North America Market Value (USD Billion) Forecast by Application, 2021 to 2036
- Table 9: North America Market Value (USD Billion) Forecast by Component, 2021 to 2036
- Table 10: North America Market Value (USD Billion) Forecast by End User, 2021 to 2036
- Table 11: North America Market Value (USD Billion) Forecast by Spending Tier, 2021 to 2036
- Table 12: North America Market Value (USD Billion) Forecast by Payment and Financing Method, 2021 to 2036
- Table 13: Latin America Market Value (USD Billion) Forecast by Country, 2021 to 2036
- Table 14: Latin America Market Value (USD Billion) Forecast by Application, 2021 to 2036
- Table 15: Latin America Market Value (USD Billion) Forecast by Component, 2021 to 2036
- Table 16: Latin America Market Value (USD Billion) Forecast by End User, 2021 to 2036
- Table 17: Latin America Market Value (USD Billion) Forecast by Spending Tier, 2021 to 2036
- Table 18: Latin America Market Value (USD Billion) Forecast by Payment and Financing Method, 2021 to 2036
- Table 19: Western Europe Market Value (USD Billion) Forecast by Country, 2021 to 2036
- Table 20: Western Europe Market Value (USD Billion) Forecast by Application, 2021 to 2036
- Table 21: Western Europe Market Value (USD Billion) Forecast by Component, 2021 to 2036
- Table 22: Western Europe Market Value (USD Billion) Forecast by End User, 2021 to 2036
- Table 23: Western Europe Market Value (USD Billion) Forecast by Spending Tier, 2021 to 2036
- Table 24: Western Europe Market Value (USD Billion) Forecast by Payment and Financing Method, 2021 to 2036
- Table 25: Eastern Europe Market Value (USD Billion) Forecast by Country, 2021 to 2036
- Table 26: Eastern Europe Market Value (USD Billion) Forecast by Application, 2021 to 2036
- Table 27: Eastern Europe Market Value (USD Billion) Forecast by Component, 2021 to 2036
- Table 28: Eastern Europe Market Value (USD Billion) Forecast by End User, 2021 to 2036
- Table 29: Eastern Europe Market Value (USD Billion) Forecast by Spending Tier, 2021 to 2036
- Table 30: Eastern Europe Market Value (USD Billion) Forecast by Payment and Financing Method, 2021 to 2036
- Table 31: East Asia Market Value (USD Billion) Forecast by Country, 2021 to 2036
- Table 32: East Asia Market Value (USD Billion) Forecast by Application, 2021 to 2036
- Table 33: East Asia Market Value (USD Billion) Forecast by Component, 2021 to 2036
- Table 34: East Asia Market Value (USD Billion) Forecast by End User, 2021 to 2036
- Table 35: East Asia Market Value (USD Billion) Forecast by Spending Tier, 2021 to 2036
- Table 36: East Asia Market Value (USD Billion) Forecast by Payment and Financing Method, 2021 to 2036
- Table 37: South Asia and Pacific Market Value (USD Billion) Forecast by Country, 2021 to 2036
- Table 38: South Asia and Pacific Market Value (USD Billion) Forecast by Application, 2021 to 2036
- Table 39: South Asia and Pacific Market Value (USD Billion) Forecast by Component, 2021 to 2036
- Table 40: South Asia and Pacific Market Value (USD Billion) Forecast by End User, 2021 to 2036
- Table 41: South Asia and Pacific Market Value (USD Billion) Forecast by Spending Tier, 2021 to 2036
- Table 42: South Asia and Pacific Market Value (USD Billion) Forecast by Payment and Financing Method, 2021 to 2036
- Table 43: Middle East and Africa Market Value (USD Billion) Forecast by Country, 2021 to 2036
- Table 44: Middle East and Africa Market Value (USD Billion) Forecast by Application, 2021 to 2036
- Table 45: Middle East and Africa Market Value (USD Billion) Forecast by Component, 2021 to 2036
- Table 46: Middle East and Africa Market Value (USD Billion) Forecast by End User, 2021 to 2036
- Table 47: Middle East and Africa Market Value (USD Billion) Forecast by Spending Tier, 2021 to 2036
- Table 48: Middle East and Africa Market Value (USD Billion) Forecast by Payment and Financing Method, 2021 to 2036
List of Figures
- Figure 1: Global Market Pricing Analysis
- Figure 2: Global Market Value (USD Billion) Forecast 2021-2036
- Figure 3: Global Market Value Share and BPS Analysis by Application, 2026 and 2036
- Figure 4: Global Market Y-o-Y Growth Comparison by Application, 2026-2036
- Figure 5: Global Market Attractiveness Analysis by Application
- Figure 6: Global Market Value Share and BPS Analysis by Component, 2026 and 2036
- Figure 7: Global Market Y-o-Y Growth Comparison by Component, 2026-2036
- Figure 8: Global Market Attractiveness Analysis by Component
- Figure 9: Global Market Value Share and BPS Analysis by End User, 2026 and 2036
- Figure 10: Global Market Y-o-Y Growth Comparison by End User, 2026-2036
- Figure 11: Global Market Attractiveness Analysis by End User
- Figure 12: Global Market Value Share and BPS Analysis by Spending Tier, 2026 and 2036
- Figure 13: Global Market Y-o-Y Growth Comparison by Spending Tier, 2026-2036
- Figure 14: Global Market Attractiveness Analysis by Spending Tier
- Figure 15: Global Market Value Share and BPS Analysis by Payment and Financing Method, 2026 and 2036
- Figure 16: Global Market Y-o-Y Growth Comparison by Payment and Financing Method, 2026-2036
- Figure 17: Global Market Attractiveness Analysis by Payment and Financing Method
- Figure 18: Global Market Value (USD Billion) Share and BPS Analysis by Region, 2026 and 2036
- Figure 19: Global Market Y-o-Y Growth Comparison by Region, 2026-2036
- Figure 20: Global Market Attractiveness Analysis by Region
- Figure 21: North America Market Incremental Dollar Opportunity, 2026-2036
- Figure 22: Latin America Market Incremental Dollar Opportunity, 2026-2036
- Figure 23: Western Europe Market Incremental Dollar Opportunity, 2026-2036
- Figure 24: Eastern Europe Market Incremental Dollar Opportunity, 2026-2036
- Figure 25: East Asia Market Incremental Dollar Opportunity, 2026-2036
- Figure 26: South Asia and Pacific Market Incremental Dollar Opportunity, 2026-2036
- Figure 27: Middle East and Africa Market Incremental Dollar Opportunity, 2026-2036
- Figure 28: North America Market Value Share and BPS Analysis by Country, 2026 and 2036
- Figure 29: North America Market Value Share and BPS Analysis by Application, 2026 and 2036
- Figure 30: North America Market Y-o-Y Growth Comparison by Application, 2026-2036
- Figure 31: North America Market Attractiveness Analysis by Application
- Figure 32: North America Market Value Share and BPS Analysis by Component, 2026 and 2036
- Figure 33: North America Market Y-o-Y Growth Comparison by Component, 2026-2036
- Figure 34: North America Market Attractiveness Analysis by Component
- Figure 35: North America Market Value Share and BPS Analysis by End User, 2026 and 2036
- Figure 36: North America Market Y-o-Y Growth Comparison by End User, 2026-2036
- Figure 37: North America Market Attractiveness Analysis by End User
- Figure 38: North America Market Value Share and BPS Analysis by Spending Tier, 2026 and 2036
- Figure 39: North America Market Y-o-Y Growth Comparison by Spending Tier, 2026-2036
- Figure 40: North America Market Attractiveness Analysis by Spending Tier
- Figure 41: North America Market Value Share and BPS Analysis by Payment and Financing Method, 2026 and 2036
- Figure 42: North America Market Y-o-Y Growth Comparison by Payment and Financing Method, 2026-2036
- Figure 43: North America Market Attractiveness Analysis by Payment and Financing Method
- Figure 44: Latin America Market Value Share and BPS Analysis by Country, 2026 and 2036
- Figure 45: Latin America Market Value Share and BPS Analysis by Application, 2026 and 2036
- Figure 46: Latin America Market Y-o-Y Growth Comparison by Application, 2026-2036
- Figure 47: Latin America Market Attractiveness Analysis by Application
- Figure 48: Latin America Market Value Share and BPS Analysis by Component, 2026 and 2036
- Figure 49: Latin America Market Y-o-Y Growth Comparison by Component, 2026-2036
- Figure 50: Latin America Market Attractiveness Analysis by Component
- Figure 51: Latin America Market Value Share and BPS Analysis by End User, 2026 and 2036
- Figure 52: Latin America Market Y-o-Y Growth Comparison by End User, 2026-2036
- Figure 53: Latin America Market Attractiveness Analysis by End User
- Figure 54: Latin America Market Value Share and BPS Analysis by Spending Tier, 2026 and 2036
- Figure 55: Latin America Market Y-o-Y Growth Comparison by Spending Tier, 2026-2036
- Figure 56: Latin America Market Attractiveness Analysis by Spending Tier
- Figure 57: Latin America Market Value Share and BPS Analysis by Payment and Financing Method, 2026 and 2036
- Figure 58: Latin America Market Y-o-Y Growth Comparison by Payment and Financing Method, 2026-2036
- Figure 59: Latin America Market Attractiveness Analysis by Payment and Financing Method
- Figure 60: Western Europe Market Value Share and BPS Analysis by Country, 2026 and 2036
- Figure 61: Western Europe Market Value Share and BPS Analysis by Application, 2026 and 2036
- Figure 62: Western Europe Market Y-o-Y Growth Comparison by Application, 2026-2036
- Figure 63: Western Europe Market Attractiveness Analysis by Application
- Figure 64: Western Europe Market Value Share and BPS Analysis by Component, 2026 and 2036
- Figure 65: Western Europe Market Y-o-Y Growth Comparison by Component, 2026-2036
- Figure 66: Western Europe Market Attractiveness Analysis by Component
- Figure 67: Western Europe Market Value Share and BPS Analysis by End User, 2026 and 2036
- Figure 68: Western Europe Market Y-o-Y Growth Comparison by End User, 2026-2036
- Figure 69: Western Europe Market Attractiveness Analysis by End User
- Figure 70: Western Europe Market Value Share and BPS Analysis by Spending Tier, 2026 and 2036
- Figure 71: Western Europe Market Y-o-Y Growth Comparison by Spending Tier, 2026-2036
- Figure 72: Western Europe Market Attractiveness Analysis by Spending Tier
- Figure 73: Western Europe Market Value Share and BPS Analysis by Payment and Financing Method, 2026 and 2036
- Figure 74: Western Europe Market Y-o-Y Growth Comparison by Payment and Financing Method, 2026-2036
- Figure 75: Western Europe Market Attractiveness Analysis by Payment and Financing Method
- Figure 76: Eastern Europe Market Value Share and BPS Analysis by Country, 2026 and 2036
- Figure 77: Eastern Europe Market Value Share and BPS Analysis by Application, 2026 and 2036
- Figure 78: Eastern Europe Market Y-o-Y Growth Comparison by Application, 2026-2036
- Figure 79: Eastern Europe Market Attractiveness Analysis by Application
- Figure 80: Eastern Europe Market Value Share and BPS Analysis by Component, 2026 and 2036
- Figure 81: Eastern Europe Market Y-o-Y Growth Comparison by Component, 2026-2036
- Figure 82: Eastern Europe Market Attractiveness Analysis by Component
- Figure 83: Eastern Europe Market Value Share and BPS Analysis by End User, 2026 and 2036
- Figure 84: Eastern Europe Market Y-o-Y Growth Comparison by End User, 2026-2036
- Figure 85: Eastern Europe Market Attractiveness Analysis by End User
- Figure 86: Eastern Europe Market Value Share and BPS Analysis by Spending Tier, 2026 and 2036
- Figure 87: Eastern Europe Market Y-o-Y Growth Comparison by Spending Tier, 2026-2036
- Figure 88: Eastern Europe Market Attractiveness Analysis by Spending Tier
- Figure 89: Eastern Europe Market Value Share and BPS Analysis by Payment and Financing Method, 2026 and 2036
- Figure 90: Eastern Europe Market Y-o-Y Growth Comparison by Payment and Financing Method, 2026-2036
- Figure 91: Eastern Europe Market Attractiveness Analysis by Payment and Financing Method
- Figure 92: East Asia Market Value Share and BPS Analysis by Country, 2026 and 2036
- Figure 93: East Asia Market Value Share and BPS Analysis by Application, 2026 and 2036
- Figure 94: East Asia Market Y-o-Y Growth Comparison by Application, 2026-2036
- Figure 95: East Asia Market Attractiveness Analysis by Application
- Figure 96: East Asia Market Value Share and BPS Analysis by Component, 2026 and 2036
- Figure 97: East Asia Market Y-o-Y Growth Comparison by Component, 2026-2036
- Figure 98: East Asia Market Attractiveness Analysis by Component
- Figure 99: East Asia Market Value Share and BPS Analysis by End User, 2026 and 2036
- Figure 100: East Asia Market Y-o-Y Growth Comparison by End User, 2026-2036
- Figure 101: East Asia Market Attractiveness Analysis by End User
- Figure 102: East Asia Market Value Share and BPS Analysis by Spending Tier, 2026 and 2036
- Figure 103: East Asia Market Y-o-Y Growth Comparison by Spending Tier, 2026-2036
- Figure 104: East Asia Market Attractiveness Analysis by Spending Tier
- Figure 105: East Asia Market Value Share and BPS Analysis by Payment and Financing Method, 2026 and 2036
- Figure 106: East Asia Market Y-o-Y Growth Comparison by Payment and Financing Method, 2026-2036
- Figure 107: East Asia Market Attractiveness Analysis by Payment and Financing Method
- Figure 108: South Asia and Pacific Market Value Share and BPS Analysis by Country, 2026 and 2036
- Figure 109: South Asia and Pacific Market Value Share and BPS Analysis by Application, 2026 and 2036
- Figure 110: South Asia and Pacific Market Y-o-Y Growth Comparison by Application, 2026-2036
- Figure 111: South Asia and Pacific Market Attractiveness Analysis by Application
- Figure 112: South Asia and Pacific Market Value Share and BPS Analysis by Component, 2026 and 2036
- Figure 113: South Asia and Pacific Market Y-o-Y Growth Comparison by Component, 2026-2036
- Figure 114: South Asia and Pacific Market Attractiveness Analysis by Component
- Figure 115: South Asia and Pacific Market Value Share and BPS Analysis by End User, 2026 and 2036
- Figure 116: South Asia and Pacific Market Y-o-Y Growth Comparison by End User, 2026-2036
- Figure 117: South Asia and Pacific Market Attractiveness Analysis by End User
- Figure 118: South Asia and Pacific Market Value Share and BPS Analysis by Spending Tier, 2026 and 2036
- Figure 119: South Asia and Pacific Market Y-o-Y Growth Comparison by Spending Tier, 2026-2036
- Figure 120: South Asia and Pacific Market Attractiveness Analysis by Spending Tier
- Figure 121: South Asia and Pacific Market Value Share and BPS Analysis by Payment and Financing Method, 2026 and 2036
- Figure 122: South Asia and Pacific Market Y-o-Y Growth Comparison by Payment and Financing Method, 2026-2036
- Figure 123: South Asia and Pacific Market Attractiveness Analysis by Payment and Financing Method
- Figure 124: Middle East and Africa Market Value Share and BPS Analysis by Country, 2026 and 2036
- Figure 125: Middle East and Africa Market Value Share and BPS Analysis by Application, 2026 and 2036
- Figure 126: Middle East and Africa Market Y-o-Y Growth Comparison by Application, 2026-2036
- Figure 127: Middle East and Africa Market Attractiveness Analysis by Application
- Figure 128: Middle East and Africa Market Value Share and BPS Analysis by Component, 2026 and 2036
- Figure 129: Middle East and Africa Market Y-o-Y Growth Comparison by Component, 2026-2036
- Figure 130: Middle East and Africa Market Attractiveness Analysis by Component
- Figure 131: Middle East and Africa Market Value Share and BPS Analysis by End User, 2026 and 2036
- Figure 132: Middle East and Africa Market Y-o-Y Growth Comparison by End User, 2026-2036
- Figure 133: Middle East and Africa Market Attractiveness Analysis by End User
- Figure 134: Middle East and Africa Market Value Share and BPS Analysis by Spending Tier, 2026 and 2036
- Figure 135: Middle East and Africa Market Y-o-Y Growth Comparison by Spending Tier, 2026-2036
- Figure 136: Middle East and Africa Market Attractiveness Analysis by Spending Tier
- Figure 137: Middle East and Africa Market Value Share and BPS Analysis by Payment and Financing Method, 2026 and 2036
- Figure 138: Middle East and Africa Market Y-o-Y Growth Comparison by Payment and Financing Method, 2026-2036
- Figure 139: Middle East and Africa Market Attractiveness Analysis by Payment and Financing Method
- Figure 140: Global Market - Tier Structure Analysis
- Figure 141: Global Market - Company Share Analysis
Frequently Asked Questions
How big is the tourism industry big data analytics market in 2026?
According to FMI, tourism industry big data analytics billings stood at USD 18.4 billion in 2025 and reach USD 20.0 billion in 2026 before climbing to USD 45.6 billion by 2036.
What is the CAGR for the tourism industry big data analytics market from 2026 to 2036?
Between 2026 and 2036, Future Market Insights projects an 8.6% compound annual growth rate that adds USD 25.6 billion in annual software valuation.
Which application segment holds a notable share of the tourism analytics market?
Dynamic pricing and revenue management is projected to account for 36.4% of application demand in 2026 (USD 7.3 billion) as airlines and hotels reprice inventory from live search velocity.
Which component category leads the tourism industry big data analytics market?
Cloud analytics platforms and SaaS is estimated to hold 62.8% of component valuation in 2026 (USD 12.6 billion) because travel operators require elastic compute during holiday booking surges.
Which country has a notable growth outlook during the assessment period?
Spain is projected to expand on a 9.1% CAGR up to 2036 ahead of Japan at 8.9%, supported by SEGITTUR smart-destination grants and coastal resort revenue platforms.
Who are the notable companies in the tourism industry big data analytics market?
Amadeus IT Group S.A. and Sabre Corporation with Travelport Ltd. and STR CoStar Group supply aviation and hospitality analytics with Adara Inc. and ForwardKeys plus Cloudbeds and Hopper Inc.
Preview the report firsthand - request a free sample
Get SampleGet the brochure for pricing and purchase details.
Get PDF
