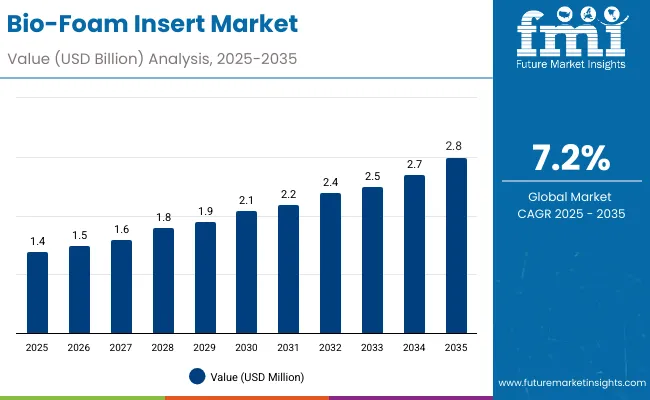
The bio-foam insert market will expand from USD 1.4 billion in 2025 to USD 2.8 billion by 2035, advancing at a CAGR of 7.2%. Growth is supported by demand for sustainable, biodegradable protective packaging across electronics, food, and healthcare sectors. Regulations restricting single-use plastics are accelerating the shift toward eco-friendly bio-foam alternatives.
| Metric | Value |
|---|---|
| Industry Size (2025E) | USD 1.4 billion |
| Industry Value (2035F) | USD 2.8 billion |
| CAGR (2025 to 2035) | 7.2% |
Between 2025 and 2030, the market will add USD 0.6 billion, largely driven by electronics and industrial goods packaging. From 2030 to 2035, another USD 0.8 billion will be added through adoption in food and pharmaceuticals. Protective packaging inserts and starch-based foams will anchor demand, with Asia-Pacific leading expansion.
From 2020 to 2024, bio-foam inserts gained traction as industries sought sustainable replacements for petroleum-based foams. Electronics and industrial packaging firms led adoption, supported by regulatory bans on plastic-based protective solutions. Starch-based and PLA foams became popular due to biodegradability and cushioning strength. Differentiation focused on lightweight design, moisture resistance, and recyclability certifications.
By 2035, the market will reach USD 2.8 billion at 7.2% CAGR. Starch-based foams will remain dominant due to cost efficiency and scalability. Protective packaging inserts will anchor product adoption, serving electronics and industrial goods. Asia-Pacific will lead growth, with Japan and South Korea accelerating sustainable packaging adoption. North America and Europe will emphasize compliance with circular economy policies.
The bio-foam insert market is expanding due to global sustainability mandates, rising demand for eco-friendly protective packaging, and consumer preference for biodegradable products. Electronics manufacturers are early adopters, using inserts to protect sensitive devices while maintaining brand sustainability commitments. Food and healthcare packaging further fuel adoption.
Cost competitiveness of starch-based and PLA foams improves market penetration. Retail and e-commerce expand adoption of protective inserts for last-mile logistics. Regulations banning EPS and PU foams accelerate the transition. With sustainability, performance, and regulatory compliance aligning, bio-foam inserts are becoming essential across multiple industries.
The bio-foam insert market is segmented by material, product type, application, end-use industry, and region. Materials include starch-based, PLA, PHA, cellulose-based, and mycelium-based foams. Product types cover protective inserts, cushioning inserts, trays and liners, and corner protectors. Applications span electronics, food, pharmaceuticals, industrial goods, and consumer packaging. End-use industries include electronics, food, healthcare, retail, and manufacturing across global regions.
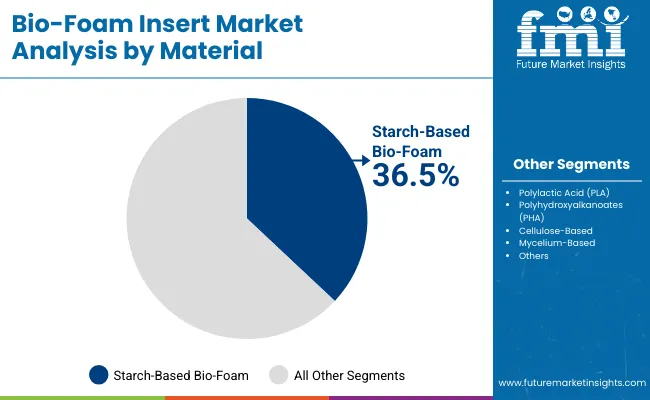
Starch-based bio-foam will hold 36.5% share in 2025, favored for affordability, scalability, and biodegradability. Electronics and industrial goods packaging widely adopt starch foams due to their cushioning performance and regulatory compliance. Their cost efficiency ensures preference in high-volume packaging.
Future adoption will benefit from improved durability and hybrid formulations. Advances in moisture resistance and recyclability will expand applications in food and healthcare. By 2035, starch-based bio-foams will remain the most widely adopted material globally.
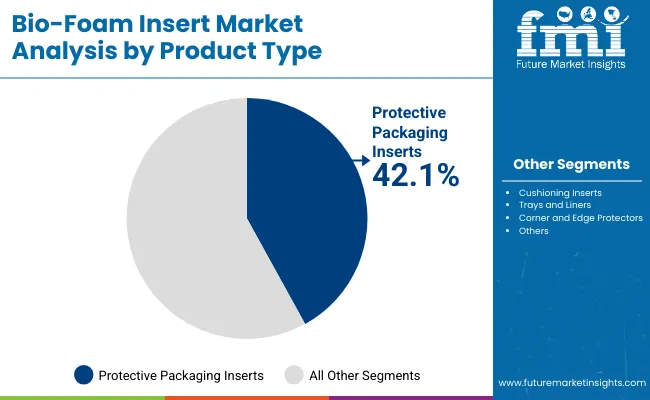
Protective packaging inserts will account for 42.1% share in 2025, reflecting their role in electronics and industrial shipments. These inserts offer durability, shock resistance, and customization for sensitive goods. Adoption is reinforced by sustainability mandates requiring EPS alternatives.
Growth will be driven by e-commerce and industrial automation. Retailers and electronics companies prioritize protective inserts to reduce damage and enhance logistics efficiency. Inserts will remain the leading product type through 2035.
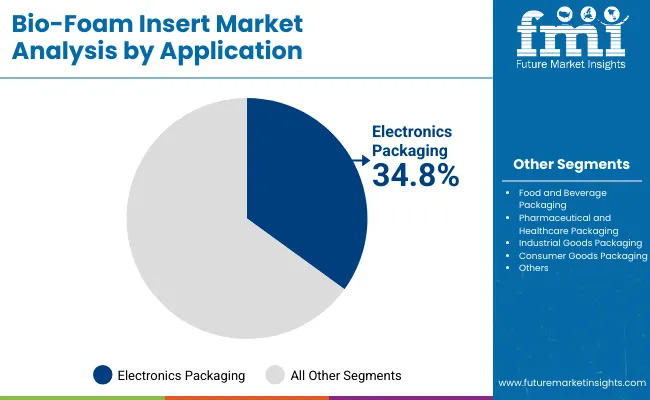
Electronics packaging will command 34.8% share in 2025, as device manufacturers prioritize sustainable yet protective materials. Inserts offer cushioning and static resistance, ensuring safe delivery of high-value products.
Future growth will be shaped by smart devices, wearables, and large-scale electronics logistics. Starch- and PLA-based foams will dominate due to affordability and regulatory alignment. Electronics will remain the largest application.
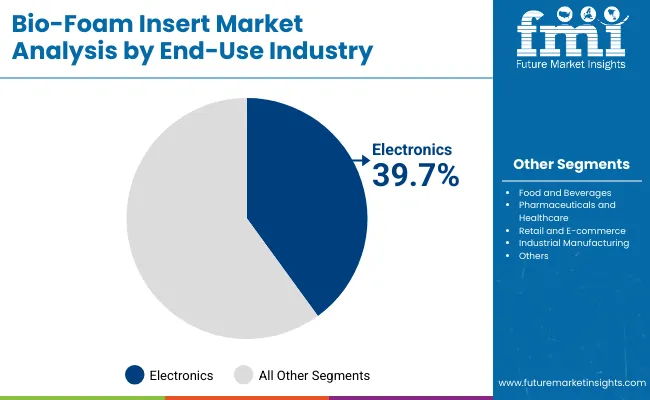
Electronics end use will represent 39.7% share in 2025, reflecting strong demand for sustainable protective inserts. Manufacturers emphasize recyclable packaging that protects sensitive devices.
By 2035, electronics will continue to dominate, supported by global consumer electronics growth. Bio-foam inserts will remain essential for balancing protection, cost, and sustainability in this sector.
The market is driven by regulatory bans on EPS and PU foams, rising electronics shipments, and global sustainability initiatives. Starch and PLA foams dominate due to biodegradability, while protective inserts ensure logistics efficiency. Consumer preference for eco-friendly products accelerates adoption.
High costs of advanced foams such as mycelium and PHA restrict adoption. Durability limitations compared to conventional foams slow penetration. Recycling infrastructure for certain bio-foams remains underdeveloped.
Significant opportunities lie in food delivery, healthcare packaging, and industrial goods. Hybrid bio-foam composites with enhanced durability will open new applications. Partnerships between electronics OEMs and foam manufacturers will reinforce growth.
Key trends include innovations in mycelium- and cellulose-based foams, digital customization of inserts, and hybrid blends with improved durability. Certifications for compostability and recyclability expand adoption. E-commerce logistics drive demand for cost-effective, sustainable inserts.
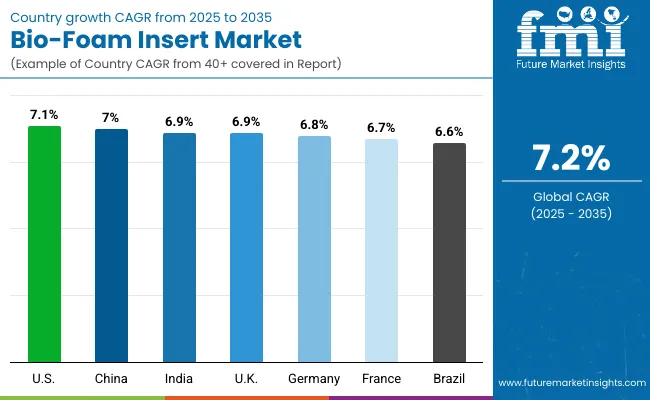
The market is expanding worldwide as sustainability mandates converge with packaging needs. Asia-Pacific leads growth with Japan and South Korea. North America emphasizes compliance and electronics adoption, while Europe focuses on recyclability. Emerging regions integrate bio-foams into food and industrial packaging.
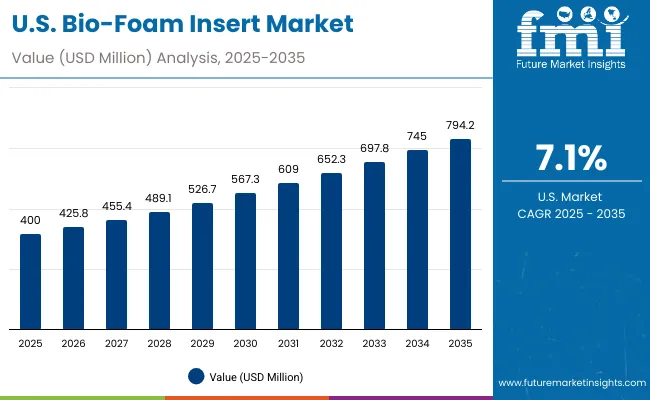
The USA will grow at 7.1% CAGR, driven by electronics and healthcare packaging. Retailers push sustainable alternatives. Regulations reinforce adoption.
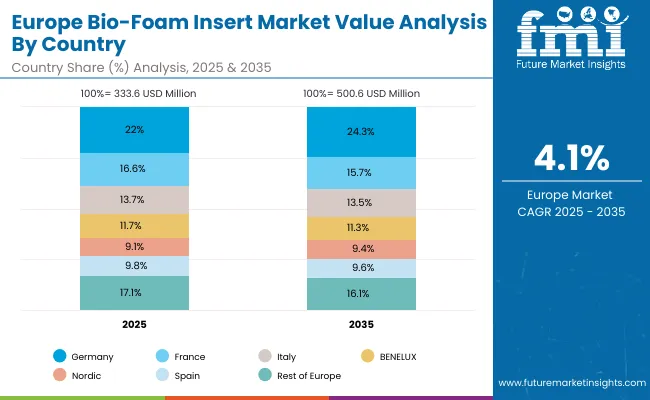
Germany will expand at 6.8% CAGR under strict EU mandates. Electronics and industrial packaging drive adoption. Starch and PLA foams lead.
The UK will grow at 6.9% CAGR with EPR schemes. Food and electronics dominate adoption. Retailers emphasize eco-friendly packaging.
China will expand at 7.0% CAGR, driven by e-commerce and electronics. Cost efficiency supports starch foams. Industrial goods packaging expands use.
India will grow at 6.9% CAGR with rising FMCG and electronics. Plastic bans fuel demand. Affordable starch foams dominate.
Japan will grow at 7.6% CAGR, driven by electronics and healthcare packaging. Premium foams dominate adoption. Regulations enforce recyclability.
South Korea will lead with 7.8% CAGR, reflecting strong e-commerce and electronics adoption. Retailers emphasize advanced foams.
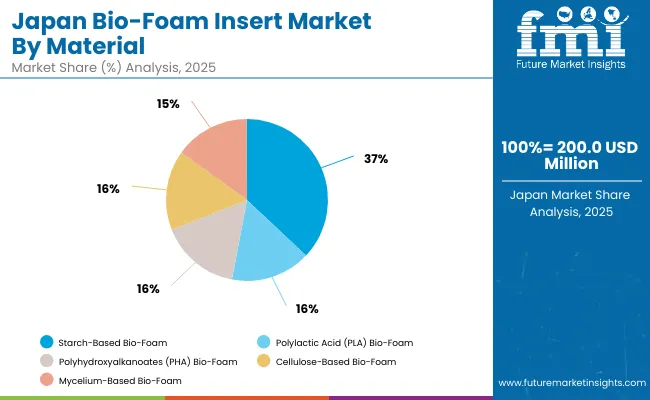
Japan’s bio-foam insert market, valued at USD 200 million in 2025, is led by starch-based bio-foam with a 36.3% share, driven by low cost and compostability. Polylactic acid (PLA) bio-foam accounts for 20.6%, supported by rising applications in electronics packaging. Polyhydroxyalkanoates (PHA) hold 17.5%, favored for high biodegradability, while cellulose-based bio-foam contributes 15.4% with strength and barrier properties. Mycelium-based bio-foam at 10.3% is emerging as a sustainable alternative with unique biodegradability advantages. Japan’s material segmentation reflects a clear transition from petroleum-based foams toward renewable, biodegradable solutions. Industry focus is shifting to balance cost, performance, and sustainability in packaging applications.
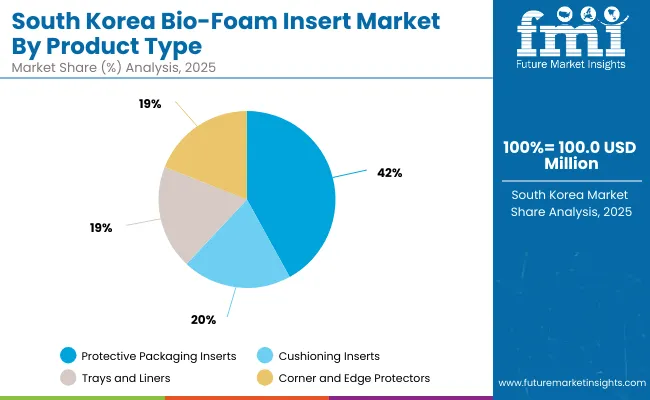
South Korea’s bio-foam insert market, worth USD 100 million in 2025, is dominated by protective packaging inserts with a 42.9% share, driven by widespread use in electronics and fragile goods shipping. Cushioning inserts account for 17.7%, providing enhanced impact resistance for retail and e-commerce supply chains. Trays and liners hold 16.4%, supporting food packaging and medical applications, while corner and edge protectors at 13.9% are used extensively in furniture and appliance transport. The product segmentation highlights South Korea’s focus on durability and product safety while meeting sustainability goals. Increasing e-commerce demand continues to accelerate adoption of bio-foam packaging alternatives.
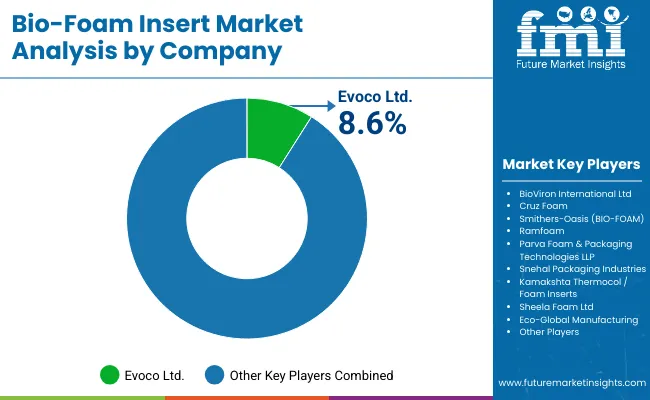
The market is moderately fragmented with leaders such as Evoco Ltd, BioViron International Ltd, Cruz Foam, Smithers-Oasis (BIO-FOAM), Ramfoam, Parva Foam & Packaging Technologies, Snehal Packaging Industries, KamakshthaThermocol / Foam, Sheela Foam Ltd, and Eco-Global Manufacturing. These firms focus on biodegradable foams, hybrid composites, and recyclable designs.
Evoco and Cruz Foam emphasize mycelium and PHA innovations, while Smithers-Oasis and Ramfoam specialize in bio-foam inserts for consumer goods. Regional players such as Snehal Packaging and Sheela Foam target cost-effective solutions. Competition centers on sustainability, affordability, and certifications, with Asia-Pacific players gaining ground through rapid electronics adoption.
Key Developments of Bio-Foam Insert Market
| Item | Value |
|---|---|
| Quantitative Units | USD 1.4 Billion |
| By Material | Starch-Based, PLA, PHA, Cellulose-Based, Mycelium-Based |
| By Product Type | Protective Inserts, Cushioning Inserts, Trays & Liners, Corner & Edge Protectors |
| By Application | Electronics, Food & Beverages, Healthcare, Industrial Goods, Consumer Packaging |
| By End-Use Industry | Electronics, Food, Pharmaceuticals, Retail, Industrial Manufacturing |
| Key Companies Profiled | Evoco Ltd, BioViron International Ltd, Cruz Foam, Smithers-Oasis (BIO-FOAM), Ramfoam, Parva Foam & Packaging Technologies, Snehal Packaging Industries, Kamakshtha Thermocol / Foam, Sheela Foam Ltd, Eco-Global Manufacturing |
| Additional Attributes | Growth driven by EPS bans, electronics demand, and bio-based material innovation. |
The market will be valued at USD 1.4 billion in 2025.
The market will reach USD 2.8 billion by 2035.
The market will grow at a CAGR of 7.2% during 2025-2035.
Starch-based bio-foam will lead with a 36.5% share in 2025.
Protective packaging inserts will dominate with a 42.1% share in 2025.


Our Research Products

The "Full Research Suite" delivers actionable market intel, deep dives on markets or technologies, so clients act faster, cut risk, and unlock growth.

The Leaderboard benchmarks and ranks top vendors, classifying them as Established Leaders, Leading Challengers, or Disruptors & Challengers.

Locates where complements amplify value and substitutes erode it, forecasting net impact by horizon

We deliver granular, decision-grade intel: market sizing, 5-year forecasts, pricing, adoption, usage, revenue, and operational KPIs—plus competitor tracking, regulation, and value chains—across 60 countries broadly.

Spot the shifts before they hit your P&L. We track inflection points, adoption curves, pricing moves, and ecosystem plays to show where demand is heading, why it is changing, and what to do next across high-growth markets and disruptive tech

Real-time reads of user behavior. We track shifting priorities, perceptions of today’s and next-gen services, and provider experience, then pace how fast tech moves from trial to adoption, blending buyer, consumer, and channel inputs with social signals (#WhySwitch, #UX).

Partner with our analyst team to build a custom report designed around your business priorities. From analysing market trends to assessing competitors or crafting bespoke datasets, we tailor insights to your needs.
Supplier Intelligence
Discovery & Profiling
Capacity & Footprint
Performance & Risk
Compliance & Governance
Commercial Readiness
Who Supplies Whom
Scorecards & Shortlists
Playbooks & Docs
Category Intelligence
Definition & Scope
Demand & Use Cases
Cost Drivers
Market Structure
Supply Chain Map
Trade & Policy
Operating Norms
Deliverables
Buyer Intelligence
Account Basics
Spend & Scope
Procurement Model
Vendor Requirements
Terms & Policies
Entry Strategy
Pain Points & Triggers
Outputs
Pricing Analysis
Benchmarks
Trends
Should-Cost
Indexation
Landed Cost
Commercial Terms
Deliverables
Brand Analysis
Positioning & Value Prop
Share & Presence
Customer Evidence
Go-to-Market
Digital & Reputation
Compliance & Trust
KPIs & Gaps
Outputs
Full Research Suite comprises of:
Market outlook & trends analysis
Interviews & case studies
Strategic recommendations
Vendor profiles & capabilities analysis
5-year forecasts
8 regions and 60+ country-level data splits
Market segment data splits
12 months of continuous data updates
DELIVERED AS:
PDF EXCEL ONLINE
Insert Trays Market
Shoe Insert Market Size and Share Forecast Outlook 2025 to 2035
Bolt Insertion Machine Market Size and Share Forecast Outlook 2025 to 2035
Custom Inserts Market
Scented Insert Applicators Market Analysis - Size and Share Forecast Outlook 2025 to 2035
Vaginal Inserts Market Size and Share Forecast Outlook 2025 to 2035
UK Shoe Insert Market Insights – Growth, Share & Industry Trends 2025-2035
Fastener Insertion Machine Market Analysis - Size, Share, and Forecast Outlook 2025 to 2035
Scarfing Inserts Market Analysis - Size, Share, and Forecast Outlook 2025 to 2035
USA Shoe Insert Market Outlook – Demand, Growth & Industry Forecast 2025-2035
GCC Shoe Insert Market Report – Size, Share & Growth 2025-2035
Packaging Inserts Market Insights - Growth & Forecast 2025 to 2035
Partition inserter machines Market
Valve Seat Inserts Market Size and Share Forecast Outlook 2025 to 2035
Japan Shoe Insert Market Trends – Size, Demand & Forecast 2025-2035
Peripherally Inserted Central Catheter Analysis by Product Type by Indication and by End User through 2035
Germany Shoe Insert Market Analysis – Growth, Size & Industry Trends 2025-2035
Run Flat Tire Inserts Market Growth - Trends & Forecast 2025 to 2035
Foam Packaging Inserts Market Analysis, Size, Share & Forecast 2025 to 2035
Plastic Molded Insert Market Trends & Growth Forecast 2024-2034

Thank you!
You will receive an email from our Business Development Manager. Please be sure to check your SPAM/JUNK folder too.
Chat With
MaRIA