
- Market Size (2026)
- USD 584.3 Mn
- Forecast (2036)
- USD 1238.3 Mn
- CAGR (2026 to 2036)
- 7.8%
How big is Biotainer Market in 2026?
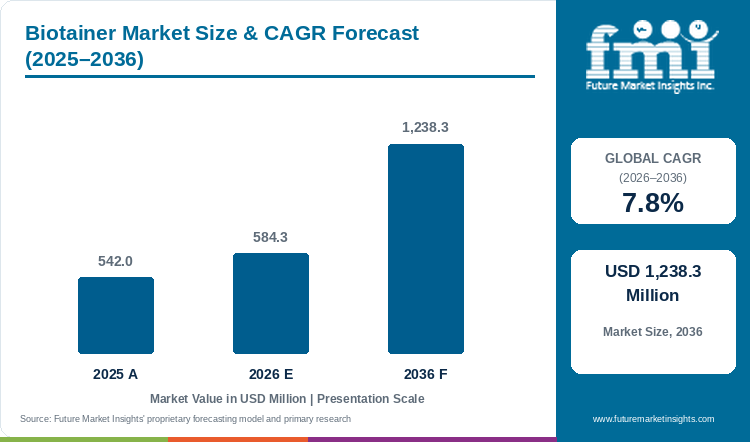
Assessed at USD 542.0 million in 2025 and progressing to USD 584.3 million in 2026, the biotainer market valuation is on course to reach USD 1,238.3 million by 2036, supported by a forecast-period CAGR of 7.8%.
Cleanroom batch-turnaround economics govern commercial adoption in the global biotainer market, which reached a market value of USD 542.0 million in 2025 and an estimated USD 584.3 million in 2026. Industry valuation is projected by FMI to reach USD 1,238.3 million by 2036, expanding at a CAGR of 7.8% from 2026 to 2036. Gamma-Sterilized Virgin PETG Bottles and Carboys hold 56.4% of 2026 polymer resin demand because optical clarity and low extractables satisfy USP Class VI bulk drug substance freezing standards. In May 2026, pre-use post-sterilization integrity testing data in Applied Microbiology and Biotechnology confirmed that single-use rigid container kits must sustain pressure-hold stability above 4 bar and helium leak tightness down to 2 micrometers across 50 mL to 200 L volumes. Rigid self-supporting square geometry separates this category from the cell culture media bags market at 3.8% CAGR, since rigid bottles stack directly inside upright blast freezers without stainless outer totes. Suppliers are expanding cleanroom conversion capacity to capture recurring biologic buffer and harvest orders. Sartorius grew Bioprocess Solutions consumables revenue by 8.1% to EUR 735 million in Q1 2026, while Avantor generated USD 2,153 million across its Bioscience Production segment during 2025 on rising pre-sterilized bottle and manifold shipments. Biopharma procurement teams renew multi-year supply agreements only when converters guarantee leak-free cap seals and dual-site gamma sterilization backups through 2036.
Key Market Trends & Insights
- By polymer resin: Gamma-Sterilized Virgin PETG Bottles and Carboys hold an estimated 56.4% share in 2026 because amorphous copolyester maintains 53 MPa yield strength after gamma sterilization.
- By volume capacity: 1 Liter to 5 Liter Media and Buffer Bottles represent 44.8% in 2026 as benchtop bioreactor feed lines standardize on graduated square carboys.
- By closure assembly: Pre-Assembled Aseptic Tubing and Dip-Tube Caps account for 53.2% in 2026 because overmolded thermoplastic elastomer caps prevent cleanroom contamination during peristaltic pumping.
- By end user: Biopharmaceutical Monoclonal Antibody and Vaccine Plants secure 51.8% in 2026 owing to high-titer perfusion harvests that require sterile intermediate storage.
- By procurement model: Direct Multi-Year Converter Supply Contracts command 59.1% in 2026 through quality-agreement audits and locked USP <665> extractables dossiers.
Regional Highlights
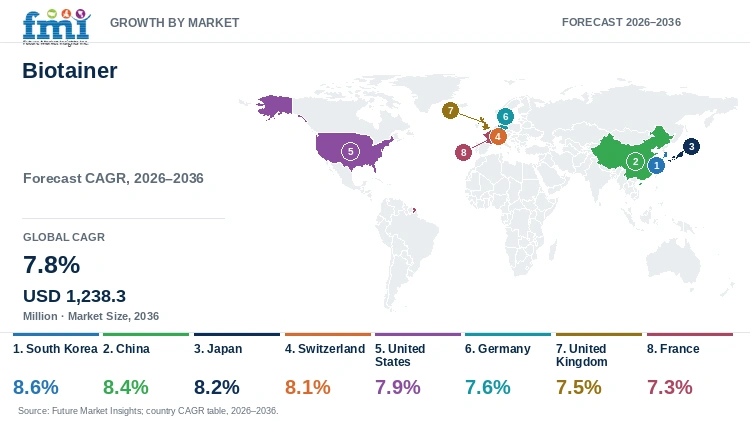
- Top national expansion: South Korea leads national growth projections at an 8.6% CAGR through 2036 under rapid Songdo monoclonal antibody capacity expansion.
- Broader country progression: China tracks at an 8.4% CAGR ahead of Japan at 8.2% and Switzerland at 8.1%, while the United States advances at 7.9%.
Market Size & Forecast
Table 1: Market Size and Forecast for the Biotainer Market (USD million and CAGR percentage), 2025 to 2036
| Metric | Value |
|---|---|
| 2025 Market Size | USD 542.0 million |
| Estimated Market Size in 2026 | USD 584.3 million |
| Projected Market Size by 2036 | USD 1,238.3 million |
| CAGR, 2026 to 2036 | 7.8% |
| Added Value, 2026 to 2036 | USD 654.0 million |
Biopharmaceutical quality directors are tightening extractables and leachables controls across downstream buffer storage and chromatography elution collection. When buffer solutions sit in polymer vessels prior to tangential flow filtration, process equipment-related leachables can migrate into the drug stream and complicate regulatory filings. A May 2026 mechanistic study in the Journal of Pharmaceutical Sciences demonstrated that dynamic dilution during ultrafiltration and diafiltration clears single-use leachables whereas stagnant storage above 40 degrees Celsius for several weeks drives leachable accumulation toward equilibrium limits. Plant engineers therefore pair lot-validated virgin PETG biotainers with bioprocess containers and fluid transfer assemblies to move buffers rapidly through closed cleanroom lines.
Sterile Buffer and Bulk Drug Substance Vessel Sizing
Table 2: Sterile Fluid Volume and Rigid Vessel Sizing for the Biotainer Market (USD million and operational ranges), 2025 to 2036
| Metric | 2025 | 2026 | 2036 |
|---|---|---|---|
| Market size (USD million) | 542.0 | 584.3 | 1,238.3 |
| Sterile bioprocess fluid stored in rigid biotainers (million liters) | 118.0 to 132.0 | 127.5 to 142.8 | 268.0 to 302.0 |
| Gamma-sterilized rigid bottle & carboy units (million units) | 38.5 to 43.2 | 41.4 to 46.5 | 86.0 to 96.8 |
| Average unit realization per pre-sterilized biotainer assembly (USD) | 12.5 to 14.1 | 12.6 to 14.2 | 12.8 to 14.4 |
Operational note on vessel sizing applies standard 1 L to 50 L single-use rigid bottle consumption across clinical and commercial monoclonal antibody batches.
Higher monoclonal antibody fermentation titers are forcing downstream purification suites to handle far larger volumes of sterile equilibration and wash buffers per batch. Because buffer preparation and tank cleaning consume cleanroom floor space and water-for-injection utilities, biologics plants are replacing fixed steel buffer tanks with pre-sterilized rigid carboys. An August 2026 process economics analysis in Biotechnology Letters confirmed that single-use filtration and rigid buffer vessels reduce monoclonal antibody recovery cost of goods by 10% at 50 kg annual output where water accounts for 95% of downstream fluid inputs. Upstream seed suites connect these graduated PETG carboys directly to single-use bioreactors through sterile weldable silicone tubing to speed up campaign turnarounds.
Per Capita & Bioprocess Suite Allocation Sizing
Table 3: Per Capita and Bioprocess Suite Allocation Indicators for the Biotainer Market (USD), 2025 to 2036
| Metric | 2025 | 2026 | 2036 |
|---|---|---|---|
| World population (billion) | 8.2 | 8.3 | 9.0 |
| Valuation per 1,000 people (USD) | 66.1 | 70.4 | 137.6 |
| Annual biotainer allocation per GMP biologics suite (USD thousand) | 124.0 to 142.0 | 132.8 to 152.0 | 258.0 to 295.0 |
| Pre-assembled aseptic closure penetration (%) | 51.5% to 52.8% | 53.2% | 64.5% to 68.0% |
Table 4: Biopharmaceutical Facility & Channel Allocation Indicators for the Biotainer Market (USD and percentages), 2026
| Metric | Value | Institutional Reference Basis |
|---|---|---|
| Market size, 2026 | USD 584.3 million | 2026 global market value baseline |
| Active GMP commercial & clinical biologics suites | 4,400 suites | Global mAb, vaccine, viral vector & CDMO suites |
| Market allocation per GMP biologics suite | USD 132,795.5 | Annualized rigid biotainer & cap assembly allocation |
| Direct Multi-Year Converter Supply Contracts value, 2026 | USD 345.3 million | 59.1% procurement model allocation |
Bulk drug substance shipping between contract drug-substance plants and sterile fill-finish sites depends on container survival during minus 80 degrees Celsius blast freezing. Conventional radial freezing traps liquid core expansion inside rigid bottles and creates internal pressure spikes that can crack container walls during cold-chain transit. In November 2025, cryopreservation experiments in Biotechnology and Bioengineering showed that radial ice growth inside 2 L and 5 L rigid bottles generates 10 bar internal pressure whereas directional bottom-up freezing keeps solute cryoconcentration variance below 10%. Cell therapy and viral vector facilities integrate square-footprint PETG bottles with automated cell culture systems to protect shear-sensitive payloads from harvest through frozen storage.
Analyst Perspective
"Biopharmaceutical plant directors do not purchase biotainers as commodity laboratory bottles. They buy pre-validated USP <665> extractables dossiers and zero-leak overmolded dip-tube closures with guaranteed minus 80 degrees Celsius freeze-thaw survival for bulk drug payloads worth millions of dollars per batch."
- Nandini Roy Choudhury, Associate Vice President, Future Market Insights.
How is the biotainer market segmented?
The biotainer market is segmented by polymer resin, volume capacity, closure assembly, end user, and procurement model. In 2026, Gamma-Sterilized Virgin PETG Bottles and Carboys are projected at 56.4%, 1 Liter to 5 Liter Media and Buffer Bottles at 44.8%, Pre-Assembled Aseptic Tubing and Dip-Tube Caps at 53.2%, Biopharmaceutical Monoclonal Antibody and Vaccine Plants at 51.8%, and Direct Multi-Year Converter Supply Contracts at 59.1%.
By polymer resin: Gamma-Sterilized Virgin PETG Bottles and Carboys, Autoclavable Polycarbonate PC and Polypropylene Vessels, and High-Density Polyethylene HDPE Biohazard Containers.
By volume capacity: 1 Liter to 5 Liter Media and Buffer Bottles, 10 Liter to 50 Liter Bulk Bioprocess Carboys, and 5 mL to 500 mL Sampling and Freeze-Thaw Bottles.
By closure assembly: Pre-Assembled Aseptic Tubing and Dip-Tube Caps and Tamper-Evident Standard Screw Closures.
By end user: Biopharmaceutical Monoclonal Antibody and Vaccine Plants, Contract Development and Manufacturing Organizations CDMOs, and Cell and Gene Therapy Labs and Clinical Biobanks.
By procurement model: Direct Multi-Year Converter Supply Contracts and Industrial Packaging Distributors and Merchant Wholesalers.
Why do Gamma-Sterilized Virgin PETG Bottles and Carboys lead the polymer resin category?
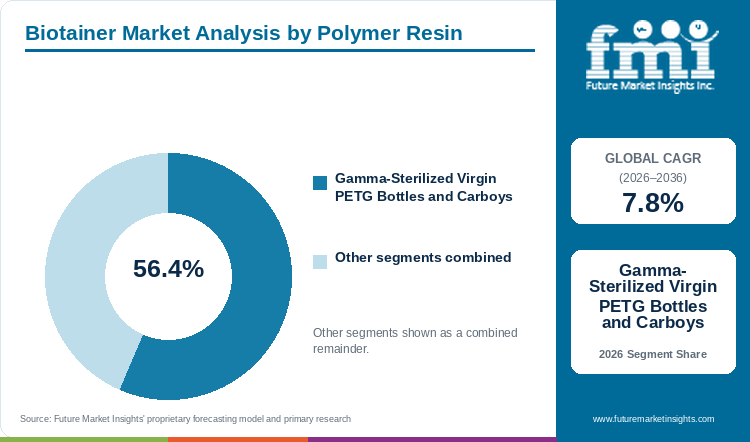
Gamma-Sterilized Virgin PETG Bottles and Carboys hold an estimated 56.4% of polymer resin demand in 2026, anchored by 25 kGy to 50 kGy radiation stability and optical clarity.
Table 5: Polymer Resin Share for the Biotainer Market (percentage share), 2026
| Polymer Resin | Share (2026) |
|---|---|
| Gamma-Sterilized Virgin PETG Bottles and Carboys | 56.4% |
| Other Segments Combined | 43.6%* |
| Total | 100.0% |
*Note that remaining polymer resin categories account for the balance of 2026 global biotainer demand.
Table 6: Polymer Resin Leadership and Market Growth for the Biotainer Market (segment and CAGR percentage), 2026 to 2036
| Metric | Value |
|---|---|
| Global CAGR (2026 to 2036) | 7.8% |
| Leading Segment | Gamma-Sterilized Virgin PETG Bottles and Carboys |
Resin selection in commercial bioprocessing hinges on whether a container can survive terminal sterilization without losing impact strength or leaching oligomers into pH-sensitive media. Polyethylene terephthalate glycol dominates rigid cleanroom container specifications because its amorphous polymer matrix resists radiation hazing and cold-cracking at minus 80 degrees Celsius. An October 2025 sterilization study in Polymers verified that commercial PETG maintains 52 MPa tensile strength and 135 MPa elastic modulus after low-temperature sterilization with glass transition stability shifting from 73.6 degrees Celsius to 75.4 degrees Celsius. Proven radiation and thermal stability separates cleanroom-grade PETG biotainers from standard pharmaceutical plastic bottles used in oral solid packaging.
- Gamma-Sterilized Virgin PETG Bottles and Carboys hold 56.4% of polymer resin market value in 2026 because low carbon-dioxide and oxygen permeability protects pH-sensitive cell culture media during six-month cold storage.
- A March 2026 toxicology study in International Journal of Pharmaceutics X documented that autoclaving polycarbonate vessels at 121 degrees Celsius for 30 minutes and applying 25 kGy irradiation elevated bisphenol A extractables to 0.041 micrograms per square centimeter, reinforcing buyer preference for BPA-free virgin PETG.
What sustains 1 Liter to 5 Liter Media and Buffer Bottles leadership in volume capacity?
1 Liter to 5 Liter Media and Buffer Bottles represent 44.8% of the volume capacity category in 2026, supported by benchtop bioreactor feed ergonomics and upright freezer shelf density.
Cleanroom ergonomics and upright freezer shelf geometry dictate which container sizes capture the highest unit volume across biologics plants. Mid-scale 1 L and 2 L through 5 L square biotainers allow a single operator inside a biosafety cabinet to handle media additions and chromatography fractions without overhead hoists. Square side walls also eliminate wasted circular dead space inside minus 80 degrees Celsius freezers and allow plants to store 25% more bulk drug substance per cabinet. Procurement teams bundle these mid-scale vessels with bioprocessing supplies to standardize stocking across clinical and commercial suites.
- 1 Liter to 5 Liter Media and Buffer Bottles represent 44.8% of the volume capacity segment in 2026 as 2 L square PETG footprints maximize upright freezer shelf density while preventing radial ice-expansion cracking.
- A July 2026 monoclonal antibody development study in Vaccines ran 200 L single-use bioreactors at 95 kg working volume supported by 1 L to 5 L sterile feed bottles for precision ExpiCHO nutrient additions.
How do Pre-Assembled Aseptic Tubing and Dip-Tube Caps lead the closure assembly category?
Pre-Assembled Aseptic Tubing and Dip-Tube Caps account for 53.2% of closure assembly demand in 2026, driven by closed-system peristaltic fluid transfer and zero cleanroom decanting.
Manual cap removal to pour media or harvest fluids inside cleanrooms introduces airborne contamination risks and batch-failure liabilities. Pre-assembled closure systems solve this bottleneck by molding rigid dip tubes and hydrophobic vent filters directly into tamper-evident caps connected to weldable transfer tubing. Because converter cleanrooms pressure-test the entire cap-and-bottle assembly before gamma irradiation, biopharma buyers pay a 3x to 5x unit premium over unmated pharmaceutical caps and closures.
- Pre-Assembled Aseptic Tubing and Dip-Tube Caps account for 53.2% of closure assembly demand in 2026 because closed peristaltic pumping eliminates laminar-flow hood decanting steps.
- Foxx Life Sciences expanded its EZBio rigid reservoir single-use assemblies in January 2026 with overmolded VersaCap adapters and bottom-drain dip tubes that hold residual liquid dead-volume holdup below 1.5%.
Why do Biopharmaceutical Monoclonal Antibody and Vaccine Plants lead the end user category?
Biopharmaceutical Monoclonal Antibody and Vaccine Plants secure 51.8% of end user value in 2026, supported by high-titer harvest storage and commercial buffer preparation.
Commercial monoclonal antibody and recombinant vaccine plants represent the core revenue engine for biotainer converters because commercial fermentation runs on fixed multi-ton annual schedules. Whereas academic laboratories wash and autoclave glass carboys to save consumable budget, commercial GMP plants mandate pre-sterilized single-use polymer containers to eliminate cleaning validation and cross-batch carryover.
- Biopharmaceutical Monoclonal Antibody and Vaccine Plants secure 51.8% of end user demand in 2026 as high-titer antibody harvests require partitioned 2 L to 20 L freeze-thaw storage prior to fill-finish.
- Thermo Fisher Scientific reported in April 2026 that first-quarter revenue rose 6% to USD 11.01 billion, supported by USD 2,636 million in Life Sciences Solutions bioprocess consumables demand from commercial biologics plants.
What gives Direct Multi-Year Converter Supply Contracts the leading position in procurement model?
Direct Multi-Year Converter Supply Contracts command 59.1% of procurement model share in 2026, anchored by locked USP <665> extractables dossiers and reserved gamma sterilization capacity.
Container replacement for a primary bulk drug substance bottle after Phase III clinical trials requires regulatory comparability filings and 12-month real-time freeze-thaw stability testing. Biopharmaceutical manufacturers therefore bypass spot-market brokers and sign multi-year direct supply agreements with primary cleanroom converters that lock in virgin resin lot numbers and gamma sterilization slots.
- Direct Multi-Year Converter Supply Contracts command 59.1% of procurement model share in 2026 because custom tubing manifold drawings and USP <665> extractables packages require direct converter engineering sign-off.
- Corning reported in January 2026 that fourth-quarter 2025 core sales increased 14% to USD 4.41 billion while upgrading its multi-year Springboard enterprise supply framework across life sciences and specialty materials.
What are the drivers, restraints, and opportunities in the biotainer market?
In the biotainer market, commercial monoclonal antibody harvest volumes and closed-system GMP Annex 1 fluid transfer rules are projected to drive adoption whereas cryogenic radial ice-expansion stress restrains unvalidated bottle freezing and X-ray sterilization qualification unlocks multi-site supply resilience.
- Driver: Higher monoclonal antibody titers and viral vector batch counts compel biopharma plants to adopt pre-sterilized rigid PETG bottles with closed dip-tube transfer caps.
- Restraint: Cryogenic radial ice-expansion stress and Cobalt-60 gamma irradiation capacity bottlenecks restrict unvalidated container substitution and extend custom assembly lead times.
- Opportunity: Qualification of X-ray sterilization protocols and fluoropolymer-lined or mechanically recyclable secondary bioprocess vessels unlocks sustainable high-purity adoption.
Growth Analysis and Future Potential: Qualitative Demand Catalysts
Outsourced biologics production is accelerating rigid container consumption because multi-product contract facilities cannot afford three-day clean-in-place turnarounds between client campaigns. Expansion of biopharmaceutical contract manufacturing pipelines drives recurring orders for pre-sterilized 1 L to 20 L PETG and polycarbonate biotainers that arrive ready for immediate isolator loading. According to U.S. Food and Drug Administration Center for Biologics Evaluation and Research approvals published in December 2025, new biological device and manufacturing clearances require validated closed-container integrity across all sterile fluid contact stages.
Risk Assessment of the Biotainer Market: Operational and Formulation Friction
Antioxidant degradation during gamma irradiation represents a critical formulation friction point that can delay container qualification in high-purity biologics suites. A November 2025 toxicological risk assessment in Pharmaceutical Research revealed that ionizing gamma radiation oxidizes Irgafos 168 stabilizers in polyolefin walls into cytotoxic leachables that reduce cell mitochondrial membrane potential. Pharmaceutical quality teams therefore favor stabilizer-free virgin PETG vessels integrated with single-use bioprocess sensor calibration systems to verify pre-use integrity without risking cell toxicity.
Commercial Opportunity Analysis: Formulation Differentiation and Value-Add Formats
Cleanroom converters capture premium margins by engineering high-modulus copolyester containers that withstand repeated radiation doses and cryogenic handling without wall embrittlement. A March 2026 prospective clinical engineering study in BMC Neurology confirmed that medical-grade PETG preserves a 53 MPa yield strength and 2.1 GPa Young modulus with only 3.8% gamma radiation attenuation. Suppliers cross-sell these radiation-stable carboys with small-volume cryogenic polymer vials so biopharma buyers can source both bulk harvest vessels and quality-control retention containers under one extractables dossier.
Biotainer Market by Country (2026 to 2036)
FMI country modeling indicates that South Korea leads biotainer expansion at an 8.6% CAGR through 2036, while the United Kingdom advances at 7.5% across established biologics clusters.
Table 7: Country CAGR and Primary Growth Levers for the Biotainer Market (CAGR percentage and operational drivers), 2026 to 2036
| Country | CAGR (2026 to 2036) | Primary Growth Lever |
|---|---|---|
| South Korea | 8.6% | Songdo mega-scale CDMO antibody campuses and KDCA 100-day vaccine readiness drills |
| China | 8.4% | Zhangjiang and Suzhou commercial biologics parks and domestic Class 7 PETG blow molding |
| Japan | 8.2% | iPSC regenerative medicine suites and low-shear closed freeze-thaw bottle protocols |
| Switzerland | 8.1% | Basel and Visp high-potency biologics corridors and mandatory Swissmedic SEND dossiers |
| United States | 7.9% | Commercial mAb and viral vector manufacturing across FDA-inspected bioprocess hubs |
| Germany | 7.6% | Automated perfusion biomanufacturing and recurring single-use consumables integration |
| United Kingdom | 7.5% | Golden Triangle viral-vector clinical suites under reformed MHRA trial regulations |
| France | 7.3% | Commercial vaccine and plasma fractionation suites adopting EU GMP Annex 1 closed caps |
Source: Future Market Insights analysis
South Korea Biotainer Market Outlook (2026 to 2036)
South Korea is scaling biotainer demand faster than any other national market at an 8.6% CAGR through 2036 because its biologics sector was built around mega-scale export contract manufacturing rather than small domestic clinical labs. High-capacity antibody and vaccine campuses in Songdo and Osong run continuous 10,000 L to 15,000 L bioreactor trains that consume tens of thousands of pre-sterilized 2 L to 20 L PETG buffer and harvest bottles each quarter. On 5 February 2026, the Korea Disease Control and Prevention Agency and the Ministry of Food and Drug Safety conducted a joint rapid vaccine drill targeting 100-day pathogen-to-dose manufacturing readiness. That national preparedness mandate compels domestic biopharma plants to hold multi-month safety stocks of gamma-irradiated dip-tube bottle assemblies.
Key takeaway: In South Korea, mega-scale Songdo contract biomanufacturing campuses and national 100-day vaccine readiness drills are projected to drive 8.6% CAGR demand for pre-sterilized PETG biotainers.
China Biotainer Market Outlook (2026 to 2036)
Domestic cleanroom localization shapes the biotainer outlook in China, where market value is forecast to advance at an 8.4% CAGR between 2026 and 2036 across Shanghai Zhangjiang and Suzhou BioBAY. For years, domestic monoclonal antibody and cell-therapy producers imported pre-sterilized PETG and polycarbonate carboys from Western converters at high freight and tariff markups. Local resin processors are now qualifying domestic Class 7 cleanroom injection-stretch blow molding lines to win commercial supply contracts from indigenous bispecific antibody plants. An April 2025 radiation materials study in Polymers showed that unstabilized polypropylene loses 40% of its mechanical strength above 40 kGy whereas radiation-stable polymers preserve structural integrity. Domestic converters therefore focus cap-and-bottle validation on gamma-tolerant virgin PETG resins.
Key takeaway: In China, Zhangjiang and Suzhou biologics park expansion and domestic Class 7 cleanroom blow-molding capacity are expected to sustain an 8.4% CAGR through 2036.
Japan Biotainer Market Outlook (2026 to 2036)
Regenerative medicine and antibody-drug conjugate manufacturing define the commercial lens in Japan, propelling national biotainer valuation at an 8.2% CAGR through 2036. Unlike bulk biosimilar plants that purchase 50 L carboys, cell-therapy and conjugate suites in Kobe and Kawasaki prioritize small-volume 125 mL to 5 L vessels engineered for zero-particulate fluid transfer. Sartorius expanded its commercial-scale Celsius FFT frozen storage and shipping container platform in October 2025 to protect high-value biologics during sub-zero inter-plant transport. Pharmaceutical quality directors in Japan enforce strict visual inspection and sub-visible particle limits on every lot, which favors optically clear virgin PETG bottles fitted with pre-welded platinum-cured silicone dip tubes over opaque polyolefin containers.
Key takeaway: In Japan, regenerative stem-cell manufacturing and antibody-drug conjugate suites requiring low-shear closed freeze-thaw bottles are forecast to drive an 8.2% CAGR through 2036.
Switzerland Biotainer Market Outlook (2026 to 2036)
Regulatory dossier rigor governs procurement in Switzerland, where the biotainer market is projected to progress at an 8.1% CAGR from 2026 to 2036 across Basel and Visp. Originator and contract biomanufacturing sites in Switzerland specialize in high-potency commercial biologics and viral vectors where a single fractured 10 L carboy can represent millions of francs in lost drug substance. Swissmedic announced that mandatory electronic Standard for Exchange of Nonclinical Data submissions take effect on 15 June 2026 for all new active substance authorization dossiers. Because container extractables and toxicology datasets feed directly into regulatory authorization filings, biopharma buyers in Basel and Visp lock in sole-source converter agreements that bundle virgin PETG bottles with pre-validated USP <665> chemical profiles.
Key takeaway: In Switzerland, high-potency biologics production in Basel and Visp with strict Swissmedic authorization dossier mandates are anticipated to support an 8.1% CAGR.
United States Biotainer Market Outlook (2026 to 2036)
Commercial scale and dual-site sterilization redundancy drive the United States biotainer market, which is forecast to expand at a 7.9% CAGR through 2036 across Massachusetts and North Carolina. United States monoclonal antibody and gene therapy operators with clinical biobanks represent the largest single-country buyer pool for pre-assembled Nalgene and EZBio rigid carboy manifolds. Thermo Fisher Scientific updated its Nalgene bioprocess bottle and carboy assembly specifications in November 2025 to support closed peristaltic fluid transfer from 60 mL sampling bottles up to 50 L carboys. Following recent Cobalt-60 gamma capacity tightness, United States biopharma procurement directors require converters to validate both gamma and X-ray irradiation protocols on every contracted bottle SKU.
Key takeaway: In the United States, commercial monoclonal antibody and gene therapy manufacturing with domestic converter cleanroom expansions are estimated to drive a 7.9% CAGR.
Germany Biotainer Market Outlook (2026 to 2036)
Cleanroom process standardization and steam-to-single-use conversion anchor demand in Germany, where the market is slated to grow at a 7.6% CAGR between 2026 and 2036. Biologics production sites in Lower Saxony and Hesse are retiring legacy autoclavable glass and polycarbonate vessels after internal audits showed high autoclave cracking rates and seal degradation. A July 2026 bioprocess material selection study in Biotechnology Journal demonstrated that steam autoclaving at 121 degrees Celsius for 20 minutes under ISO 10993-12 eliminated half of tested polymer formulations due to thermal cracking. Biopharma engineering teams across Germany therefore specify pre-sterilized gamma and X-ray irradiated PETG media bottles that integrate directly onto automated perfusion and chromatography skids.
Key takeaway: In Germany, automated perfusion biomanufacturing and recurring single-use consumables expansion led by domestic bioprocess suppliers are projected to sustain a 7.6% CAGR.
United Kingdom Biotainer Market Outlook (2026 to 2036)
Rapid clinical trial starts in cell and gene therapy shape purchasing in the United Kingdom, driving biotainer valuation at a 7.5% CAGR through 2036 across Oxford and Cambridge. Early-phase viral vector and autologous cell-therapy sponsors operate compact cleanroom modules where setup speed determines how many clinical batches a facility can release each year. On 28 October 2025, the Medicines and Healthcare products Regulatory Agency initiated its six-month countdown for the reformed UK Clinical Trials Regulations taking effect in April 2026 to streamline trial approvals. Faster clinical trial clearances boost demand for small-lot, pre-assembled 50 mL to 2 L sterile sampling and freeze-thaw bottle kits delivered with turn-key sterility certificates.
Key takeaway: In the United Kingdom, Golden Triangle cell and gene therapy clinical suites and reformed MHRA clinical trial regulations are forecast to support a 7.5% CAGR.
France Biotainer Market Outlook (2026 to 2036)
EU GMP Annex 1 contamination-control enforcement is reshaping container selection across France, supporting a 7.3% CAGR from 2026 to 2036 in Lyon and Alsace. Commercial vaccine and plasma fractionation plants with monoclonal antibody suites in France are eliminating open screw-cap decanting inside cleanrooms to satisfy strict aseptic transfer inspections. Meissner Filtration Products expanded its single-use biocontainer and rigid bottle fluid transfer assemblies in October 2025 to provide pre-integrated aseptic tubing manifolds for GMP fill-finish suites. Pharmaceutical plant managers across France pair these closed elastomer cap assemblies with graduated virgin PETG and HDPE carboys so operators can weld sterile fluid lines directly to downstream filtration skids.
Key takeaway: In France, commercial vaccine and plasma fractionation plants complying with EU GMP Annex 1 closed-transfer rules are predicted to sustain a 7.3% CAGR.
Full report country CAGRs cover North America, Latin America, Western Europe, Eastern Europe, East Asia, South Asia and Pacific, and Middle East and Africa.
Who are the notable companies in the biotainer market?
Thermo Fisher Scientific Inc. Nalgene, Saint-Gobain Performance Plastics Sani-Tech, Corning Incorporated, Sartorius AG, Avantor, Inc., Foxx Life Sciences, DWK Life Sciences GmbH, Entegris, Inc., Meissner Filtration Products, Inc., and Savillex Corporation are the notable companies in the biotainer market.
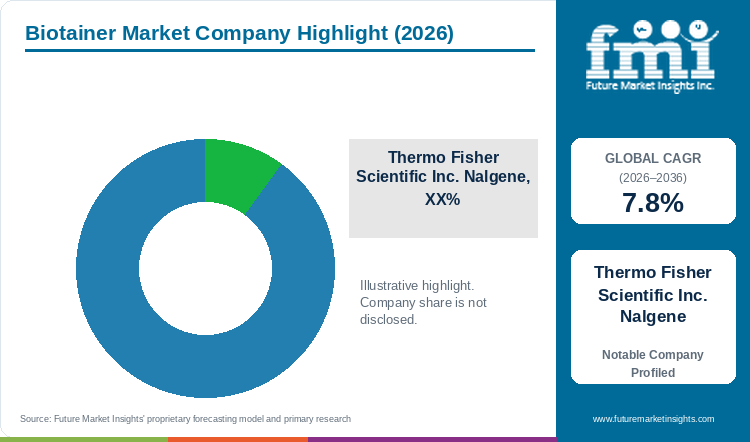
Competitive positioning in the biotainer industry separates integrated cleanroom bottle and bioprocess consumables leaders from specialized single-use fluid transfer converters and high-purity fluoropolymer container specialists.
- Integrated Bioprocess Bottle and Consumables Leaders: Thermo Fisher Scientific Inc. Nalgene, Corning Incorporated, Sartorius AG, and Avantor, Inc. operate global ISO Class 7 molding plants with captive gamma and X-ray sterilization networks.
- Specialized Single-Use Closure and Reservoir Converters: Saint-Gobain Performance Plastics Sani-Tech, Foxx Life Sciences, DWK Life Sciences GmbH, and Meissner Filtration Products, Inc. engineer custom overmolded dip-tube caps and rigid reservoir assemblies.
- High-Purity Cryogenic and Fluoropolymer Container Specialists: Entegris, Inc. and Savillex Corporation manufacture ultra-low-extractables PFA and virgin PETG bulk drug substance freeze-thaw vessels for cell and gene therapies.
Competitive Benchmarking: Biotainer Market
Table 8: Competitive Benchmarking for the Biotainer Market (qualitative capability ratings), 2026
| Company | Cleanroom Resin & Molding Depth | Closed-System Cap Integration | Extractables & Sterility Validation | Global Biopharma Reach |
|---|---|---|---|---|
| Thermo Fisher Scientific Inc. Nalgene | High | High | High | Global Nalgene ISO Class 7 molding network; USD 11.01B Q1 2026 enterprise scale |
| Saint-Gobain Performance Plastics Sani-Tech | Medium | High | High | Global Critical Process Solutions network; Sani-Tech and C-Flex overmolded assemblies |
| Corning Incorporated | High | Medium | High | Global Life Sciences PETG and PC vessel portfolio; upgraded Springboard growth plan |
| Sartorius AG | High | High | High | Global Bioprocess Solutions network; EUR 735M Q1 2026 division consumables reach |
| Avantor, Inc. | High | High | High | Global Bioscience Production footprint (USD 2,153M FY25); single-use manifold centers |
| Foxx Life Sciences | High | High | High | North America and India ISO Class 7 cleanrooms; EZBio rigid reservoir and VersaCap lines |
| DWK Life Sciences GmbH | High | Medium | High | Europe and North America primary packaging plants; DURAN and WHEATON closure systems |
| Entegris, Inc. | Medium | High | High | Global cleanroom fluid handling network; high-purity freeze-thaw bulk drug containers |
| Meissner Filtration Products, Inc. | Medium | High | High | US and Europe single-use biocontainer and rigid bottle fluid transfer integration |
| Savillex Corporation | High | Medium | High | North America fluoropolymer and PETG Purillex bulk drug freeze-thaw bottle manufacturing |
Scoring basis: Cleanroom Resin & Molding Depth evaluates captive ISO Class 7 blow-molding of USP Class VI PETG, PC, and HDPE vessels, Closed-System Cap Integration assesses pre-assembled dip-tube and aseptic connector capabilities, Extractables & Sterility Validation measures published USP <665> and ISO 11137 dossiers, and Global Biopharma Reach reflects multi-continent cleanroom redundancy.
Key Developments in the Biotainer Market
- Saint-Gobain formally rebranded its Life Sciences division as Saint-Gobain Critical Process Solutions on 1 July 2026 to unify its Sani-Tech and C-Flex single-use bioprocess fluid transfer portfolio.
- Avantor presented scalable single-use rigid bottle and aseptic fluid-handling manifold innovations at INTERPHEX in April 2025 to streamline closed cleanroom buffer transfer.
- DWK Life Sciences expanded its cleanroom-processed DURAN and WHEATON primary bioprocess containers and leak-resistant closure systems in September 2025 for sterile biologics storage.
Key Players in the Biotainer Market
Integrated Bioprocess Bottle and Consumables Leaders
- Thermo Fisher Scientific Inc. Nalgene
- Corning Incorporated
- Sartorius AG
- Avantor, Inc.
Specialized Single-Use Closure and Reservoir Converters
- Saint-Gobain Performance Plastics Sani-Tech
- Foxx Life Sciences
- DWK Life Sciences GmbH
- Meissner Filtration Products, Inc.
High-Purity Cryogenic and Fluoropolymer Container Specialists
- Entegris, Inc.
- Savillex Corporation
Biotainer Market - Report Scope
Table 9: Report Scope for the Biotainer Market (coverage fields and definitions), 2026 to 2036
| Coverage field | Report scope |
|---|---|
| Market breakdown | Polymer Resin; Volume Capacity; Closure Assembly; End User; Procurement Model |
| Quantitative Units | USD Million |
| Market Definition | Includes commercial supplier valuation from pre-sterilized and cleanroom-molded rigid polymer bioprocess containers (PETG, polycarbonate, polypropylene, HDPE, and fluoropolymer bottles and carboys from 5 mL to 50 L+) and pre-assembled aseptic dip-tube and tubing closure systems used for media, buffer, harvest, and bulk drug substance freeze-thaw storage. Category Scope Note: Excludes flexible multi-layer 2D and 3D pillow and gusseted bioprocess bags, reusable stainless-steel pressure tanks, and consumer beverage bottles. |
| Regions Covered | North America; Latin America; Western Europe; Eastern Europe; East Asia; South Asia and Pacific; Middle East and Africa |
| Countries Covered | South Korea, China, Japan, Switzerland, United States, Germany, United Kingdom, France, and additional countries in the full report |
| Key Companies Covered | Thermo Fisher Scientific Inc. Nalgene, Saint-Gobain Performance Plastics Sani-Tech, Corning Incorporated, Sartorius AG, Avantor, Inc., Foxx Life Sciences, DWK Life Sciences GmbH, Entegris, Inc., Meissner Filtration Products, Inc., Savillex Corporation |
| Forecast Period | 2026 to 2036 |
| Approach | Primary and secondary research with top-down and bottom-up market triangulation. |
Biotainer Market - Research Methodology
Table 10: Research Methodology for the Biotainer Market (research methods and approach), 2026 edition
| Method | Approach |
|---|---|
| Primary Research | Structured interviews with biopharmaceutical single-use systems engineering directors, CDMO procurement heads, cleanroom blow-molding plant managers, and sterilization validation specialists to verify unit pricing and assembly attach rates. |
| Secondary Research | Analysis of peer-reviewed PMC bioprocess and polymer sterilization studies (Applied Microbiology and Biotechnology, International Journal of Pharmaceutics X, Biotechnology and Bioengineering), FDA CBER approvals, and corporate filings. |
| Market Sizing and Forecasting | Top-down global single-use bioprocessing consumables baselines reconciled against bottom-up rigid bottle unit shipments (41.4M to 46.5M units in 2026) and pre-assembled dip-tube closure attach premiums from 2026 to 2036. |
| Country Forecasting Model | Econometric country projections weight active GMP monoclonal antibody and viral-vector bioreactor liters, CDMO facility expansions, and national biologics regulatory submission rules across eight national markets. |
| Operational Benchmark Traceability | Sterile fluid volume and GMP suite allocation indicators in Tables 2, 3, and 4 trace to Biotechnology Letters downstream buffer consumption ratios, ISO 11137 sterilization standards, and corporate bioprocess segment disclosures. |
| Data Triangulation and Validation | Valuation estimates isolate rigid single-use polymer bottles, carboys, and attached aseptic closure manifolds while strictly excluding flexible pillow bags, stainless-steel cryovessels, and unsterilized commodity labware. |
Biotainer Market by Segments
Biotainer Market segmented by Polymer Resin:
- Gamma-Sterilized Virgin PETG Bottles and Carboys
- Autoclavable Polycarbonate PC and Polypropylene Vessels
- High-Density Polyethylene HDPE Biohazard Containers
- Fluoropolymer PFA and Specialty Cryogenic Vessels
Biotainer Market segmented by Volume Capacity:
- 1 Liter to 5 Liter Media and Buffer Bottles
- 10 Liter to 50 Liter Bulk Bioprocess Carboys
- 5 mL to 500 mL Sampling and Freeze-Thaw Bottles
- Above 50 Liter Rigid Drum and Reservoir Assemblies
Biotainer Market segmented by Closure Assembly:
- Pre-Assembled Aseptic Tubing and Dip-Tube Caps
- Tamper-Evident Standard Screw Closures
- Overmolded Tri-Clamp and Sanitary Flange Caps
- Vented Hydrophobic Membrane Filter Closures
- Multi-Port Sampling and Sensor Probe Caps
Biotainer Market segmented by End User:
- Biopharmaceutical Monoclonal Antibody and Vaccine Plants
- Contract Development and Manufacturing Organizations CDMOs
- Cell and Gene Therapy Labs and Clinical Biobanks
- Academic and Government Bioprocess Research Institutes
Biotainer Market segmented by Procurement Model:
- Direct Multi-Year Converter Supply Contracts
- Industrial Packaging Distributors and Merchant Wholesalers
- Custom Single-Use Manifold Integrator Agreements
- Digital Laboratory e-Procurement Portals
Biotainer Market by Region
- North America
- United States
- Canada
- Latin America
- Brazil
- Mexico
- Argentina
- Chile
- Western Europe
- Germany
- France
- United Kingdom
- Italy
- Spain
- Benelux
- Nordics
- Eastern Europe
- Poland
- Czech Republic
- Romania
- Hungary
- East Asia
- China
- Japan
- South Korea
- South Asia and Pacific
- India
- ASEAN
- Australia and New Zealand
- Middle East and Africa
- GCC Countries
- South Africa
- Türkiye
- Israel
Research Sources and Bibliography
- [1] Glenz, M., Eiermann, P., Manser, B., & Teschner, H. (2026, May 1). Single-use solutions for PUPSIT: requirements, challenges, and solutions. Applied Microbiology and Biotechnology, 110, 138 (PMCID PMC13134992).
- [2] Sartorius AG. (2026, April 23). Sartorius starts fiscal 2026 with profitable growth: First-Quarter Results. Sartorius Group Corporate Newsroom.
- [3] Avantor, Inc. (2026, February 11). Avantor Reports Fourth Quarter and Full Year 2025 Results. Avantor Investor Relations.
- [4] Hauk, A., Bossong, E., & Dorival-Garcia, N. (2026, May 12). Application of clearance strategies for extractables and leachables in biopharmaceutical single-use systems. Journal of Pharmaceutical Sciences, 115(6), 1412-1428 (PMCID PMC13190347).
- [5] Mota, M. F. T., Pacheco, L. G. C., Aguirre, C. A. P., & Albuquerque, E. C. M. C. (2026, August 12). Advances in recombinant protein bioprocessing: integrating technological innovation and environmental sustainability. Biotechnology Letters, 48(4), 100 (PMCID PMC13469212).
- [6] Neves, R. O., Rego, P. S., Costa, M. H. G., Bogalho, I., Duarte, A., da Silva, C. L., Ferreira, F. C., Geraldes, V., & Rodrigues, M. A. (2025, November 28). Bottom-Up Ice Growth Geometry Attenuates Shear Stress and Improves the Cryopreservation of Hematopoietic Stem/Progenitor Cells Under Low DMSO Concentrations. Biotechnology and Bioengineering, 123(3), 582-597 (PMCID PMC12883897).
- [7] Fuentes, J. M., Cadena, H., Remache, A., Flor-Unda, O., Sarria, S., Delgado, J., Bonilla, P., & Ferrandiz, S. (2025, October 27). Effects of Sterilization Processes with Hydrogen Peroxide and Ethylene Oxide on Commercial 3D-Printed PLA, PLA-FC, and PETG by Fused Deposition Modeling. Polymers, 17(21), 2864 (PMCID PMC12609453).
- [8] Zitoun, J., Dippel, J., Pahl, I., Barbaroux, M., & Hauk, A. (2026, March 11). Feasibility study on the impact of mechanical recycling on the extractables profile and toxicologic safety assessment of small-scale polycarbonate bioreactors. International Journal of Pharmaceutics: X, 11, 100516 (PMCID PMC13000528).
- [9] Al-Ghamdi, M. A., Al-Malki, A., & Al-Zahrani, K. (2026, July 14). Bioprocess Development of a Human Monoclonal Antibody against MERS-CoV. Vaccines, 14(7), 912 (PMCID PMC13324588).
- [10] Foxx Life Sciences. (2026, January 15). EZBio Rigid Reservoir Single-Use Technology Fluid Transfer Assemblies. Foxx Life Sciences Technical Catalog.
- [11] Thermo Fisher Scientific Inc. (2026, April 23). Thermo Fisher Scientific Reports First Quarter 2026 Results. Thermo Fisher Scientific Investor Relations.
- [12] Corning Incorporated. (2026, January 28). Corning Announces Outstanding 2025 Financial Results and Upgrades Springboard Plan for Faster Sales Growth. Corning Incorporated Investor Relations.
- [13] U.S. Food and Drug Administration. (2025, December 19). 2025 Biological Device Application Approvals. U.S. Department of Health and Human Services, Center for Biologics Evaluation and Research (CBER).
- [14] Barbaroux, M., & Luu, T. (2025, November 14). Potential Adverse Effects and Toxicological Risk Assessment of Oxidized Irgafos 168 Leachables in Gamma-Irradiated Bioprocess Containers. Pharmaceutical Research, 42(11), 1845-1860 (PMCID PMC12846058).
- [15] Ibrahim, R. T., Faraj, M. K., & Al-Neami, A. Q. H. (2026, March 29). A reusable and universal size polyethylene terephthalate glycol head fixation device for Gamma Knife Radiosurgery: a prospective comparative cohort study. BMC Neurology, 26, 306 (PMCID PMC13151238).
- [16] Korea Disease Control and Prevention Agency. (2026, February 5). KDCA and MFDS Collaborative Drill for Rapid Vaccine Development and Bioprocess Scale-Up. Republic of Korea KDCA Public Health Preparedness Division.
- [17] de Azevedo, A. M., da Silveira, P. H. P. M., Lopes, T. J., da Costa, O. L. B., Monteiro, S. N., Veiga-Junior, V. F., Silveira, P. C. R., Cardoso, D. D., & Figueiredo, A. B. S. (2025, April 19). Ionizing Radiation and Its Effects on Thermoplastic Polymers: An Overview. Polymers, 17(8), 1110 (PMCID PMC12030313).
- [18] Sartorius AG. (2025, October 20). Celsius FFT Commercial-Scale Frozen Storage and Shipping Systems for Bulk Drug Substance. Sartorius Bioprocess Fluid Management.
- [19] Swissmedic. (2026, June 15). Submission of SEND data for new active substance authorisations becomes mandatory. Swiss Agency for Therapeutic Products Authorisations.
- [20] Thermo Fisher Scientific Inc. (2025, November 14). Nalgene Bioprocess Bottle and Carboy Assemblies Technical Specifications. Thermo Fisher Scientific Bioprocessing Fluid Management.
- [21] Ghalot, P., Kronenberger, T., & Neijhoft, J. (2026, July 28). Development and validation of material selection method for cost-effective and sterile bioprocessing polymer components. Biotechnology Journal, 21(8), e202600142 (PMCID PMC13572646).
- [22] Medicines and Healthcare products Regulatory Agency. (2025, October 28). Clinical Trials Regulations: Six-month countdown begins for UK biologics sponsors. UK Government MHRA Inspectorate.
- [23] Meissner Filtration Products, Inc. (2025, October 12). Single-Use Biocontainer and Rigid Bottle Fluid Transfer Assemblies for Aseptic Biomanufacturing. Meissner Technical Bioprocessing Bulletins.
- [24] Saint-Gobain Performance Plastics. (2026, July 1). Business Update: Saint-Gobain Life Sciences Becomes Critical Process Solutions. Saint-Gobain Critical Process Solutions Newsroom.
- [25] Avantor, Inc. (2025, April 1). Avantor Showcases Scalable Fluid Handling Innovations at INTERPHEX. Avantor Investor Relations.
- [26] DWK Life Sciences GmbH. (2025, September 18). DURAN and WHEATON Primary Bioprocess Containers and Leak-Resistant Closure Systems. DWK Life Sciences Technical Product Documentation.
- [27] Entegris, Inc. (2026, February 10). Aramus High-Purity Fluoropolymer and Rigid Freeze-Thaw Bioprocess Containers. Entegris Life Sciences Fluid Management.
- [28] Savillex Corporation. (2025, August 20). Purillex PFA and PETG Bulk Drug Substance Freeze-Thaw Bottles for Biologics Storage. Savillex Life Sciences Container Documentation.
This bibliography is provided for reader reference and is not exhaustive. The full report contains the complete reference list and detailed source annotations.
This Report Answers
- How large is the biotainer market in 2026 and what is forecast for 2036?
- Which cleanroom fluid transfer and bulk drug substance freezing requirements support demand for biotainers?
- Why do Gamma-Sterilized Virgin PETG Bottles and Carboys lead the polymer resin category?
- Why do 1 Liter to 5 Liter Media and Buffer Bottles lead the volume capacity category globally?
- How do growth rates differ between South Korea and China as well as the United States and Western Europe?
- Which leading companies supply integrated cleanroom bottles versus custom dip-tube closure assemblies today?
- What limits cryogenic radial freeze-thaw survival or polycarbonate autoclaving in the biotainer market?
- What should biopharma engineering teams evaluate before switching from glass carboys to single-use PETG biotainers?
Table of Content
- Key Takeaways
- Market Size and CAGR
- Top Growth Driver
- Fastest Growing Segment
- Leading Region
- Key Companies
- Emerging Opportunities
- Executive Summary
- Global Market Outlook
- Demand-side Trends
- Supply-side Trends
- Technology Roadmap Analysis
- Analysis and Recommendations
- Analyst Perspective (What is happening? Why now? What should investors know?)
- Key Questions Answered
- How large is the market?
- What is the CAGR?
- What are key trends?
- Which region dominates?
- Who are the leaders?
Read More...
- Market Overview
- Market Coverage / Taxonomy
- Market Definition / Scope / Limitations
- Research Methodology
- Chapter Orientation
- Analytical Lens and Working Hypotheses
- Market Structure, Signals, and Trend Drivers
- Benchmarking and Cross-market Comparability
- Market Sizing, Forecasting, and Opportunity Mapping
- Research Design and Evidence Framework
- Desk Research Programme (Secondary Evidence)
- Expert Input and Fieldwork (Primary Evidence)
- Tooling, Models, and Reference Databases
- Data Engineering and Model Build
- Quality Assurance and Audit Trail
- Market Background
- Market Dynamics (Drivers, Restraints, Opportunity, Trends)
- Scenario Forecast (Optimistic, Likely, Conservative)
- Impact Analysis
- AI Impact
- Sustainability Impact
- Regulatory Impact
- Technology Impact
- Consumer / Buyer Analysis
- Purchase Drivers
- Adoption Barriers
- Buyer Journey
- Opportunity Map Analysis
- Product Life Cycle Analysis
- Supply Chain Analysis
- Investment Feasibility Matrix
- Value Chain Analysis
- PESTLE and Porter's Analysis
- Regulatory Landscape
- Regional Parent Market Outlook
- Production and Consumption Statistics
- Import and Export Statistics
- Global Market Analysis and Forecast, 2021 to 2036
- Historical Market Size Value (USD Million) Analysis, 2021 to 2025
- Current and Future Market Size Value (USD Million) Projections, 2026 to 2036
- Y-o-Y Growth Trend Analysis
- Absolute $ Opportunity Analysis
- Global Market Pricing Analysis, 2021 to 2036
- Global Market Analysis and Forecast, By Polymer Resin, 2021 to 2036
- Introduction / Key Findings
- Historical Market Size Value (USD Million) Analysis By Polymer Resin, 2021 to 2025
- Current and Future Market Size Value (USD Million) Analysis and Forecast By Polymer Resin, 2026 to 2036
- Gamma-Sterilized Virgin PETG Bottles and Carboys
- Autoclavable Polycarbonate PC and Polypropylene Vessels
- High-Density Polyethylene HDPE Biohazard Containers
- Fluoropolymer PFA and Specialty Cryogenic Vessels
- Y-o-Y Growth Trend Analysis By Polymer Resin, 2021 to 2025
- Absolute $ Opportunity Analysis By Polymer Resin, 2026 to 2036
- Global Market Analysis and Forecast, By Volume Capacity, 2021 to 2036
- Introduction / Key Findings
- Historical Market Size Value (USD Million) Analysis By Volume Capacity, 2021 to 2025
- Current and Future Market Size Value (USD Million) Analysis and Forecast By Volume Capacity, 2026 to 2036
- 1 Liter to 5 Liter Media and Buffer Bottles
- 10 Liter to 50 Liter Bulk Bioprocess Carboys
- 5 mL to 500 mL Sampling and Freeze-Thaw Bottles
- Above 50 Liter Rigid Drum and Reservoir Assemblies
- Y-o-Y Growth Trend Analysis By Volume Capacity, 2021 to 2025
- Absolute $ Opportunity Analysis By Volume Capacity, 2026 to 2036
- Global Market Analysis and Forecast, By Closure Assembly, 2021 to 2036
- Introduction / Key Findings
- Historical Market Size Value (USD Million) Analysis By Closure Assembly, 2021 to 2025
- Current and Future Market Size Value (USD Million) Analysis and Forecast By Closure Assembly, 2026 to 2036
- Pre-Assembled Aseptic Tubing and Dip-Tube Caps
- Tamper-Evident Standard Screw Closures
- Overmolded Tri-Clamp and Sanitary Flange Caps
- Vented Hydrophobic Membrane Filter Closures
- Multi-Port Sampling and Sensor Probe Caps
- Y-o-Y Growth Trend Analysis By Closure Assembly, 2021 to 2025
- Absolute $ Opportunity Analysis By Closure Assembly, 2026 to 2036
- Global Market Analysis and Forecast, By End User, 2021 to 2036
- Introduction / Key Findings
- Historical Market Size Value (USD Million) Analysis By End User, 2021 to 2025
- Current and Future Market Size Value (USD Million) Analysis and Forecast By End User, 2026 to 2036
- Biopharmaceutical Monoclonal Antibody and Vaccine Plants
- Contract Development and Manufacturing Organizations CDMOs
- Cell and Gene Therapy Labs and Clinical Biobanks
- Academic and Government Bioprocess Research Institutes
- Y-o-Y Growth Trend Analysis By End User, 2021 to 2025
- Absolute $ Opportunity Analysis By End User, 2026 to 2036
- Global Market Analysis and Forecast, By Procurement Model, 2021 to 2036
- Introduction / Key Findings
- Historical Market Size Value (USD Million) Analysis By Procurement Model, 2021 to 2025
- Current and Future Market Size Value (USD Million) Analysis and Forecast By Procurement Model, 2026 to 2036
- Direct Multi-Year Converter Supply Contracts
- Industrial Packaging Distributors and Merchant Wholesalers
- Custom Single-Use Manifold Integrator Agreements
- Digital Laboratory e-Procurement Portals
- Y-o-Y Growth Trend Analysis By Procurement Model, 2021 to 2025
- Absolute $ Opportunity Analysis By Procurement Model, 2026 to 2036
- Global Market Analysis and Forecast, By Region, 2021 to 2036
- Introduction
- Historical Market Size Value (USD Million) Analysis By Region, 2021 to 2025
- Current Market Size Value (USD Million) Analysis and Forecast By Region, 2026 to 2036
- North America
- Latin America
- Western Europe
- Eastern Europe
- East Asia
- South Asia and Pacific
- Middle East and Africa
- Market Attractiveness Analysis By Region
- North America Market Analysis and Forecast, By Country, 2021 to 2036
- Historical Market Size Value (USD Million) Trend Analysis By Market Taxonomy, 2021 to 2025
- Market Size Value (USD Million) Forecast By Market Taxonomy, 2026 to 2036
- By Country
- United States
- Canada
- By Polymer Resin
- By Volume Capacity
- By Closure Assembly
- By End User
- By Procurement Model
- By Country
- Market Attractiveness Analysis
- By Country
- By Polymer Resin
- By Volume Capacity
- By Closure Assembly
- By End User
- By Procurement Model
- Key Takeaways
- Latin America Market Analysis and Forecast, By Country
- Historical Market Size Value (USD Million) Trend Analysis By Market Taxonomy, 2021 to 2025
- Market Size Value (USD Million) Forecast By Market Taxonomy, 2026 to 2036
- By Country
- Brazil
- Mexico
- Argentina
- Chile
- By Polymer Resin
- By Volume Capacity
- By Closure Assembly
- By End User
- By Procurement Model
- By Country
- Market Attractiveness Analysis
- By Country
- By Polymer Resin
- By Volume Capacity
- By Closure Assembly
- By End User
- By Procurement Model
- Key Takeaways
- Western Europe Market Analysis and Forecast, By Country
- Historical Market Size Value (USD Million) Trend Analysis By Market Taxonomy, 2021 to 2025
- Market Size Value (USD Million) Forecast By Market Taxonomy, 2026 to 2036
- By Country
- Germany
- France
- United Kingdom
- Italy
- Spain
- Benelux
- Nordics
- By Polymer Resin
- By Volume Capacity
- By Closure Assembly
- By End User
- By Procurement Model
- By Country
- Market Attractiveness Analysis
- By Country
- By Polymer Resin
- By Volume Capacity
- By Closure Assembly
- By End User
- By Procurement Model
- Key Takeaways
- Eastern Europe Market Analysis and Forecast, By Country
- Historical Market Size Value (USD Million) Trend Analysis By Market Taxonomy, 2021 to 2025
- Market Size Value (USD Million) Forecast By Market Taxonomy, 2026 to 2036
- By Country
- Poland
- Czech Republic
- Romania
- Hungary
- By Polymer Resin
- By Volume Capacity
- By Closure Assembly
- By End User
- By Procurement Model
- By Country
- Market Attractiveness Analysis
- By Country
- By Polymer Resin
- By Volume Capacity
- By Closure Assembly
- By End User
- By Procurement Model
- Key Takeaways
- East Asia Market Analysis and Forecast, By Country
- Historical Market Size Value (USD Million) Trend Analysis By Market Taxonomy, 2021 to 2025
- Market Size Value (USD Million) Forecast By Market Taxonomy, 2026 to 2036
- By Country
- China
- Japan
- South Korea
- By Polymer Resin
- By Volume Capacity
- By Closure Assembly
- By End User
- By Procurement Model
- By Country
- Market Attractiveness Analysis
- By Country
- By Polymer Resin
- By Volume Capacity
- By Closure Assembly
- By End User
- By Procurement Model
- Key Takeaways
- South Asia and Pacific Market Analysis and Forecast, By Country
- Historical Market Size Value (USD Million) Trend Analysis By Market Taxonomy, 2021 to 2025
- Market Size Value (USD Million) Forecast By Market Taxonomy, 2026 to 2036
- By Country
- India
- ASEAN
- Australia and New Zealand
- By Polymer Resin
- By Volume Capacity
- By Closure Assembly
- By End User
- By Procurement Model
- By Country
- Market Attractiveness Analysis
- By Country
- By Polymer Resin
- By Volume Capacity
- By Closure Assembly
- By End User
- By Procurement Model
- Key Takeaways
- Middle East and Africa Market Analysis and Forecast, By Country
- Historical Market Size Value (USD Million) Trend Analysis By Market Taxonomy, 2021 to 2025
- Market Size Value (USD Million) Forecast By Market Taxonomy, 2026 to 2036
- By Country
- GCC Countries
- South Africa
- Türkiye
- Israel
- By Polymer Resin
- By Volume Capacity
- By Closure Assembly
- By End User
- By Procurement Model
- By Country
- Market Attractiveness Analysis
- By Country
- By Polymer Resin
- By Volume Capacity
- By Closure Assembly
- By End User
- By Procurement Model
- Key Takeaways
- Key Countries Market Analysis
- United States
- Pricing Analysis
- Market Share Analysis, 2025
- By Polymer Resin
- By Volume Capacity
- By Closure Assembly
- By End User
- By Procurement Model
- Canada
- Pricing Analysis
- Market Share Analysis, 2025
- By Polymer Resin
- By Volume Capacity
- By Closure Assembly
- By End User
- By Procurement Model
- Mexico
- Pricing Analysis
- Market Share Analysis, 2025
- By Polymer Resin
- By Volume Capacity
- By Closure Assembly
- By End User
- By Procurement Model
- Brazil
- Pricing Analysis
- Market Share Analysis, 2025
- By Polymer Resin
- By Volume Capacity
- By Closure Assembly
- By End User
- By Procurement Model
- Chile
- Pricing Analysis
- Market Share Analysis, 2025
- By Polymer Resin
- By Volume Capacity
- By Closure Assembly
- By End User
- By Procurement Model
- Germany
- Pricing Analysis
- Market Share Analysis, 2025
- By Polymer Resin
- By Volume Capacity
- By Closure Assembly
- By End User
- By Procurement Model
- United Kingdom
- Pricing Analysis
- Market Share Analysis, 2025
- By Polymer Resin
- By Volume Capacity
- By Closure Assembly
- By End User
- By Procurement Model
- Italy
- Pricing Analysis
- Market Share Analysis, 2025
- By Polymer Resin
- By Volume Capacity
- By Closure Assembly
- By End User
- By Procurement Model
- Spain
- Pricing Analysis
- Market Share Analysis, 2025
- By Polymer Resin
- By Volume Capacity
- By Closure Assembly
- By End User
- By Procurement Model
- France
- Pricing Analysis
- Market Share Analysis, 2025
- By Polymer Resin
- By Volume Capacity
- By Closure Assembly
- By End User
- By Procurement Model
- India
- Pricing Analysis
- Market Share Analysis, 2025
- By Polymer Resin
- By Volume Capacity
- By Closure Assembly
- By End User
- By Procurement Model
- ASEAN
- Pricing Analysis
- Market Share Analysis, 2025
- By Polymer Resin
- By Volume Capacity
- By Closure Assembly
- By End User
- By Procurement Model
- Australia and New Zealand
- Pricing Analysis
- Market Share Analysis, 2025
- By Polymer Resin
- By Volume Capacity
- By Closure Assembly
- By End User
- By Procurement Model
- China
- Pricing Analysis
- Market Share Analysis, 2025
- By Polymer Resin
- By Volume Capacity
- By Closure Assembly
- By End User
- By Procurement Model
- Japan
- Pricing Analysis
- Market Share Analysis, 2025
- By Polymer Resin
- By Volume Capacity
- By Closure Assembly
- By End User
- By Procurement Model
- South Korea
- Pricing Analysis
- Market Share Analysis, 2025
- By Polymer Resin
- By Volume Capacity
- By Closure Assembly
- By End User
- By Procurement Model
- Poland
- Pricing Analysis
- Market Share Analysis, 2025
- By Polymer Resin
- By Volume Capacity
- By Closure Assembly
- By End User
- By Procurement Model
- Hungary
- Pricing Analysis
- Market Share Analysis, 2025
- By Polymer Resin
- By Volume Capacity
- By Closure Assembly
- By End User
- By Procurement Model
- Türkiye
- Pricing Analysis
- Market Share Analysis, 2025
- By Polymer Resin
- By Volume Capacity
- By Closure Assembly
- By End User
- By Procurement Model
- South Africa
- Pricing Analysis
- Market Share Analysis, 2025
- By Polymer Resin
- By Volume Capacity
- By Closure Assembly
- By End User
- By Procurement Model
- Switzerland
- Pricing Analysis
- Market Share Analysis, 2025
- By Polymer Resin
- By Volume Capacity
- By Closure Assembly
- By End User
- By Procurement Model
- United States
- Market Structure Analysis
- Competition Dashboard
- Competition Benchmarking
- Market Share Analysis of Top Players
- By Regional
- By Polymer Resin
- By Volume Capacity
- By Closure Assembly
- By End User
- By Procurement Model
- Emerging Startups
- Innovation Benchmarking
- Competition Analysis
- Competition Deep Dive
- Thermo Fisher Scientific Inc. Nalgene
- Overview
- Product Portfolio
- Profitability by Market Segments
- Sales Footprint
- Strategy Overview
- Marketing Strategy
- Product Strategy
- Channel Strategy
- Saint-Gobain Performance Plastics Sani-Tech
- Corning Incorporated
- Sartorius AG
- Avantor, Inc.
- Foxx Life Sciences
- DWK Life Sciences GmbH
- Entegris, Inc.
- Meissner Filtration Products, Inc.
- Savillex Corporation
- Thermo Fisher Scientific Inc. Nalgene
- Case Studies
- Success Stories
- Recent Developments
- Competition Deep Dive
- Assumptions & Acronyms Used
List of Tables
- Table 1: Global Market Value (USD Million) Forecast by Region, 2021 to 2036
- Table 2: Global Market Value (USD Million) Forecast by Polymer Resin, 2021 to 2036
- Table 3: Global Market Value (USD Million) Forecast by Volume Capacity, 2021 to 2036
- Table 4: Global Market Value (USD Million) Forecast by Closure Assembly, 2021 to 2036
- Table 5: Global Market Value (USD Million) Forecast by End User, 2021 to 2036
- Table 6: Global Market Value (USD Million) Forecast by Procurement Model, 2021 to 2036
- Table 7: North America Market Value (USD Million) Forecast by Country, 2021 to 2036
- Table 8: North America Market Value (USD Million) Forecast by Polymer Resin, 2021 to 2036
- Table 9: North America Market Value (USD Million) Forecast by Volume Capacity, 2021 to 2036
- Table 10: North America Market Value (USD Million) Forecast by Closure Assembly, 2021 to 2036
- Table 11: North America Market Value (USD Million) Forecast by End User, 2021 to 2036
- Table 12: North America Market Value (USD Million) Forecast by Procurement Model, 2021 to 2036
- Table 13: Latin America Market Value (USD Million) Forecast by Country, 2021 to 2036
- Table 14: Latin America Market Value (USD Million) Forecast by Polymer Resin, 2021 to 2036
- Table 15: Latin America Market Value (USD Million) Forecast by Volume Capacity, 2021 to 2036
- Table 16: Latin America Market Value (USD Million) Forecast by Closure Assembly, 2021 to 2036
- Table 17: Latin America Market Value (USD Million) Forecast by End User, 2021 to 2036
- Table 18: Latin America Market Value (USD Million) Forecast by Procurement Model, 2021 to 2036
- Table 19: Western Europe Market Value (USD Million) Forecast by Country, 2021 to 2036
- Table 20: Western Europe Market Value (USD Million) Forecast by Polymer Resin, 2021 to 2036
- Table 21: Western Europe Market Value (USD Million) Forecast by Volume Capacity, 2021 to 2036
- Table 22: Western Europe Market Value (USD Million) Forecast by Closure Assembly, 2021 to 2036
- Table 23: Western Europe Market Value (USD Million) Forecast by End User, 2021 to 2036
- Table 24: Western Europe Market Value (USD Million) Forecast by Procurement Model, 2021 to 2036
- Table 25: Eastern Europe Market Value (USD Million) Forecast by Country, 2021 to 2036
- Table 26: Eastern Europe Market Value (USD Million) Forecast by Polymer Resin, 2021 to 2036
- Table 27: Eastern Europe Market Value (USD Million) Forecast by Volume Capacity, 2021 to 2036
- Table 28: Eastern Europe Market Value (USD Million) Forecast by Closure Assembly, 2021 to 2036
- Table 29: Eastern Europe Market Value (USD Million) Forecast by End User, 2021 to 2036
- Table 30: Eastern Europe Market Value (USD Million) Forecast by Procurement Model, 2021 to 2036
- Table 31: East Asia Market Value (USD Million) Forecast by Country, 2021 to 2036
- Table 32: East Asia Market Value (USD Million) Forecast by Polymer Resin, 2021 to 2036
- Table 33: East Asia Market Value (USD Million) Forecast by Volume Capacity, 2021 to 2036
- Table 34: East Asia Market Value (USD Million) Forecast by Closure Assembly, 2021 to 2036
- Table 35: East Asia Market Value (USD Million) Forecast by End User, 2021 to 2036
- Table 36: East Asia Market Value (USD Million) Forecast by Procurement Model, 2021 to 2036
- Table 37: South Asia and Pacific Market Value (USD Million) Forecast by Country, 2021 to 2036
- Table 38: South Asia and Pacific Market Value (USD Million) Forecast by Polymer Resin, 2021 to 2036
- Table 39: South Asia and Pacific Market Value (USD Million) Forecast by Volume Capacity, 2021 to 2036
- Table 40: South Asia and Pacific Market Value (USD Million) Forecast by Closure Assembly, 2021 to 2036
- Table 41: South Asia and Pacific Market Value (USD Million) Forecast by End User, 2021 to 2036
- Table 42: South Asia and Pacific Market Value (USD Million) Forecast by Procurement Model, 2021 to 2036
- Table 43: Middle East and Africa Market Value (USD Million) Forecast by Country, 2021 to 2036
- Table 44: Middle East and Africa Market Value (USD Million) Forecast by Polymer Resin, 2021 to 2036
- Table 45: Middle East and Africa Market Value (USD Million) Forecast by Volume Capacity, 2021 to 2036
- Table 46: Middle East and Africa Market Value (USD Million) Forecast by Closure Assembly, 2021 to 2036
- Table 47: Middle East and Africa Market Value (USD Million) Forecast by End User, 2021 to 2036
- Table 48: Middle East and Africa Market Value (USD Million) Forecast by Procurement Model, 2021 to 2036
List of Figures
- Figure 1: Global Market Pricing Analysis
- Figure 2: Global Market Value (USD Million) Forecast 2021-2036
- Figure 3: Global Market Value Share and BPS Analysis by Polymer Resin, 2026 and 2036
- Figure 4: Global Market Y-o-Y Growth Comparison by Polymer Resin, 2026-2036
- Figure 5: Global Market Attractiveness Analysis by Polymer Resin
- Figure 6: Global Market Value Share and BPS Analysis by Volume Capacity, 2026 and 2036
- Figure 7: Global Market Y-o-Y Growth Comparison by Volume Capacity, 2026-2036
- Figure 8: Global Market Attractiveness Analysis by Volume Capacity
- Figure 9: Global Market Value Share and BPS Analysis by Closure Assembly, 2026 and 2036
- Figure 10: Global Market Y-o-Y Growth Comparison by Closure Assembly, 2026-2036
- Figure 11: Global Market Attractiveness Analysis by Closure Assembly
- Figure 12: Global Market Value Share and BPS Analysis by End User, 2026 and 2036
- Figure 13: Global Market Y-o-Y Growth Comparison by End User, 2026-2036
- Figure 14: Global Market Attractiveness Analysis by End User
- Figure 15: Global Market Value Share and BPS Analysis by Procurement Model, 2026 and 2036
- Figure 16: Global Market Y-o-Y Growth Comparison by Procurement Model, 2026-2036
- Figure 17: Global Market Attractiveness Analysis by Procurement Model
- Figure 18: Global Market Value (USD Million) Share and BPS Analysis by Region, 2026 and 2036
- Figure 19: Global Market Y-o-Y Growth Comparison by Region, 2026-2036
- Figure 20: Global Market Attractiveness Analysis by Region
- Figure 21: North America Market Incremental Dollar Opportunity, 2026-2036
- Figure 22: Latin America Market Incremental Dollar Opportunity, 2026-2036
- Figure 23: Western Europe Market Incremental Dollar Opportunity, 2026-2036
- Figure 24: Eastern Europe Market Incremental Dollar Opportunity, 2026-2036
- Figure 25: East Asia Market Incremental Dollar Opportunity, 2026-2036
- Figure 26: South Asia and Pacific Market Incremental Dollar Opportunity, 2026-2036
- Figure 27: Middle East and Africa Market Incremental Dollar Opportunity, 2026-2036
- Figure 28: North America Market Value Share and BPS Analysis by Country, 2026 and 2036
- Figure 29: North America Market Value Share and BPS Analysis by Polymer Resin, 2026 and 2036
- Figure 30: North America Market Y-o-Y Growth Comparison by Polymer Resin, 2026-2036
- Figure 31: North America Market Attractiveness Analysis by Polymer Resin
- Figure 32: North America Market Value Share and BPS Analysis by Volume Capacity, 2026 and 2036
- Figure 33: North America Market Y-o-Y Growth Comparison by Volume Capacity, 2026-2036
- Figure 34: North America Market Attractiveness Analysis by Volume Capacity
- Figure 35: North America Market Value Share and BPS Analysis by Closure Assembly, 2026 and 2036
- Figure 36: North America Market Y-o-Y Growth Comparison by Closure Assembly, 2026-2036
- Figure 37: North America Market Attractiveness Analysis by Closure Assembly
- Figure 38: North America Market Value Share and BPS Analysis by End User, 2026 and 2036
- Figure 39: North America Market Y-o-Y Growth Comparison by End User, 2026-2036
- Figure 40: North America Market Attractiveness Analysis by End User
- Figure 41: North America Market Value Share and BPS Analysis by Procurement Model, 2026 and 2036
- Figure 42: North America Market Y-o-Y Growth Comparison by Procurement Model, 2026-2036
- Figure 43: North America Market Attractiveness Analysis by Procurement Model
- Figure 44: Latin America Market Value Share and BPS Analysis by Country, 2026 and 2036
- Figure 45: Latin America Market Value Share and BPS Analysis by Polymer Resin, 2026 and 2036
- Figure 46: Latin America Market Y-o-Y Growth Comparison by Polymer Resin, 2026-2036
- Figure 47: Latin America Market Attractiveness Analysis by Polymer Resin
- Figure 48: Latin America Market Value Share and BPS Analysis by Volume Capacity, 2026 and 2036
- Figure 49: Latin America Market Y-o-Y Growth Comparison by Volume Capacity, 2026-2036
- Figure 50: Latin America Market Attractiveness Analysis by Volume Capacity
- Figure 51: Latin America Market Value Share and BPS Analysis by Closure Assembly, 2026 and 2036
- Figure 52: Latin America Market Y-o-Y Growth Comparison by Closure Assembly, 2026-2036
- Figure 53: Latin America Market Attractiveness Analysis by Closure Assembly
- Figure 54: Latin America Market Value Share and BPS Analysis by End User, 2026 and 2036
- Figure 55: Latin America Market Y-o-Y Growth Comparison by End User, 2026-2036
- Figure 56: Latin America Market Attractiveness Analysis by End User
- Figure 57: Latin America Market Value Share and BPS Analysis by Procurement Model, 2026 and 2036
- Figure 58: Latin America Market Y-o-Y Growth Comparison by Procurement Model, 2026-2036
- Figure 59: Latin America Market Attractiveness Analysis by Procurement Model
- Figure 60: Western Europe Market Value Share and BPS Analysis by Country, 2026 and 2036
- Figure 61: Western Europe Market Value Share and BPS Analysis by Polymer Resin, 2026 and 2036
- Figure 62: Western Europe Market Y-o-Y Growth Comparison by Polymer Resin, 2026-2036
- Figure 63: Western Europe Market Attractiveness Analysis by Polymer Resin
- Figure 64: Western Europe Market Value Share and BPS Analysis by Volume Capacity, 2026 and 2036
- Figure 65: Western Europe Market Y-o-Y Growth Comparison by Volume Capacity, 2026-2036
- Figure 66: Western Europe Market Attractiveness Analysis by Volume Capacity
- Figure 67: Western Europe Market Value Share and BPS Analysis by Closure Assembly, 2026 and 2036
- Figure 68: Western Europe Market Y-o-Y Growth Comparison by Closure Assembly, 2026-2036
- Figure 69: Western Europe Market Attractiveness Analysis by Closure Assembly
- Figure 70: Western Europe Market Value Share and BPS Analysis by End User, 2026 and 2036
- Figure 71: Western Europe Market Y-o-Y Growth Comparison by End User, 2026-2036
- Figure 72: Western Europe Market Attractiveness Analysis by End User
- Figure 73: Western Europe Market Value Share and BPS Analysis by Procurement Model, 2026 and 2036
- Figure 74: Western Europe Market Y-o-Y Growth Comparison by Procurement Model, 2026-2036
- Figure 75: Western Europe Market Attractiveness Analysis by Procurement Model
- Figure 76: Eastern Europe Market Value Share and BPS Analysis by Country, 2026 and 2036
- Figure 77: Eastern Europe Market Value Share and BPS Analysis by Polymer Resin, 2026 and 2036
- Figure 78: Eastern Europe Market Y-o-Y Growth Comparison by Polymer Resin, 2026-2036
- Figure 79: Eastern Europe Market Attractiveness Analysis by Polymer Resin
- Figure 80: Eastern Europe Market Value Share and BPS Analysis by Volume Capacity, 2026 and 2036
- Figure 81: Eastern Europe Market Y-o-Y Growth Comparison by Volume Capacity, 2026-2036
- Figure 82: Eastern Europe Market Attractiveness Analysis by Volume Capacity
- Figure 83: Eastern Europe Market Value Share and BPS Analysis by Closure Assembly, 2026 and 2036
- Figure 84: Eastern Europe Market Y-o-Y Growth Comparison by Closure Assembly, 2026-2036
- Figure 85: Eastern Europe Market Attractiveness Analysis by Closure Assembly
- Figure 86: Eastern Europe Market Value Share and BPS Analysis by End User, 2026 and 2036
- Figure 87: Eastern Europe Market Y-o-Y Growth Comparison by End User, 2026-2036
- Figure 88: Eastern Europe Market Attractiveness Analysis by End User
- Figure 89: Eastern Europe Market Value Share and BPS Analysis by Procurement Model, 2026 and 2036
- Figure 90: Eastern Europe Market Y-o-Y Growth Comparison by Procurement Model, 2026-2036
- Figure 91: Eastern Europe Market Attractiveness Analysis by Procurement Model
- Figure 92: East Asia Market Value Share and BPS Analysis by Country, 2026 and 2036
- Figure 93: East Asia Market Value Share and BPS Analysis by Polymer Resin, 2026 and 2036
- Figure 94: East Asia Market Y-o-Y Growth Comparison by Polymer Resin, 2026-2036
- Figure 95: East Asia Market Attractiveness Analysis by Polymer Resin
- Figure 96: East Asia Market Value Share and BPS Analysis by Volume Capacity, 2026 and 2036
- Figure 97: East Asia Market Y-o-Y Growth Comparison by Volume Capacity, 2026-2036
- Figure 98: East Asia Market Attractiveness Analysis by Volume Capacity
- Figure 99: East Asia Market Value Share and BPS Analysis by Closure Assembly, 2026 and 2036
- Figure 100: East Asia Market Y-o-Y Growth Comparison by Closure Assembly, 2026-2036
- Figure 101: East Asia Market Attractiveness Analysis by Closure Assembly
- Figure 102: East Asia Market Value Share and BPS Analysis by End User, 2026 and 2036
- Figure 103: East Asia Market Y-o-Y Growth Comparison by End User, 2026-2036
- Figure 104: East Asia Market Attractiveness Analysis by End User
- Figure 105: East Asia Market Value Share and BPS Analysis by Procurement Model, 2026 and 2036
- Figure 106: East Asia Market Y-o-Y Growth Comparison by Procurement Model, 2026-2036
- Figure 107: East Asia Market Attractiveness Analysis by Procurement Model
- Figure 108: South Asia and Pacific Market Value Share and BPS Analysis by Country, 2026 and 2036
- Figure 109: South Asia and Pacific Market Value Share and BPS Analysis by Polymer Resin, 2026 and 2036
- Figure 110: South Asia and Pacific Market Y-o-Y Growth Comparison by Polymer Resin, 2026-2036
- Figure 111: South Asia and Pacific Market Attractiveness Analysis by Polymer Resin
- Figure 112: South Asia and Pacific Market Value Share and BPS Analysis by Volume Capacity, 2026 and 2036
- Figure 113: South Asia and Pacific Market Y-o-Y Growth Comparison by Volume Capacity, 2026-2036
- Figure 114: South Asia and Pacific Market Attractiveness Analysis by Volume Capacity
- Figure 115: South Asia and Pacific Market Value Share and BPS Analysis by Closure Assembly, 2026 and 2036
- Figure 116: South Asia and Pacific Market Y-o-Y Growth Comparison by Closure Assembly, 2026-2036
- Figure 117: South Asia and Pacific Market Attractiveness Analysis by Closure Assembly
- Figure 118: South Asia and Pacific Market Value Share and BPS Analysis by End User, 2026 and 2036
- Figure 119: South Asia and Pacific Market Y-o-Y Growth Comparison by End User, 2026-2036
- Figure 120: South Asia and Pacific Market Attractiveness Analysis by End User
- Figure 121: South Asia and Pacific Market Value Share and BPS Analysis by Procurement Model, 2026 and 2036
- Figure 122: South Asia and Pacific Market Y-o-Y Growth Comparison by Procurement Model, 2026-2036
- Figure 123: South Asia and Pacific Market Attractiveness Analysis by Procurement Model
- Figure 124: Middle East and Africa Market Value Share and BPS Analysis by Country, 2026 and 2036
- Figure 125: Middle East and Africa Market Value Share and BPS Analysis by Polymer Resin, 2026 and 2036
- Figure 126: Middle East and Africa Market Y-o-Y Growth Comparison by Polymer Resin, 2026-2036
- Figure 127: Middle East and Africa Market Attractiveness Analysis by Polymer Resin
- Figure 128: Middle East and Africa Market Value Share and BPS Analysis by Volume Capacity, 2026 and 2036
- Figure 129: Middle East and Africa Market Y-o-Y Growth Comparison by Volume Capacity, 2026-2036
- Figure 130: Middle East and Africa Market Attractiveness Analysis by Volume Capacity
- Figure 131: Middle East and Africa Market Value Share and BPS Analysis by Closure Assembly, 2026 and 2036
- Figure 132: Middle East and Africa Market Y-o-Y Growth Comparison by Closure Assembly, 2026-2036
- Figure 133: Middle East and Africa Market Attractiveness Analysis by Closure Assembly
- Figure 134: Middle East and Africa Market Value Share and BPS Analysis by End User, 2026 and 2036
- Figure 135: Middle East and Africa Market Y-o-Y Growth Comparison by End User, 2026-2036
- Figure 136: Middle East and Africa Market Attractiveness Analysis by End User
- Figure 137: Middle East and Africa Market Value Share and BPS Analysis by Procurement Model, 2026 and 2036
- Figure 138: Middle East and Africa Market Y-o-Y Growth Comparison by Procurement Model, 2026-2036
- Figure 139: Middle East and Africa Market Attractiveness Analysis by Procurement Model
- Figure 140: Global Market - Tier Structure Analysis
- Figure 141: Global Market - Company Share Analysis
Frequently Asked Questions
How big is the biotainer market in 2026, and what is forecast for 2036?
FMI estimates that the global biotainer market size stood at USD 542.0 million in 2025 and reached USD 584.3 million in 2026, with industry valuation projected to reach USD 1,238.3 million by 2036.
What is the CAGR for the biotainer market from 2026 to 2036?
The biotainer sector is projected to expand at a 7.8% CAGR over the 2026 to 2036 window, adding USD 654.0 million in incremental market value.
Which polymer resin segment leads the biotainer market?
Gamma-Sterilized Virgin PETG Bottles and Carboys hold 56.4% of polymer resin demand in 2026 because amorphous copolyester preserves optical clarity and 53 MPa mechanical strength after 25 kGy to 50 kGy gamma sterilization.
Which volume capacity segment leads the biotainer market?
1 Liter to 5 Liter Media and Buffer Bottles represent 44.8% of the volume capacity category in 2026 as benchtop bioreactor feeds and blast-freezer drug substance aliquots standardize on 2 L square footprints.
Which country has a notable growth outlook during the assessment period?
South Korea leads national expansion projections at an 8.6% CAGR through 2036, driven by Songdo contract biomanufacturing campuses and national 100-day vaccine readiness drills.
Who are the key players in the market?
Thermo Fisher Scientific Inc. Nalgene, Saint-Gobain Performance Plastics Sani-Tech, Corning Incorporated, Sartorius AG, Avantor, Inc., Foxx Life Sciences, DWK Life Sciences GmbH, Entegris, Inc., Meissner Filtration Products, Inc., and Savillex Corporation lead commercial supply.
Preview the report firsthand - request a free sample
Get SampleGet the brochure for pricing and purchase details.
Get PDF
