Bot Security Market
Bot Security Market By Component (Standalone Solution, Services), Security Type (Web Security, Mobile Security, API Security), Deployment Mode (Cloud, On-premises), Organization Size (Large Enterprises, SMEs), Vertical (Retail and eCommerce, Media and Entertainment, Travel and Tourism, BFSI, Telecom) & Region - Forecast to 2022 - 2032
Market Insights on Bot Security covering sales outlook, demand forecast & up-to-date key trends
Bot Security Market Outlook (2022-2032)
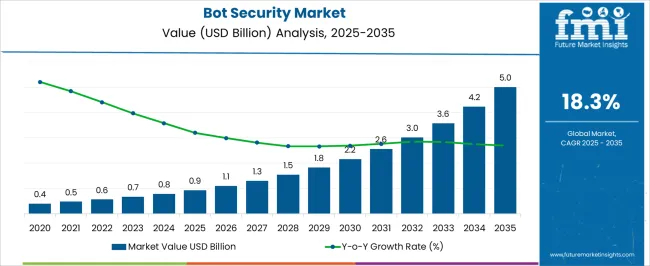
[323 Pages Report] The bot security market is projected to record a CAGR of 17.6% during the forecast period (2022 - 2032). The bot security market is projected to be valued at US$ 487.0 Mn in 2022 and is expected to reach US$ 2.5 Bn by 2032.
“Bot security protects bots from malicious activities like unauthorized access, card fraud, credential leaks, DDoS assaults, web scraping, data theft, account hacking, and so on. Bot security solutions and services protect businesses from botnet attacks by detecting and preventing them at early stages.”
The demand for bot security is anticipated to be driven by an increase in harmful bot traffic, increasing complexity of botnet attacks, and loss of revenue for businesses. Furthermore, traffic transfer from the web to mobile and a boom in the use of APIs across various sectors are propelling the growth of bot security market.
Attributes |
Details |
Bot Security Market CAGR (2022-2032) |
17.6% |
Bot Security Market Value (2022) |
US$ 487.0 Mn |
Bot Security Market Value (2032) |
US$ 2.5 Bn |
What Is The COVID-19 Impact On The Bot Security Market?
The COVID-19 pandemic had a negative impact on the bot security market and major players operating in it. The internet ecosystem has become increasingly important around the world. As people's reliance on online businesses has grown considerably there is an increase in malicious bot traffic, which in turn is driving the demand for bot security.
According to analysis, 40.8 percent of Internet traffic in 2020 was not human; bad bot traffic climbed by 6.2 percent and now accounts for more than a quarter of all website requests. As a result, the demand for bot security solutions is high, according to vendors.
Various governments and regulatory agencies have forced both public and private organizations to accept new techniques of teleworking and preserving social distance in the wake of the COVID-19 pandemic. This is anticipated to drive the demand for bot security solutions during the forecast period.
For various organizations, digital ways of doing business have become the new Business Continuity Plan (BCP), which is further driving the demand for bot security solutions. Due to the increased usage of mobile devices and internet penetration around the world, businesses are increasingly turning to bot security solutions and services to protect themselves from DDoS assaults, web scraping, account hijacking, spam, and other malware threats.
The pandemic of COVID-19 has had a significant influence on the boat security market. Due to insufficient organizational finances, bot security adoption declined by around 5% to 6% in the first half of 2020, which affected the global bot security market share during the forecast period.
Let us know your requirement to get
100% FREE customization
What Is The Key Dynamics Governing The Growth Of The Bot Security Market?
There are good bots and bad bots on the Internet. The demand for bot security solutions is anticipated to rise as bots accounted for over a quarter of all Internet traffic in 2019 and over half of all automated online traffic.
According to Akamai, hostile botnets account for 43% of all login attempts. The percentage of hostile botnets is projected to rise as the popularity of assaults such as credential stuffing grows due to the availability of data on the dark web.
According to TechRadar, 30% of all bots claiming to be Google bots aren't actually Google bots. Bad bots use the legitimate Google bot user agents, and Google Cloud Platform IP addresses to hide their actual identity and steal information. These incidents are predicted to boost the demand for bot security.
FMI analysts predict that as bots get more intelligent, they are likely to account for more than half of all web traffic. Hackers are leveraging new technologies like AI and machine learning to sophisticate bots so that they can effectively mimic human behavior online, making it more difficult for bot detection and blocking solutions to detect and block their actions.
Bot security solutions use contextual data like IP addresses and previous user activity data to assess whether a visitor is a bot or a human and respond accordingly. As a result, there is an increased demand for bot security and effective bot security solutions.
According to a study, the world's smartphone users totaled 3.5 billion in 2019. This figure is likely to grow significantly in the next years. Due to this increased Internet penetration, the demand for bot security is anticipated to rise. Furthermore, in industrialized economies, smartphone ownership is rising substantially, which is another major factor driving the bot security market.
The botnet attacks are rising as smartphones are being used to perform a variety of tasks, including internet shopping, social media apps, and product research. As a result, the demand for bot security solutions is anticipated to grow rapidly.
Smartphone users are spending more time on their smartphones due to the introduction of social media apps like Facebook, Instagram, and Snapchat, as well as digital entertainment platforms like Netflix and Amazon Prime.
As a result, web traffic is shifting from desktop to mobile, making botnet attacks a profitable target. Mobile online traffic accounted for roughly 52.6 percent of global web traffic in 2019, according to the research.
Due to these worrying figures, bot security companies are focusing more on mobile security. As a result, bot security service providers are projected to benefit from the shift in online traffic to mobile.
Comparative View Of Adjacent Bot Security Market
Bot Security Market :
Attributes |
Bot Security Market |
CAGR (2022-2032) |
17.6% |
Market Value (2026) |
US$ 931.45 Mn |
Growth Factor |
The surge in bad bot traffic, rise in the sophistication of botnet attacks are factors responsible for the growth of bot security market. |
Opportunity |
The shift of web traffic to mobile is expected to create lucrative opportunities for bot security vendors. |
Key Trends |
Various countries of the world are witnessing an increase in ideological and state-driven attacks that target persons or organizations in order to promote a political cause. |
Botnet Detection Market :
Attributes |
Botnet Detection Market |
CAGR (2022-2032) |
37% |
Market Value (2026) |
US$ 3,062.74 Mn |
Growth Factor |
As botnet-attacking firms adopt botnet detection solutions to protect against advanced persistent bots, the botnet detection market is rising. |
Opportunity |
As the demand for security against bad bot traffic grows, the Botnet Detection Market has the potential to expand globally. |
Key Trends |
Large organizations and SMEs are shifting from traditional on-premises botnet detection solutions to cloud-based botnet detection solutions as more applications are deployed over the cloud. |
Bot Mitigation Market :
Attributes |
Bot Mitigation Market |
CAGR (2022-2032) |
45% |
Market Value (2026) |
US$ 2,118.04 Mn |
Growth Factor |
The expansion of the bot mitigation market is predicted to be fueled by the surge in automated bot attacks on enterprise networks. |
Opportunity |
Bot detection and mitigation solutions are being used by businesses to detect and defend against bot assaults and other illegal bot activity. |
Key Trends |
The advanced bot mitigation solution can be combined with firewalls to create a comprehensive application security solution that is simple to deploy and administer. |
Botnet detection solutions are being deployed to protect against advanced bad bots as a result of the surge in bot attacks. The sales of bot security services are predicted to rise as it aids in accurately detecting and categorizing different types of bots, bot traffic, and their sources by public and private enterprises using them.
As a result, the demand for bot security against bad bot traffic is growing, resulting in a global botnet detection market with significant growth potential. Botnet detection aids in the reduction of server load and bandwidth expenses.
In addition, the botnet identification system helps to improve the user experience on their various websites. One of the greatest stumbling blocks is the global demand for traditional bot security measures over the botnet detection system.
As a result, the botnet detection market's growth is slowed to some level. In addition, there is a lack of understanding of bot issues among online users. During the foreseeable years, these factors may hinder the demand for bot security solutions.
Find your sweet spots for generating winning opportunities in this market.
Talk to AnalystWhat Is The Segmentation Outlook For The Bot Security Market?
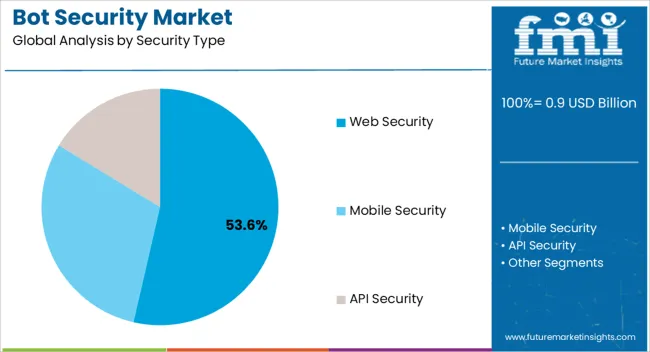
The mobile security segment in global bot security market is expected to rise at a substantial CAGR during the forecast period, owing to the increasing smartphone prevalence, which leads to an increase in the number of mobile platform attacks helped by advancements in circumventing modern authentication approaches.
Which Segment Is Likely To Dominate The Bot Security Market By Verticals?
The retail and eCommerce segment is anticipated to expand with the biggest market size during the projection period, by verticals. Bad bot attacks, such as denial of inventory, scalping, scraping, credential stuffing, and Layer 7 DDoS assaults, mostly target online retail and e-commerce enterprises. These assaults can cause a website's performance to suffer, as well as downtime, the exposure of important client information, and revenue loss.
According to a Forrester Research poll of 400 respondents, 63 percent said web scraping assaults alone cost them between 1% and 10% of their income. These types of bot attacks not only cause technical issues but also have a financial impact.
As a result, strong security measures against malicious bots must be implemented and maintained by online shops. Building client trust requires ensuring the availability and security of e-commerce platforms, networks, and apps.

An unified Market Research Subscription Platform, built for today’s disparate research needs.
Which Segment Is Likely To Lead The Bot Security Market By Component?
The largest market share is anticipated to be held by the services sector. The growth is likely to be owing to the increasing adoption of standalone solution in mobile apps, secure websites, and APIs around the world.
During the forecast period, the demand for standalone solution is likely to grow at a CAGR of 17.3%.
Which Segment Is Likely To Lead The Bot Security Market By Deployment Mode?
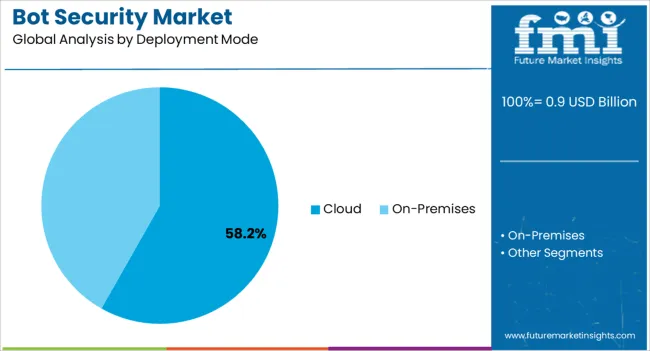
Over the forecast period, the cloud-based deployment mode segment is expected to grow at a faster rate than the on-premises deployment mode. Benefits such as greater IT security, speed, increased scalability, and 24/7 service can be linked to the reasons.
What Is The Regional Analysis For The Bot Security Market?
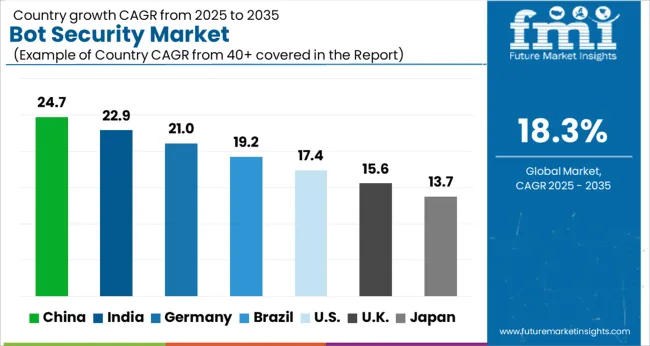
Regions |
CAGR (2022-2032) |
United States |
17.4% |
United Kingdom |
16.4% |
China |
16.9% |
Japan |
15.8% |
South Korea |
15.0% |
During the projected period, North America is expected to hold the greatest share of the bot security market. Early acceptance of bot management and existing manufacturers supplying bot security measures are expected to drive bot securiy market growth in the region.
Bot security solutions are used to protect online businesses from cyber-attacks, enable data security, and provide data privacy in order to ensure the company's long-term viability.
North America, according to Cloudflare, Inc., it is a major source of managed traffic, accounting for approximately 80% of validated bot traffic and more than 50% of managed traffic. More demand for bot security solutions is being driven by the growing threat of bots wreaking havoc on governments.
For example, the US Department of Defense (DoD) took the rapid spread of malware affecting commercial networks and government activities very seriously in 2018 and requested enhanced automated ways to avoid the attacks.
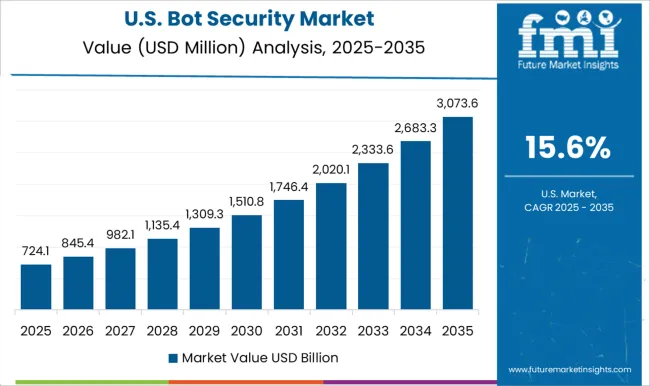
The United States and Canada place a premium on technological breakthroughs and R&D-based breakthroughs. The area is predicted to be the most revenue-generating region in the market due to rising expenditures on botnet detection systems to safeguard websites, mobile applications, and APIs from bot attacks.
How Is The Competition In The Bot Security Market?
To protect end-users from sophisticated bot attacks and viruses, businesses are aggressively embracing cloud-based bot protection solutions. The bot security market is competitive due to the large number of participants.
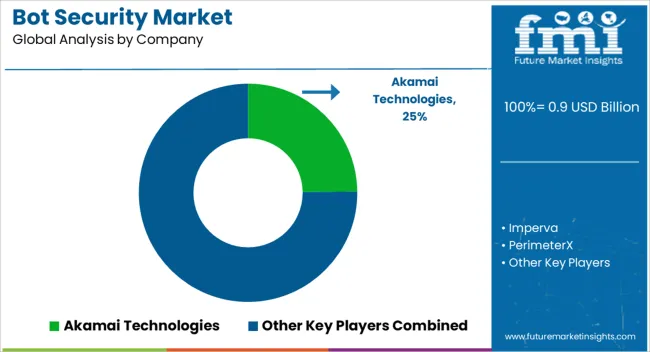
In terms of market share, a few significant companies currently dominate the bot security market. The rate at which bot security solutions are adopted by businesses is directly proportionate to the demand for bot security solutions.
Recent Developments in the Bot Security Market
- White Ops announced a partnership with Yieldmo, a prominent independent mobile ad marketplace, in September 2019 to protect its programmatic requirement partners against advanced bot attacks.
- Imperva Inc. purchased Prevoty Inc., a leader in run-time software self-protection, in August 2018 to expand its market position, particularly in bot security measures.
- In February 2019, Akamai Technologies, Inc. and Mitsubishi UFJ Financial Group announced the formation of the Global Open Network, Inc., with the goal of providing a new blockchain-based digital payment network with increased security, scope, and support.
Key Players
- Akamai Technologies
- Imperva
- PerimeterX
- Cloudflare
- Radware
Key Segments
By Security Type:
- Web Security
- Mobile Security
- API Security
By Deployment Mode:
- Cloud
- On-Premises
By Organization Size:
- Small and Medium-sized Enterprises (SMEs)
- Large Enterprises
By Vertical:
- Retail and eCommerce
- Media and Entertainment
- Travel and Tourism
- BFSI
- Telecom
- Government and Defense
- Healthcare
- Others
By Region:
- North America
- Europe
- Asia Pacific
- Middle East and Africa
- Latin America
Frequently Asked Questions
The bot security market is projected to record a CAGR of 17.6% during the forecast period (2022 - 2032).
During the projected period, North America is expected to hold the greatest share of the bot security market.
By verticals, the retail and eCommerce category is expected to grow with the largest market size throughout the forecast period.
The bot security market is projected to be valued at US$ 2.5 Bn by 2032.
The United States is predicted to be the most revenue-generating region in the market due to rising expenditures on botnet detection systems.
1. Executive Summary
1.1. Global Market Outlook
1.2. Summary of Statistics
1.3. Key Market Characteristics & Attributes
1.4. Fact.MR Analysis and Recommendations
2. Market Overview
2.1. Market Coverage / Taxonomy
2.2. Market Definition / Scope / Limitations
3. Market Risks and Trends Assessment
3.1. Risk Assessment
3.1.1. COVID-19 Crisis and Impact on Bot Security Demand
3.1.2. COVID-19 Impact Benchmark with Previous Crisis
3.1.3. Impact on Market Value (US$ Mn)
3.1.4. Assessment by Key Countries
3.1.5. Assessment by Key Market Segments
3.1.6. Action Points and Recommendation for Suppliers
3.2. Key Trends Impacting the Market
3.3. Formulation and Product Development Trends
4. Market Background
4.1. Bot Security Market, by Key Countries
4.2. Bot Security Market Opportunity Assessment (US$ Mn)
4.2.1. Total Available Market
4.2.2. Serviceable Addressable Market
4.2.3. Serviceable Obtainable Market
4.3. Market Scenario Forecast
4.3.1. Demand in optimistic Scenario
4.3.2. Demand in Likely Scenario
4.3.3. Demand in Conservative Scenario
4.4. Investment Feasibility Analysis
4.4.1. Investment in Established Markets
4.4.1.1. In Short Term
4.4.1.2. In Long Term
4.4.2. Investment in Emerging Markets
4.4.2.1. In Short Term
4.4.2.2. In Long Term
4.5. Forecast Factors - Relevance & Impact
4.5.1. Top Companies Historical Growth
4.5.2. Growth in Automation, By Country
4.5.3. Bot Security Adoption Rate, By Country
4.6. Market Dynamics
4.6.1. Market Driving Factors and Impact Assessment
4.6.2. Prominent Market Challenges and Impact Assessment
4.6.3. Bot Security Market Opportunities
4.6.4. Prominent Trends in the Global Market & Their Impact Assessment
5. Key Success Factors
5.1. Manufacturers’ Focus on Low Penetration High Growth Markets
5.2. Banking on with Segments High Incremental Opportunity
5.3. Peer Benchmarking
6. Global Bot Security Market Demand Analysis 2015-2021 and Forecast, 2022-2032
6.1. Historical Market Analysis, 2015-2021
6.2. Current and Future Market Projections, 2022-2032
6.3. Y-o-Y Growth Trend Analysis
7. Global Bot Security Market Value Analysis 2015-2021 and Forecast, 2022-2032
7.1. Historical Market Value (US$ Mn) Analysis, 2015-2021
7.2. Current and Future Market Value (US$ Mn) Projections, 2022-2032
7.2.1. Y-o-Y Growth Trend Analysis
7.2.2. Absolute $ Opportunity Analysis
8. Global Bot Security Market Analysis 2015-2021 and Forecast 2022-2032, By Component
8.1. Introduction / Key Findings
8.2. Historical Market Value (US$ Mn) and Analysis By Component, 2015-2021
8.3. Current and Future Market Value (US$ Mn) and Analysis and Forecast By Component, 2022-2032
8.3.1. Standalone Solution
8.3.2. Services
8.3.2.1. Professional Services
8.3.2.2. Managed Services
8.4. Market Attractiveness Analysis By Component
9. Global Bot Security Market Analysis 2015-2021 and Forecast 2022-2032, By Security Type
9.1. Introduction / Key Findings
9.2. Historical Market Value (US$ Mn) and Analysis By Security Type , 2015-2021
9.3. Current and Future Market Value (US$ Mn) and Analysis and Forecast By Security Type , 2022-2032
9.3.1. Web Security
9.3.2. Mobile Security
9.3.3. API Security
9.4. Market Attractiveness Analysis By Security Type
10. Global Bot Security Market Analysis 2015-2021 and Forecast 2022-2032,By Deployment Mode
10.1. Introduction / Key Findings
10.2. Historical Market Value (US$ Mn) and AnalysisBy Deployment Mode, 2015-2021
10.3. Current and Future Market Value (US$ Mn) and Analysis and ForecastBy Deployment Mode, 2022-2032
10.3.1. Cloud
10.3.2. On-premises
10.4. Market Attractiveness AnalysisBy Deployment Mode
11. Global Bot Security Market Analysis 2015-2021 and Forecast 2022-2032,By Organization Size
11.1. Introduction / Key Findings
11.2. Historical Market Value (US$ Mn) and AnalysisBy Organization Size , 2015-2021
11.3. Current and Future Market Value (US$ Mn) and Analysis and ForecastBy Organization Size , 2022-2032
11.3.1. Large Enterprises
11.3.2. SMEs
11.4. Market Attractiveness AnalysisBy Organization Size
12. Global Bot Security Market Analysis 2015-2021 and Forecast 2022-2032, By Vertical
12.1. Introduction / Key Findings
12.2. Historical Market Value (US$ Mn) and Analysis By Vertical , 2015-2021
12.3. Current and Future Market Value (US$ Mn) and Analysis and Forecast By Vertical , 2022-2032
12.3.1. Retail and eCommerce
12.3.2. Media and Entertainment
12.3.3. Travel and Tourism
12.3.4. BFSI
12.3.5. Telecom
12.3.6. Government and Defense
12.3.7. Healthcare
12.3.8. Others (Education, IT and ITeS, Energy and Utilities)
12.4. Market Attractiveness Analysis By Vertical
13. Global Bot Security Market Analysis 2015-2021 and Forecast 2022-2032, By Region
13.1. Introduction
13.2. Historical Market Value (US$ Mn) and Analysis By Region, 2015-2021
13.3. Current Market Size (US$ Mn) & Analysis and Forecast By Region, 2022-2032
13.3.1. North America
13.3.2. Latin America
13.3.3. Europe
13.3.4. Asia Pacific
13.3.5. Middle East and Africa (MEA)
13.4. Market Attractiveness Analysis By Region
14. North America Bot Security Market Analysis 2015-2021 and Forecast 2022-2032
14.1. Introduction
14.2. Pricing Analysis
14.3. Historical Market Value (US$ Mn) and Trend Analysis By Market Taxonomy, 2015-2021
14.4. Market Value (US$ Mn) & Forecast By Market Taxonomy, 2022-2032
14.4.1. By Country
14.4.1.1. U.S.
14.4.1.2. Canada
14.4.1.3. Rest of North America
14.4.2. By Deployment Mode
14.4.3. By Component
14.4.4. By Security Type
14.4.5. By Organization Size
14.4.6. By Vertical
14.5. Market Attractiveness Analysis
14.5.1. By Country
14.5.2. By Deployment Mode
14.5.3. By Component
14.5.4. By Security Type
14.5.5. By Organization Size
14.5.6. By Vertical
15. Latin America Bot Security Market Analysis 2015-2021 and Forecast 2022-2032
15.1. Introduction
15.2. Pricing Analysis
15.3. Historical Market Value (US$ Mn) and Trend Analysis By Market Taxonomy, 2015-2021
15.4. Market Value (US$ Mn) & Forecast By Market Taxonomy, 2022-2032
15.4.1. By Country
15.4.1.1. Brazil
15.4.1.2. Mexico
15.4.1.3. Rest of Latin America
15.4.2. By Deployment Mode
15.4.3. By Component
15.4.4. By Security Type
15.4.5. By Organization Size
15.4.6. By Vertical
15.5. Market Attractiveness Analysis
15.5.1. By Country
15.5.2. By Deployment Mode
15.5.3. By Component
15.5.4. By Security Type
15.5.5. By Organization Size
15.5.6. By Vertical
16. Europe Bot Security Market Analysis 2015-2021 and Forecast 2022-2032
16.1. Introduction
16.2. Pricing Analysis
16.3. Historical Market Value (US$ Mn) and Trend Analysis By Market Taxonomy, 2015-2021
16.4. Market Value (US$ Mn) & Forecast By Market Taxonomy, 2022-2032
16.4.1. By Country
16.4.1.1. Germany
16.4.1.2. France
16.4.1.3. U.K.
16.4.1.4. Italy
16.4.1.5. Russia
16.4.1.6. Rest of Europe
16.4.2. By Deployment Mode
16.4.3. By Component
16.4.4. By Security Type
16.4.5. By Organization Size
16.4.6. By Vertical
16.5. Market Attractiveness Analysis
16.5.1. By Country
16.5.2. By Deployment Mode
16.5.3. By Component
16.5.4. By Security Type
16.5.5. By Organization Size
16.5.6. By Vertical
17. Asia Pacific Bot Security Market Analysis 2015-2021 and Forecast 2022-2032
17.1. Introduction
17.2. Pricing Analysis
17.3. Historical Market Value (US$ Mn) and Trend Analysis By Market Taxonomy, 2015-2021
17.4. Market Value (US$ Mn) & Forecast By Market Taxonomy, 2022-2032
17.4.1. By Country
17.4.1.1. China
17.4.1.2. Japan
17.4.1.3. South Korea
17.4.1.4. Rest of Asia Pacific
17.4.2. By Deployment Mode
17.4.3. By Component
17.4.4. By Security Type
17.4.5. By Organization Size
17.4.6. By Vertical
17.5. Market Attractiveness Analysis
17.5.1. By Country
17.5.2. By Deployment Mode
17.5.3. By Component
17.5.4. By Security Type
17.5.5. By Organization Size
17.5.6. By Vertical
18. Middle East and Africa Bot Security Market Analysis 2015-2021 and Forecast 2022-2032
18.1. Introduction
18.2. Pricing Analysis
18.3. Historical Market Value (US$ Mn) and Trend Analysis By Market Taxonomy, 2015-2021
18.4. Market Value (US$ Mn) & Forecast By Market Taxonomy, 2022-2032
18.4.1. By Country
18.4.1.1. GCC Countries
18.4.1.2. South Africa
18.4.1.3. Turkey
18.4.1.4. Rest of Middle East and Africa
18.4.2. By Deployment Mode
18.4.3. By Component
18.4.4. By Security Type
18.4.5. By Organization Size
18.4.6. By Vertical
18.5. Market Attractiveness Analysis
18.5.1. By Country
18.5.2. By Deployment Mode
18.5.3. By Component
18.5.4. By Security Type
18.5.5. By Organization Size
18.5.6. By Vertical
19. Key Countries Bot Security Market Analysis 2015-2021 and Forecast 2022-2032
19.1. Introduction
19.1.1. Market Value Proportion Analysis, By Key Countries
19.1.2. Global Vs. Country Growth Comparison
19.2. US Bot Security Market Analysis
19.2.1. Value Proportion Analysis by Market Taxonomy
19.2.2. Value & Analysis and Forecast by Market Taxonomy, 2015-2032
19.2.2.1. By Deployment Mode
19.2.2.2. By Component
19.2.2.3. By Security Type
19.2.2.4. By Organization Size
19.2.2.5. By Vertical
19.3. Canada Bot Security Market Analysis
19.3.1. Value Proportion Analysis by Market Taxonomy
19.3.2. Value & Analysis and Forecast by Market Taxonomy, 2015-2032
19.3.2.1. By Deployment Mode
19.3.2.2. By Component
19.3.2.3. By Security Type
19.3.2.4. By Organization Size
19.3.2.5. By Vertical
19.4. Mexico Bot Security Market Analysis
19.4.1. Value Proportion Analysis by Market Taxonomy
19.4.2. Value & Analysis and Forecast by Market Taxonomy, 2015-2032
19.4.2.1. By Deployment Mode
19.4.2.2. By Component
19.4.2.3. By Security Type
19.4.2.4. By Organization Size
19.4.2.5. By Vertical
19.5. Brazil Bot Security Market Analysis
19.5.1. Value Proportion Analysis by Market Taxonomy
19.5.2. Value & Analysis and Forecast by Market Taxonomy, 2015-2032
19.5.2.1. By Deployment Mode
19.5.2.2. By Component
19.5.2.3. By Security Type
19.5.2.4. By Organization Size
19.5.2.5. By Vertical
19.6. Germany Bot Security Market Analysis
19.6.1. Value Proportion Analysis by Market Taxonomy
19.6.2. Value & Analysis and Forecast by Market Taxonomy, 2015-2032
19.6.2.1. By Deployment Mode
19.6.2.2. By Component
19.6.2.3. By Security Type
19.6.2.4. By Organization Size
19.6.2.5. By Vertical
19.7. France Bot Security Market Analysis
19.7.1. Value Proportion Analysis by Market Taxonomy
19.7.2. Value & Analysis and Forecast by Market Taxonomy, 2015-2032
19.7.2.1. By Deployment Mode
19.7.2.2. By Component
19.7.2.3. By Security Type
19.7.2.4. By Organization Size
19.7.2.5. By Vertical
19.8. Italy Bot Security Market Analysis
19.8.1. Value Proportion Analysis by Market Taxonomy
19.8.2. Value & Analysis and Forecast by Market Taxonomy, 2015-2032
19.8.2.1. By Deployment Mode
19.8.2.2. By Component
19.8.2.3. By Security Type
19.8.2.4. By Organization Size
19.8.2.5. By Vertical
19.9. Russia Bot Security Market Analysis
19.9.1. Value Proportion Analysis by Market Taxonomy
19.9.2. Value & Analysis and Forecast by Market Taxonomy, 2015-2032
19.9.2.1. By Deployment Mode
19.9.2.2. By Component
19.9.2.3. By Security Type
19.9.2.4. By Organization Size
19.9.2.5. By Vertical
19.10. UK Bot Security Market Analysis
19.10.1. Value Proportion Analysis by Market Taxonomy
19.10.2. Value & Analysis and Forecast by Market Taxonomy, 2015-2032
19.10.2.1. By Deployment Mode
19.10.2.2. By Component
19.10.2.3. By Security Type
19.10.2.4. By Organization Size
19.10.2.5. By Vertical
19.11. China Bot Security Market Analysis
19.11.1. Value Proportion Analysis by Market Taxonomy
19.11.2. Value & Analysis and Forecast by Market Taxonomy, 2015-2032
19.11.2.1. By Deployment Mode
19.11.2.2. By Component
19.11.2.3. By Security Type
19.11.2.4. By Organization Size
19.11.2.5. By Vertical
19.12. Japan Bot Security Market Analysis
19.12.1. Value Proportion Analysis by Market Taxonomy
19.12.2. Value & Analysis and Forecast by Market Taxonomy, 2015-2032
19.12.2.1. By Deployment Mode
19.12.2.2. By Component
19.12.2.3. By Security Type
19.12.2.4. By Organization Size
19.12.2.5. By Vertical
19.13. South Korea Bot Security Market Analysis
19.13.1. Value Proportion Analysis by Market Taxonomy
19.13.2. Value & Analysis and Forecast by Market Taxonomy, 2015-2032
19.13.2.1. By Deployment Mode
19.13.2.2. By Component
19.13.2.3. By Security Type
19.13.2.4. By Organization Size
19.13.2.5. By Vertical
19.14. GCC Countries Bot Security Market Analysis
19.14.1. Value Proportion Analysis by Market Taxonomy
19.14.2. Value & Analysis and Forecast by Market Taxonomy, 2015-2032
19.14.2.1. By Deployment Mode
19.14.2.2. By Component
19.14.2.3. By Security Type
19.14.2.4. By Organization Size
19.14.2.5. By Vertical
19.15. South Africa Bot Security Market Analysis
19.15.1. Value Proportion Analysis by Market Taxonomy
19.15.2. Value & Analysis and Forecast by Market Taxonomy, 2015-2032
19.15.2.1. By Deployment Mode
19.15.2.2. By Component
19.15.2.3. By Security Type
19.15.2.4. By Organization Size
19.15.2.5. By Vertical
19.16. Turkey Bot Security Market Analysis
19.16.1. Value Proportion Analysis by Market Taxonomy
19.16.2. Value & Analysis and Forecast by Market Taxonomy, 2015-2032
19.16.2.1. By Deployment Mode
19.16.2.2. By Component
19.16.2.3. By Security Type
19.16.2.4. By Organization Size
19.16.2.5. By Vertical
19.16.3. Competition Landscape and Player Concentration in the Country
20. Market Structure Analysis
20.1. Market Analysis by Tier of Companies
20.2. Market Concentration
20.3. Market Share Analysis of Top Players
20.4. Market Presence Analysis
20.4.1. By Regional footprint of Players
20.4.2. Product footprint by Players
21. Competition Analysis
21.1. Competition Dashboard
21.2. Competition Benchmarking
21.3. Competition Deep Dive
21.3.1. Akamai Technologies
21.3.1.1. Overview
21.3.1.2. Product Portfolio
21.3.1.3. Sales Footprint
21.3.1.4. Strategy Overview
21.3.2. Imperva
21.3.2.1. Overview
21.3.2.2. Product Portfolio
21.3.2.3. Sales Footprint
21.3.2.4. Strategy Overview
21.3.3. PerimeterX
21.3.3.1. Overview
21.3.3.2. Product Portfolio
21.3.3.3. Sales Footprint
21.3.3.4. Strategy Overview
21.3.4. Cloudflare
21.3.4.1. Overview
21.3.4.2. Product Portfolio
21.3.4.3. Sales Footprint
21.3.4.4. Strategy Overview
21.3.5. Radware
21.3.5.1. Overview
21.3.5.2. Product Portfolio
21.3.5.3. Sales Footprint
21.3.5.4. Strategy Overview
21.3.6. Fastly
21.3.6.1. Overview
21.3.6.2. Product Portfolio
21.3.6.3. Sales Footprint
21.3.6.4. Strategy Overview
21.3.7. Sophos
21.3.7.1. Overview
21.3.7.2. Product Portfolio
21.3.7.3. Sales Footprint
21.3.7.4. Strategy Overview
21.3.8. Reblaze
21.3.8.1. Overview
21.3.8.2. Product Portfolio
21.3.8.3. Sales Footprint
21.3.8.4. Strategy Overview
21.3.9. Netacea
21.3.9.1. Overview
21.3.9.2. Product Portfolio
21.3.9.3. Sales Footprint
21.3.9.4. Strategy Overview
21.3.10. DataDome
21.3.10.1. Overview
21.3.10.2. Product Portfolio
21.3.10.3. Sales Footprint
21.3.10.4. Strategy Overview
22. Assumptions and Acronyms Used
23. Research Methodology
Let us know your requirement to get
100% FREE customization
Table 1: Global Bot Security Market Value (US$ Mn),By Deployment Mode, 2015 – 2021
Table 2: Global Bot Security Market Value (US$ Mn),By Deployment Mode, 2022 – 2032
Table 3: Global Bot Security Market Value (US$ Mn), By Component, 2015 – 2021
Table 4: Global Bot Security Market Value (US$ Mn), By Component, 2022 – 2032
Table 5: Global Bot Security Market Value (US$ Mn), By Security Type , 2015 – 2021
Table 6: Global Bot Security Market Value (US$ Mn), By Security Type , 2022 – 2032
Table 7: Global Bot Security Market Value (US$ Mn), By Vertical , 2015 – 2021
Table 8: Global Bot Security Market Value (US$ Mn), By Vertical , 2022 – 2032
Table 9: Global Bot Security Market Value (US$ Mn),By Organization Size , 2015 – 2021
Table 10: Global Bot Security Market Value (US$ Mn),By Organization Size , 2022 – 2032
Table 11: Global Bot Security Market, By Region, 2015 – 2021
Table 12: Global Bot Security Market, By Region, 2022 – 2032
Table 13: North America Bot Security Market Value (US$ Mn),By Deployment Mode, 2015 – 2021
Table 14: North America Bot Security Market Value (US$ Mn),By Deployment Mode, 2022 – 2032
Table 15: North America Bot Security Market Value (US$ Mn), By Component, 2015 – 2021
Table 16: North America Bot Security Market Value (US$ Mn), By Component, 2022 – 2032
Table 17: North America Bot Security Market Value (US$ Mn), By Security Type , 2015 – 2021
Table 18: North America Bot Security Market Value (US$ Mn), By Security Type , 2022 – 2032
Table 19: North America Bot Security Market Value (US$ Mn), By Vertical , 2015 – 2021
Table 20: North America Bot Security Market Value (US$ Mn), By Vertical , 2022 – 2032
Table 21: North America Bot Security Market Value (US$ Mn),By Organization Size , 2015 – 2021
Table 22: North America Bot Security Market Value (US$ Mn),By Organization Size , 2022 – 2032
Table 23: North America Bot Security Market, By Country, 2015 – 2021
Table 24: North America Bot Security Market, By Country, 2022 – 2032
Table 25: Latin America Bot Security Market Value (US$ Mn),By Deployment Mode, 2015 – 2021
Table 26: Latin America Bot Security Market Value (US$ Mn),By Deployment Mode, 2022 – 2032
Table 27: Latin America Bot Security Market Value (US$ Mn), By Component, 2015 – 2021
Table 28: Latin America Bot Security Market Value (US$ Mn), By Component, 2022 – 2032
Table 29: Latin America Bot Security Market Value (US$ Mn), By Security Type , 2015 – 2021
Table 30: Latin America Bot Security Market Value (US$ Mn), By Security Type , 2022 – 2032
Table 31: Latin America Bot Security Market Value (US$ Mn), By Vertical , 2015 – 2021
Table 32: Latin America Bot Security Market Value (US$ Mn), By Vertical , 2022 – 2032
Table 33: Latin America Bot Security Market Value (US$ Mn),By Organization Size , 2015 – 2021
Table 34: Latin America Bot Security Market Value (US$ Mn),By Organization Size , 2022 – 2032
Table 35: Latin America Bot Security Market, By Country, 2015 – 2021
Table 36: Latin America Bot Security Market, By Country, 2022 – 2032
Table 37: Europe Bot Security Market Value (US$ Mn),By Deployment Mode, 2015 – 2021
Table 38: Europe Bot Security Market Value (US$ Mn),By Deployment Mode, 2022 – 2032
Table 39: Europe Bot Security Market Value (US$ Mn), By Component, 2015 – 2021
Table 40: Europe Bot Security Market Value (US$ Mn), By Component, 2022 – 2032
Table 41: Europe Bot Security Market Value (US$ Mn), By Security Type , 2015 – 2021
Table 42: Europe Bot Security Market Value (US$ Mn), By Security Type , 2022 – 2032
Table 43: Europe Bot Security Market Value (US$ Mn), By Vertical , 2015 – 2021
Table 44: Europe Bot Security Market Value (US$ Mn), By Vertical , 2022 – 2032
Table 45: Europe Bot Security Market Value (US$ Mn),By Organization Size , 2015 – 2021
Table 46: Europe Bot Security Market Value (US$ Mn),By Organization Size , 2022 – 2032
Table 47: Europe Bot Security Market, By Country, 2015 – 2021
Table 48: Europe Bot Security Market, By Country, 2022 – 2032
Table 49: Asia Pacific Bot Security Market Value (US$ Mn),By Deployment Mode, 2015 – 2021
Table 50: Asia Pacific Bot Security Market Value (US$ Mn),By Deployment Mode, 2022 – 2032
Table 51: Asia Pacific Bot Security Market Value (US$ Mn), By Component, 2015 – 2021
Table 52: Asia Pacific Bot Security Market Value (US$ Mn), By Component, 2022 – 2032
Table 53: Asia Pacific Bot Security Market Value (US$ Mn), By Security Type , 2015 – 2021
Table 54: Asia Pacific Bot Security Market Value (US$ Mn), By Security Type , 2022 – 2032
Table 55: Asia Pacific Bot Security Market Value (US$ Mn), By Vertical , 2015 – 2021
Table 56: Asia Pacific Bot Security Market Value (US$ Mn), By Vertical , 2022 – 2032
Table 57: Asia Pacific Bot Security Market Value (US$ Mn),By Organization Size , 2015 – 2021
Table 58: Asia Pacific Bot Security Market Value (US$ Mn),By Organization Size , 2022 – 2032
Table 59: Asia Pacific Bot Security Market, By Country, 2015 – 2021
Table 60: Asia Pacific Bot Security Market, By Country, 2022 – 2032
Table 61: MEA Bot Security Market Value (US$ Mn),By Deployment Mode, 2015 – 2021
Table 62: MEA Bot Security Market Value (US$ Mn),By Deployment Mode, 2022 – 2032
Table 63: MEA Bot Security Market Value (US$ Mn), By Component, 2015 – 2021
Table 64: MEA Bot Security Market Value (US$ Mn), By Component, 2022 – 2032
Table 65: MEA Bot Security Market Value (US$ Mn), By Security Type , 2015 – 2021
Table 66: MEA Bot Security Market Value (US$ Mn), By Security Type , 2022 – 2032
Table 67: MEA Bot Security Market Value (US$ Mn), By Vertical , 2015 – 2021
Table 68: MEA Bot Security Market Value (US$ Mn), By Vertical , 2022 – 2032
Table 69: MEA Bot Security Market Value (US$ Mn),By Organization Size , 2015 – 2021
Table 70: MEA Bot Security Market Value (US$ Mn),By Organization Size , 2022 – 2032
Table 71: MEA Bot Security Market, By Country, 2015 – 2021
Table 72: MEA Bot Security Market, By Country, 2022 – 2032
Find your sweet spots for generating winning opportunities in this market.
Talk to AnalystFigure 1: Global Bot Security Market Value (US$ Mn) and Year-on-Year Growth, 2015-2032
Figure 2: Global Bot Security Market Absolute $ Historical Gain (2015 - 2021) and Opportunity (2022 – 2032), US$ Mn
Figure 3: Global Bot Security Market Share,By Deployment Mode, 2022 & 2032
Figure 4: Global Bot Security Market Y-o-Y Growth Projections,By Deployment Mode – 2022-2032
Figure 5: Global Bot Security Market Attractiveness Index,By Deployment Mode – 2022-2032
Figure 6: Global Bot Security Market Share, By Component, 2022 & 2032
Figure 7: Global Bot Security Market Y-o-Y Growth Projections, By Component – 2022-2032
Figure 8: Global Bot Security Market Attractiveness Index, By Component – 2022-2032
Figure 9: Global Bot Security Market Share, By Vertical , 2022 & 2032
Figure 10: Global Bot Security Market Y-o-Y Growth Projections, By Vertical – 2022-2032
Figure 11: Global Bot Security Market Attractiveness Index, By Vertical – 2022-2032
Figure 12: Global Bot Security Market Share, By Security Type , 2022 & 2032
Figure 13: Global Bot Security Market Y-o-Y Growth Projections, By Security Type – 2022-2032
Figure 14: Global Bot Security Market Attractiveness Index, By Security Type – 2022-2032
Figure 15: Global Bot Security Market Share,By Organization Size , 2022 & 2032
Figure 16: Global Bot Security Market Y-o-Y Growth Projections,By Organization Size – 2022-2032
Figure 17: Global Bot Security Market Attractiveness Index,By Organization Size – 2022-2032
Figure 18: Global Bot Security Market Share, By Region, 2022 & 2032
Figure 19: Global Bot Security Market Y-o-Y Growth Projections, By Region – 2022-2032
Figure 20: Global Bot Security Market Attractiveness Index, By Region – 2022-2032
Figure 21: North America Bot Security Market Value (US$ Mn) and Year-on-Year Growth, 2015-2032
Figure 22: North America Bot Security Market Absolute $ Historical Gain (2015 - 2021) and Opportunity (2022 – 2032), US$ Mn
Figure 23: North America Bot Security Market Share,By Deployment Mode, 2022 & 2032
Figure 24: North America Bot Security Market Y-o-Y Growth Projections,By Deployment Mode – 2022-2032
Figure 25: North America Bot Security Market Attractiveness Index,By Deployment Mode – 2022-2032
Figure 26: North America Bot Security Market Share, By Component, 2022 & 2032
Figure 27: North America Bot Security Market Y-o-Y Growth Projections, By Component – 2022-2032
Figure 28: North America Bot Security Market Attractiveness Index, By Component – 2022-2032
Figure 29: North America Bot Security Market Share, By Vertical , 2022 & 2032
Figure 30: North America Bot Security Market Y-o-Y Growth Projections, By Vertical – 2022-2032
Figure 31: North America Bot Security Market Attractiveness Index, By Vertical – 2022-2032
Figure 32: North America Bot Security Market Share, By Security Type , 2022 & 2032
Figure 33: North America Bot Security Market Y-o-Y Growth Projections, By Security Type – 2022-2032
Figure 34: North America Bot Security Market Attractiveness Index, By Security Type – 2022-2032
Figure 35: North America Bot Security Market Share,By Organization Size , 2022 & 2032
Figure 36: North America Bot Security Market Y-o-Y Growth Projections,By Organization Size – 2022-2032
Figure 37: North America Bot Security Market Attractiveness Index,By Organization Size – 2022-2032
Figure 38: North America Bot Security Market Share, By Country, 2022 & 2032
Figure 39: North America Bot Security Market Y-o-Y Growth Projections, By Country – 2022-2032
Figure 40: North America Bot Security Market Attractiveness Index, By Country – 2022-2032
Figure 41: Latin America Bot Security Market Value (US$ Mn) and Year-on-Year Growth, 2015-2032
Figure 42: Latin America Bot Security Market Absolute $ Historical Gain (2015 - 2021) and Opportunity (2022 – 2032), US$ Mn
Figure 43: Latin America Bot Security Market Share,By Deployment Mode, 2022 & 2032
Figure 44: Latin America Bot Security Market Y-o-Y Growth Projections,By Deployment Mode – 2022-2032
Figure 45: Latin America Bot Security Market Attractiveness Index,By Deployment Mode – 2022-2032
Figure 46: Latin America Bot Security Market Share, By Component, 2022 & 2032
Figure 47: Latin America Bot Security Market Y-o-Y Growth Projections, By Component – 2022-2032
Figure 48: Latin America Bot Security Market Attractiveness Index, By Component – 2022-2032
Figure 49: Latin America Bot Security Market Share, By Vertical , 2022 & 2032
Figure 50: Latin America Bot Security Market Y-o-Y Growth Projections, By Vertical – 2022-2032
Figure 51: Latin America Bot Security Market Attractiveness Index, By Vertical – 2022-2032
Figure 52: Latin America Bot Security Market Share, By Security Type , 2022 & 2032
Figure 53: Latin America Bot Security Market Y-o-Y Growth Projections, By Security Type – 2022-2032
Figure 54: Latin America Bot Security Market Attractiveness Index, By Security Type – 2022-2032
Figure 55: Latin America Bot Security Market Share,By Organization Size , 2022 & 2032
Figure 56: Latin America Bot Security Market Y-o-Y Growth Projections,By Organization Size – 2022-2032
Figure 57: Latin America Bot Security Market Attractiveness Index,By Organization Size – 2022-2032
Figure 58: Latin America Bot Security Market Share, By Country, 2022 & 2032
Figure 59: Latin America Bot Security Market Y-o-Y Growth Projections, By Country – 2022-2032
Figure 60: Latin America Bot Security Market Attractiveness Index, By Country – 2022-2032
Figure 61: Europe Bot Security Market Value (US$ Mn) and Year-on-Year Growth, 2015-2032
Figure 62: Europe Bot Security Market Absolute $ Historical Gain (2015 - 2021) and Opportunity (2022 – 2032), US$ Mn
Figure 63: Europe Bot Security Market Share,By Deployment Mode, 2022 & 2032
Figure 64: Europe Bot Security Market Y-o-Y Growth Projections,By Deployment Mode – 2022-2032
Figure 65: Europe Bot Security Market Attractiveness Index,By Deployment Mode – 2022-2032
Figure 66: Europe Bot Security Market Share, By Component, 2022 & 2032
Figure 67: Europe Bot Security Market Y-o-Y Growth Projections, By Component – 2022-2032
Figure 68: Europe Bot Security Market Attractiveness Index, By Component – 2022-2032
Figure 69: Europe Bot Security Market Share, By Vertical , 2022 & 2032
Figure 70: Europe Bot Security Market Y-o-Y Growth Projections, By Vertical – 2022-2032
Figure 71: Europe Bot Security Market Attractiveness Index, By Vertical – 2022-2032
Figure 72: Europe Bot Security Market Share, By Security Type , 2022 & 2032
Figure 73: Europe Bot Security Market Y-o-Y Growth Projections, By Security Type – 2022-2032
Figure 74: Europe Bot Security Market Attractiveness Index, By Security Type – 2022-2032
Figure 75: Europe Bot Security Market Share,By Organization Size , 2022 & 2032
Figure 76: Europe Bot Security Market Y-o-Y Growth Projections,By Organization Size – 2022-2032
Figure 77: Europe Bot Security Market Attractiveness Index,By Organization Size – 2022-2032
Figure 78: Europe Bot Security Market Share, By Country, 2022 & 2032
Figure 79: Europe Bot Security Market Y-o-Y Growth Projections, By Country – 2022-2032
Figure 80: Europe Bot Security Market Attractiveness Index, By Country – 2022-2032
Figure 81: Asia Pacific Bot Security Market Value (US$ Mn) and Year-on-Year Growth, 2015-2032
Figure 82: Asia Pacific Bot Security Market Absolute $ Historical Gain (2015 - 2021) and Opportunity (2022 – 2032), US$ Mn
Figure 83: Asia Pacific Bot Security Market Share,By Deployment Mode, 2022 & 2032
Figure 84: Asia Pacific Bot Security Market Y-o-Y Growth Projections,By Deployment Mode – 2022-2032
Figure 85: Asia Pacific Bot Security Market Attractiveness Index,By Deployment Mode – 2022-2032
Figure 86: Asia Pacific Bot Security Market Share, By Component, 2022 & 2032
Figure 87: Asia Pacific Bot Security Market Y-o-Y Growth Projections, By Component – 2022-2032
Figure 88: Asia Pacific Bot Security Market Attractiveness Index, By Component – 2022-2032
Figure 89: Asia Pacific Bot Security Market Share, By Vertical , 2022 & 2032
Figure 90: Asia Pacific Bot Security Market Y-o-Y Growth Projections, By Vertical – 2022-2032
Figure 91: Asia Pacific Bot Security Market Attractiveness Index, By Vertical – 2022-2032
Figure 92: Asia Pacific Bot Security Market Share, By Security Type , 2022 & 2032
Figure 93: Asia Pacific Bot Security Market Y-o-Y Growth Projections, By Security Type – 2022-2032
Figure 94: Asia Pacific Bot Security Market Attractiveness Index, By Security Type – 2022-2032
Figure 95: Asia Pacific Bot Security Market Share,By Organization Size , 2022 & 2032
Figure 96: Asia Pacific Bot Security Market Y-o-Y Growth Projections,By Organization Size – 2022-2032
Figure 97: Asia Pacific Bot Security Market Attractiveness Index,By Organization Size – 2022-2032
Figure 98: Asia Pacific Bot Security Market Share, By Country, 2022 & 2032
Figure 99: Asia Pacific Bot Security Market Y-o-Y Growth Projections, By Country – 2022-2032
Figure 100: Asia Pacific Bot Security Market Attractiveness Index, By Country – 2022-2032
Figure 101: MEA Bot Security Market Value (US$ Mn) and Year-on-Year Growth, 2015-2032
Figure 102: MEA Bot Security Market Absolute $ Historical Gain (2015 - 2021) and Opportunity (2022 – 2032), US$ Mn
Figure 103: MEA Bot Security Market Share,By Deployment Mode, 2022 & 2032
Figure 104: MEA Bot Security Market Y-o-Y Growth Projections,By Deployment Mode – 2022-2032
Figure 105: MEA Bot Security Market Attractiveness Index,By Deployment Mode – 2022-2032
Figure 106: MEA Bot Security Market Share, By Component, 2022 & 2032
Figure 107: MEA Bot Security Market Y-o-Y Growth Projections, By Component – 2022-2032
Figure 108: MEA Bot Security Market Attractiveness Index, By Component – 2022-2032
Figure 109: MEA Bot Security Market Share, By Vertical , 2022 & 2032
Figure 110: MEA Bot Security Market Y-o-Y Growth Projections, By Vertical – 2022-2032
Figure 111: MEA Bot Security Market Attractiveness Index, By Vertical – 2022-2032
Figure 112: MEA Bot Security Market Share, By Security Type , 2022 & 2032
Figure 113: MEA Bot Security Market Y-o-Y Growth Projections, By Security Type – 2022-2032
Figure 114: MEA Bot Security Market Attractiveness Index, By Security Type – 2022-2032
Figure 115: MEA Bot Security Market Share,By Organization Size , 2022 & 2032
Figure 116: MEA Bot Security Market Y-o-Y Growth Projections,By Organization Size – 2022-2032
Figure 117: MEA Bot Security Market Attractiveness Index,By Organization Size – 2022-2032
Figure 118: MEA Bot Security Market Share, By Country, 2022 & 2032
Figure 119: MEA Bot Security Market Y-o-Y Growth Projections, By Country – 2022-2032
Figure 120: MEA Bot Security Market Attractiveness Index, By Country – 2022-2032
Need specific information?
Request CustomizationExplore Technology Insights
View Reports