Brominated Vegetable Oil Market Size and Share Forecast Outlook 2025 to 2035

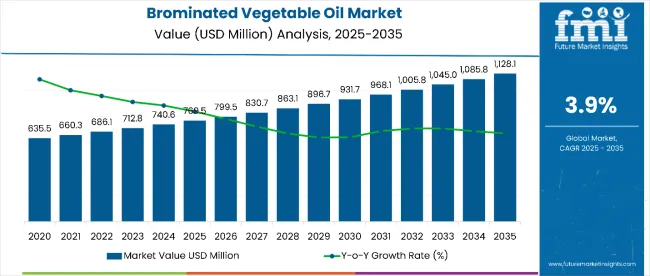
The brominated vegetable oil market is estimated to be valued at USD 769.5 million in 2025. It is projected to reach USD 1,128.1 million by 2035, registering a compound annual growth rate (CAGR) of 3.9% over the forecast period. The brominated vegetable oil market is projected to add an absolute dollar opportunity of USD 358.6 million over the forecast period.
Quick Stats for Brominated Vegetable Oil Market

  • Brominated Vegetable Oil Market Value (2025): USD 769.5 million
  • Brominated Vegetable Oil Market Forecast Value (2035): USD 1,128.1 million
  • Brominated Vegetable Oil Market Forecast CAGR: 3.9%
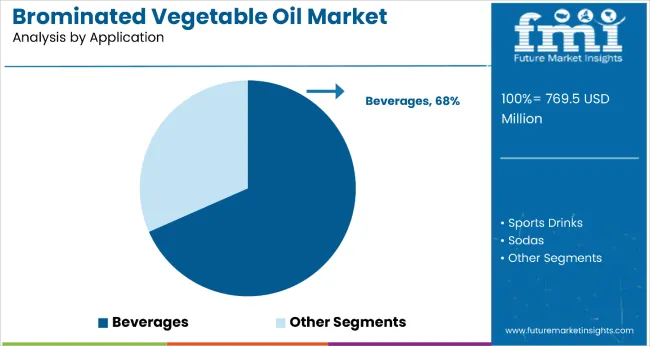
  • Leading Segment in Brominated Vegetable Oil Market in 2025: Beverages (68% market share)
  • Key Growth Regions in Brominated Vegetable Oil Market: North America, Europe and Asia-Pacific
  • Top Key Players in Brominated Vegetable Oil Market: Synutra International, Kraft Foods Group, Inc., Kerry Ingredients & Flavours, Abitec Corporation, Watson Inc., Advanced Food Systems Inc., Aarhuskarlshamn AB, Firmenich SA, BASF Company, Eurobio Lab, The Good Scents Company, DeWolf Chemical, COSME ITALY

Brominated Vegetable Oil Market

Metric Value
Estimated Value in (2025E) USD 769.5 million
Forecast Value in (2035F) USD 1,128.1 million
Forecast CAGR (2025 to 2035) 3.9%

This reflects a 1.39 times growth at a compound annual growth rate of 3.9%. The market’s evolution is expected to be shaped by regional regulatory divergence, with declining usage in Western markets offset by continued demand in permissible jurisdictions and growing adoption of alternative emulsifiers in reformulated beverage products.

By 2030, the market is likely to reach approximately USD 931.7 million, accounting for USD 162.2 million in incremental value over the first half of the decade. The remaining USD 102.7 million is expected during the second half, suggesting a moderately back-loaded growth pattern. Product reformulation initiatives across major beverage manufacturers are gaining traction due to regulatory restrictions in key markets, with companies transitioning to sucrose acetate isobutyrate (SAIB) and glycerol ester of wood rosin as preferred alternatives.

Companies such as Spectrum Chemical Manufacturing Corp. and Parchem Fine & Specialty Chemicals are advancing their competitive positions through regulatory compliance expertise and alternative ingredient portfolios. Market performance is expected to remain anchored in regional regulatory landscapes, supply chain adaptability, and technological innovation in emulsifier alternatives. The industry faces structural transformation as major markets impose restrictions while emerging economies maintain permissible usage frameworks.

The brominated vegetable oil market holds approximately 12% of the global beverage emulsifier market, driven by its specific density-matching properties for citrus-flavored beverages and cost-effective stabilization capabilities. It accounts for around 8% of the food additive market in permissible jurisdictions, supported by established manufacturing processes and supply chain infrastructure.

The market contributes nearly 15% to the specialty chemical additives market, particularly for applications requiring precise density control and emulsion stability. It holds close to 6% of the beverage stabilizer ingredients market, where regulatory compliance and formulation expertise determine market access. The share in the functional food ingredients market reaches about 4%, reflecting its niche application profile and regulatory constraints.

The market is undergoing a structural transformation driven by regulatory restrictions in major economies and the accelerating adoption of alternative emulsifiers. The FDA’s revocation of BVO authorization in the United States, effective August 2024, has catalyzed reformulation initiatives across global beverage manufacturers.

Companies are investing in sucrose acetate isobutyrate (SAIB), glycerol ester of wood rosin, and natural emulsifier alternatives to maintain product consistency while meeting evolving regulatory requirements. Strategic partnerships between beverage companies and specialty chemical suppliers have accelerated the development and commercialization of BVO alternatives.

Regional market dynamics now favor jurisdictions with permissible regulatory frameworks, reshaping global supply chains and creating opportunities for compliant alternative ingredients.

Analyzing Brominated Vegetable Oil Market by Top Investment Segments

The market is segmented by application, source, distribution channel, and region. By application, it includes beverages, sports drinks, sodas, bakery products, pesticides, and flame retardants. Based on the source, the market is bifurcated into soy and corn. By distribution channel, it is segmented into online and offline. Regionally, the market is analyzed across North America, Latin America, Asia Pacific, Eastern Europe, Western Europe and Japan.
By Application, Beverages Account for 68% of the Market Share

Brominated Vegetable Oil Market Analysis By Application

The beverages segment holds a commanding 68% share in the application category, reflecting BVO’s primary function as a citrus beverage emulsifier and the ingredient’s historical association with soft drink formulations. Beverage applications are increasingly concentrated in markets where BVO remains regulatory compliant, particularly in Asia-Pacific and Latin American jurisdictions.

The segment benefits from continued demand for citrus-flavored carbonated beverages, sports drinks, and fruit-flavored products where density matching and emulsion stability are critical performance requirements. Regional variations in regulatory acceptance create distinct market dynamics, with compliant markets experiencing sustained demand while restricted jurisdictions accelerate reformulation initiatives.

Manufacturers are focusing on optimizing BVO formulations for specific beverage applications while simultaneously developing alternative emulsifier portfolios to serve both compliant and restricted markets. As regulatory landscapes continue evolving and consumer preferences shift toward natural ingredients, the beverages segment’s growth will depend increasingly on regional compliance strategies and alternative ingredient adoption rates.
By Distribution Channel, Offline Accounts for 65.0% of the Market Share

Brominated Vegetable Oil Market Analysis By Distribution Channel

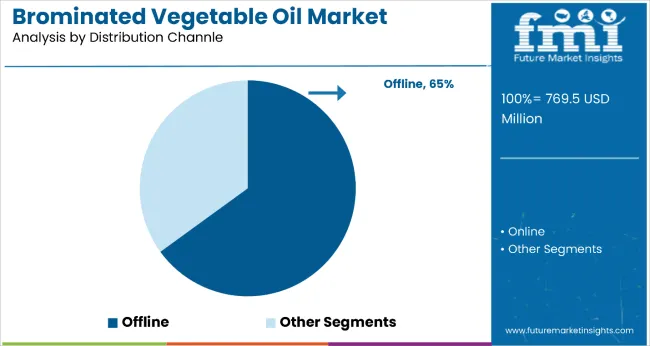
The offline segment dominates the distribution channel category with a 65.0% share in the global brominated vegetable oil (BVO) market, reflecting the ingredient’s predominant usage in industrial and institutional supply chains. Major beverage manufacturers and food processors continue to rely heavily on established offline procurement networks, including direct supplier relationships, bulk ingredient distributors, and specialized chemical agents.

Offline distribution offers logistical advantages such as streamlined inventory management, quality assurance protocols, and regulatory documentation handling, particularly important for an ingredient like BVO that faces varied regional compliance frameworks.

This segment benefits from longstanding supplier-buyer contracts and the preference among industrial users for in-person quality checks, controlled storage environments, and reliable delivery timelines. Furthermore, regulatory scrutiny and documentation requirements often make offline channels more favorable for transactions involving food-grade emulsifiers like BVO. While online distribution is expanding, particularly for small-scale R&D labs and regional food manufacturers, the bulk of BVO sales remains concentrated in offline networks.

As global supply chains stabilize post-pandemic and major food and beverage producers prioritize traceability and compliance, offline distribution is expected to retain its dominant role. Growth in this channel will be reinforced by investments in cold-chain logistics and partnerships between chemical suppliers and multinational beverage companies.

Why is the Brominated Vegetable Oil Market Growing?

The brominated vegetable oil market's growth trajectory reflects complex regulatory dynamics and regional market variations, with declining usage in restricted jurisdictions offset by continued demand in permissible markets and emerging economies where cost-effective emulsification solutions remain valued.

Regional regulatory divergence is driving market segmentation, with Asia-Pacific, Latin America, and select Middle Eastern markets maintaining permissible usage frameworks while Western economies impose restrictions. Growing beverage consumption in emerging markets, particularly citrus-flavored soft drinks and sports beverages, continues to support demand in compliant jurisdictions.

Market evolution is also supported by the transition period for reformulation initiatives, where manufacturers in restricted markets are investing in alternative emulsifier technologies while maintaining existing operations in permissible regions. As global beverage companies adapt their formulation strategies and regulatory landscapes continue evolving, the market is positioned for measured growth concentrated in compliant jurisdictions and alternative ingredient segments.

What are the Drivers, Restraints, and Key Trends of the Brominated Vegetable Oil Market?

From 2025 to 2035, regulatory compliance and alternative ingredient development are expected to remain central to market evolution, with companies investing in reformulation technologies and regional market strategies. The FDA’s BVO prohibition in the United States has catalyzed global reassessment of ingredient portfolios, while emerging markets maintain demand for cost-effective emulsification solutions.

Regional Regulatory Divergence Creates Market Segmentation

The fragmented global regulatory landscape for brominated vegetable oil has been identified as the primary factor shaping market dynamics. Following the FDA’s August 2024 prohibition in the United States and existing restrictions in Europe, Japan, and India, market demand has concentrated in Asia-Pacific, Latin America, and select Middle Eastern jurisdictions where BVO remains permissible.

This regulatory divergence has created distinct market segments, with compliant regions experiencing sustained demand while restricted markets accelerate reformulation initiatives. Companies operating globally are adopting dual-strategy approaches, maintaining BVO operations in permissible markets while investing in alternative ingredient technologies for restricted jurisdictions.

Alternative Emulsifier Innovation Drives Market Transformation

In 2024, beverage manufacturers began large-scale adoption of sucrose acetate isobutyrate (SAIB) and glycerol ester of wood rosin as BVO alternatives, supported by improved formulation technologies and supply chain development. By 2025, advanced emulsifier systems are being deployed to replicate BVO’s density-matching properties while meeting clean-label consumer preferences.

These developments demonstrate that alternative ingredient innovation can maintain product performance while addressing regulatory and consumer requirements. Manufacturers offering comprehensive emulsifier portfolios, including both traditional BVO and advanced alternatives, are positioned to serve diverse regional requirements and support global brand consistency across varying regulatory environments.
Analysis of the Brominated Vegetable Oil Market by Key Countries

Brominated Vegetable Oil Market Country Wise Analysis

Country CAGR
USA 4.2%
Germany 3.9%
France 3.7%
UK 3.6%
Japan 3.2%

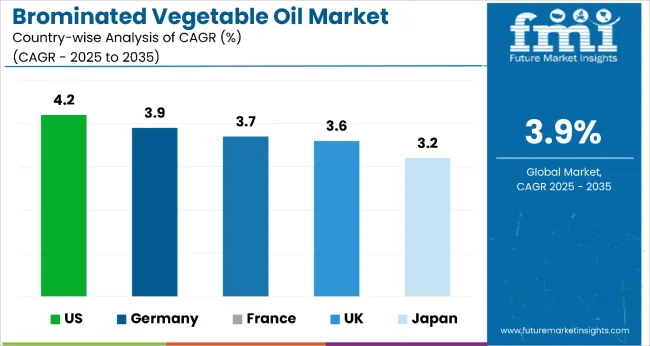
Among the key countries analyzed in the brominated vegetable oil (BVO) market, the USA leads with a projected CAGR of 4.2% from 2025 to 2035, driven by transitional regulatory allowances and robust innovation in alternative ingredients. Germany and France follow with growth rates of 3.9% and 3.7%, respectively, constrained by EU clean-label preferences and limited synthetic emulsifier tolerance.

The UK is expected to grow at a 3.6% CAGR, reflecting minimal BVO use amid regulatory caution and reformulation trends. In contrast, Japan remains at zero BVO market growth due to a complete ban, contributing solely to the alternative emulsifier segment.

The report covers an in-depth analysis of 40+ countries; five top-performing OECD countries are highlighted below.

Market Outlook for Brominated Vegetable Oil in the United Kingdom

The demand for brominated vegetable oil in the UK is projected to strengthen at a 3.6% CAGR from 2025 to 2035, reflecting cautious adoption amid increasing regulatory and consumer scrutiny. BVO usage remains legal but minimal, as food manufacturers preemptively reformulate beverages to align with clean-label trends and broader EU food safety expectations.

Major retailers discourage the use of BVO in their private-label products, accelerating the switch to alternatives like SAIB and glycerol esters. Beverage reformulation efforts, coupled with public health advocacy campaigns, continue to suppress demand. Most BVO applications are limited to legacy or imported products with declining shelf presence.

  • Regulatory alignment with EU food safety guidelines restricts BVO innovation
  • Clean-label preferences discourage use of synthetic emulsifiers
  • Reformulation efforts by leading beverage brands limit future BVO adoption

Alternative Ingredient Market Shift in the United States

The brominated vegetable oil market in the USA is projected to grow at a 4.2% CAGR from 2025 to 2035, supported by strong demand in legacy products and ongoing use in specific beverage categories where BVO remains permitted during regulatory transitions. While the FDA issued a proposed ban in 2024, certain product lines continue to utilize BVO under transitional compliance timelines.

Beverage manufacturers are actively reformulating citrus sodas, sports drinks, and fruit punches, balancing short-term market continuity with long-term adoption of alternatives like SAIB and glycerol ester of wood rosin. Parallel investments in R&D and alternative emulsifier innovation bolster market adaptability.

  • Reformulation activity accelerates due to shifting regulatory guidance
  • BVO continues in select formulations under transitional allowances
  • Alternative emulsifier development ensures long-term compliance and innovation

Growth Analysis of Brominated Vegetable Oil Market in Germany

Revenue from BVO in Germany is anticipated to expand at a 3.9% CAGR between 2025 and 2035, in line with broader EU regulatory constraints and low consumer tolerance for synthetic emulsifiers. Although BVO is not outright banned under EU regulations, its use remains rare due to precautionary food safety measures and a strong clean-label movement.

German beverage manufacturers predominantly use alternative emulsifiers in citrus and energy drink formulations, reducing reliance on BVO. Market growth is mainly limited to niche or imported products that still use BVO. Public health awareness, transparency laws, and green packaging initiatives further restrict BVO’s commercial viability in Germany.

  • Minimal adoption of BVO due to EU precautionary standards
  • Clean-label regulations encourage reformulated citrus beverage formulations
  • Most beverage companies have shifted to plant-based or esterified alternatives

Growth Outlook of Brominated Vegetable Oil in France

The sales of brominated vegetable oil in France are projected to flourish at a 3.7% CAGR from 2025 to 2035, reflecting a restrained regulatory stance and strong consumer preference for natural ingredients. While BVO remains technically permitted in limited applications, most beverage brands avoid its use to align with market expectations and avoid reputational risk.

French food processors increasingly favor glycerol ester systems or SAIB in citrus-flavored drinks and bakery emulsions. Clean-label and organic product trends further limit synthetic emulsifier demand. The BVO market in France is primarily concentrated in older product lines, with limited new product development featuring the additive.

  • Stringent clean-label standards discourage synthetic emulsifiers
  • Glycerol ester and SAIB dominate as reformulation alternatives
  • BVO’s usage remains confined to legacy products in niche markets

Japan Brominated Vegetable Oil Market Analysis by Application

Japan has maintained a complete ban on BVO since 2010, positioning it firmly within the global alternative emulsifier segment. In 2025, Japan is expected to contribute approximately USD 8.2 million to the BVO alternative market, primarily in beverages, which account for 71.3% of this total. Japanese beverage manufacturers widely employ SAIB and glycerol ester technologies to replace BVO in citrus-based drinks.

Regulatory stringency and a strong innovation ecosystem have facilitated the shift to safer, functionally equivalent emulsifiers. Bakery and other food applications also leverage natural alternatives, reflecting Japan’s comprehensive ingredient safety culture and consumer preference for additive-free foods.
  • Regulatory ban on BVO since 2010 ensures complete market withdrawal
  • SAIB and glycerol esters dominate beverage formulations
  • Food manufacturers adopt alternative emulsifiers across bakery and processed foods

Competitive Landscape of the Brominated Vegetable Oil Market

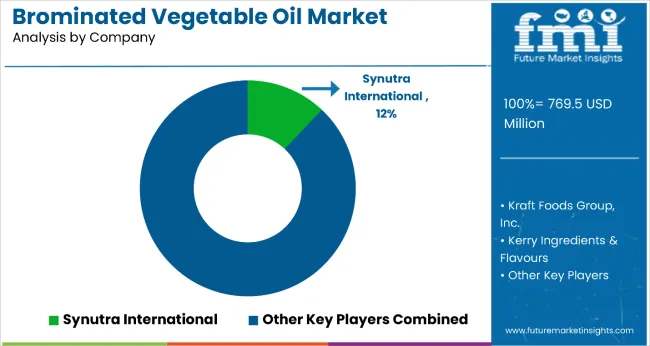
Brominated Vegetable Oil Market Analysis By Company

The market is moderately consolidated, with Spectrum Chemical Manufacturing Corp. leading at an estimated 18.5% market share. The company holds a dominant position through its diversified specialty chemical portfolio, regulatory compliance expertise, and established relationships with beverage manufacturers requiring emulsifier solutions.

Key players include Parchem Fine & Specialty Chemicals, Penta Manufacturing Company, Synutra International, Kerry Ingredients & Flavours, Abitec Corporation, Watson Inc., Advanced Food Systems Inc., Aarhuskarlshamn AB, and BASF Company, each providing specialized emulsifier solutions, including both traditional BVO for compliant markets and alternative ingredients for restricted jurisdictions, supported by regulatory expertise and formulation support services.

Market demand is driven by regional regulatory variations, beverage industry reformulation requirements, and the growing need for comprehensive emulsifier portfolios that serve both compliant and restricted markets while maintaining product performance standards across diverse applications.

Scope of the Report

Item Value
Quantitative Units USD 769.5 Million
Application Beverages, Sports Drinks, Sodas, Bakery Products, Pesticides, Flame Retardant
Distribution Channel Online and Offline
Source Soy-based and Corn-based
Regions Covered North America, Latin America, Asia Pacific, Eastern Europe, Western Europe and Japan
Country Covered United States, Canada, United Kingdom, Germany, France, China, Japan, South Korea, Brazil, Australia, and 40+ countries
Key Companies Profiled Synutra International, Kraft Foods Group, Inc., Kerry Ingredients & Flavours, Abitec Corporation, Watson Inc., Advanced Food Systems Inc., Aarhuskarlshamn AB, Firmenich SA, BASF Company, Eurobio Lab, The Good Scents Company, DeWolf Chemical, COSME ITALY
Additional Attributes Dollar sales by application and end-use sector, regional regulatory compliance analysis, alternative ingredient adoption trends, reformulation technology developments, market transition dynamics from traditional BVO to approved alternatives, innovation in emulsifier systems and supply chain adaptation strategies

Key Segments

By Source:

  • Soy
  • Corn

By Application:

  • Beverages
  • Sports Drinks
  • Sodas
  • Baker Products
  • Pesticides
  • Flame Retardant

By Distribution Channel:

  • Online
  • Offline

By Region:

  • North America
  • Latin America
  • Western Europe
  • Eastern Europe
  • East Asia
  • South Asia & Pacific
  • Middle East and Africa

Table of Content

  1. Executive Summary
    • Global Market Outlook
    • Demand-side Trends
    • Supply-side Trends
    • Technology Roadmap Analysis
    • Analysis and Recommendations
  2. Market Overview
    • Market Coverage / Taxonomy
    • Market Definition / Scope / Limitations
  3. Market Background
    • Market Dynamics
      • Drivers
      • Restraints
      • Opportunity
      • Trends
    • Scenario Forecast
      • Demand in Optimistic Scenario
      • Demand in Likely Scenario
      • Demand in Conservative Scenario
    • Opportunity Map Analysis
    • Product Life Cycle Analysis
    • Supply Chain Analysis
      • Supply Side Participants and their Roles
        • Producers
        • Mid-Level Participants (Traders/ Agents/ Brokers)
        • Wholesalers and Distributors
      • Value Added and Value Created at Node in the Supply Chain
      • List of Raw Material Suppliers
      • List of Existing and Potential Buyer’s
    • Investment Feasibility Matrix
    • Value Chain Analysis
      • Profit Margin Analysis
      • Wholesalers and Distributors
      • Retailers
    • PESTLE and Porter’s Analysis
    • Regulatory Landscape
      • By Key Regions
      • By Key Countries
    • Regional Parent Market Outlook
    • Production and Consumption Statistics
    • Import and Export Statistics
  4. Global Market Analysis 2020 to 2024 and Forecast, 2025 to 2035
    • Historical Market Size Value (USD Million) & Volume (Liters) Analysis, 2020 to 2024
    • Current and Future Market Size Value (USD Million) & Volume (Liters) Projections, 2025 to 2035
      • Y-o-Y Growth Trend Analysis
      • Absolute $ Opportunity Analysis
  5. Global Market Pricing Analysis 2020 to 2024 and Forecast 2025 to 2035
  6. Global Market Analysis 2020 to 2024 and Forecast 2025 to 2035, By Source
    • Introduction / Key Findings
    • Historical Market Size Value (USD Million) & Volume (Liters) Analysis By Source, 2020 to 2024
    • Current and Future Market Size Value (USD Million) & Volume (Liters) Analysis and Forecast By Source, 2025 to 2035
      • Soy
      • Corn
    • Y-o-Y Growth Trend Analysis By Source, 2020 to 2024
    • Absolute $ Opportunity Analysis By Source, 2025 to 2035
  7. Global Market Analysis 2020 to 2024 and Forecast 2025 to 2035, By Application
    • Introduction / Key Findings
    • Historical Market Size Value (USD Million) & Volume (Liters) Analysis By Application, 2020 to 2024
    • Current and Future Market Size Value (USD Million) & Volume (Liters) Analysis and Forecast By Application, 2025 to 2035
      • Beverages
      • Sports Drinks
      • Sodas
      • Baker Products
      • Pesticides
      • Flame Retardant
    • Y-o-Y Growth Trend Analysis By Application, 2020 to 2024
    • Absolute $ Opportunity Analysis By Application, 2025 to 2035
  8. Global Market Analysis 2020 to 2024 and Forecast 2025 to 2035, By Distribution Channel
    • Introduction / Key Findings
    • Historical Market Size Value (USD Million) & Volume (Liters) Analysis By Distribution Channel, 2020 to 2024
    • Current and Future Market Size Value (USD Million) & Volume (Liters) Analysis and Forecast By Distribution Channel, 2025 to 2035
      • Online
      • Offline
    • Y-o-Y Growth Trend Analysis By Distribution Channel, 2020 to 2024
    • Absolute $ Opportunity Analysis By Distribution Channel, 2025 to 2035
  9. Global Market Analysis 2020 to 2024 and Forecast 2025 to 2035, By Region
    • Introduction
    • Historical Market Size Value (USD Million) & Volume (Liters) Analysis By Region, 2020 to 2024
    • Current Market Size Value (USD Million) & Volume (Liters) Analysis and Forecast By Region, 2025 to 2035
      • North America
      • Latin America
      • Western Europe
      • Eastern Europe
      • East Asia
      • South Asia & Pacific
      • Middle East and Africa
    • Market Attractiveness Analysis By Region
  10. North America Market Analysis 2020 to 2024 and Forecast 2025 to 2035, By Country
    • Historical Market Size Value (USD Million) & Volume (Liters) Trend Analysis By Market Taxonomy, 2020 to 2024
    • Market Size Value (USD Million) & Volume (Liters) Forecast By Market Taxonomy, 2025 to 2035
      • By Country
        • USA
        • Canada
        • Mexico
      • By Source
      • By Application
      • By Distribution Channel
    • Market Attractiveness Analysis
      • By Country
      • By Source
      • By Application
      • By Distribution Channel
    • Key Takeaways
  11. Latin America Market Analysis 2020 to 2024 and Forecast 2025 to 2035, By Country
    • Historical Market Size Value (USD Million) & Volume (Liters) Trend Analysis By Market Taxonomy, 2020 to 2024
    • Market Size Value (USD Million) & Volume (Liters) Forecast By Market Taxonomy, 2025 to 2035
      • By Country
        • Brazil
        • Argentina
        • Rest of LATAM
      • By Source
      • By Application
      • By Distribution Channel
    • Market Attractiveness Analysis
      • By Country
      • By Source
      • By Application
      • By Distribution Channel
    • Key Takeaways
  12. Western Europe Market Analysis 2020 to 2024 and Forecast 2025 to 2035, By Country
    • Historical Market Size Value (USD Million) & Volume (Liters) Trend Analysis By Market Taxonomy, 2020 to 2024
    • Market Size Value (USD Million) & Volume (Liters) Forecast By Market Taxonomy, 2025 to 2035
      • By Country
        • Germany
        • Italy
        • France
        • UK
        • Spain
        • BENELUX
        • Nordic
        • Rest of W.Europe
      • By Source
      • By Application
      • By Distribution Channel
    • Market Attractiveness Analysis
      • By Country
      • By Source
      • By Application
      • By Distribution Channel
    • Key Takeaways
  13. Eastern Europe Market Analysis 2020 to 2024 and Forecast 2025 to 2035, By Country
    • Historical Market Size Value (USD Million) & Volume (Liters) Trend Analysis By Market Taxonomy, 2020 to 2024
    • Market Size Value (USD Million) & Volume (Liters) Forecast By Market Taxonomy, 2025 to 2035
      • By Country
        • Russia
        • Hungary
        • Poland
        • Balkan & Baltics
        • Rest of E. Europe
      • By Source
      • By Application
      • By Distribution Channel
    • Market Attractiveness Analysis
      • By Country
      • By Source
      • By Application
      • By Distribution Channel
    • Key Takeaways
  14. East Asia Market Analysis 2020 to 2024 and Forecast 2025 to 2035, By Country
    • Historical Market Size Value (USD Million) & Volume (Liters) Trend Analysis By Market Taxonomy, 2020 to 2024
    • Market Size Value (USD Million) & Volume (Liters) Forecast By Market Taxonomy, 2025 to 2035
      • By Country
        • China
        • Japan
        • South Korea
      • By Source
      • By Application
      • By Distribution Channel
    • Market Attractiveness Analysis
      • By Country
      • By Source
      • By Application
      • By Distribution Channel
    • Key Takeaways
  15. South Asia & Pacific Market Analysis 2020 to 2024 and Forecast 2025 to 2035, By Country
    • Historical Market Size Value (USD Million) & Volume (Liters) Trend Analysis By Market Taxonomy, 2020 to 2024
    • Market Size Value (USD Million) & Volume (Liters) Forecast By Market Taxonomy, 2025 to 2035
      • By Country
        • India
        • Australia & New Zealand
        • ASEAN
        • Rest of SAP
      • By Source
      • By Application
      • By Distribution Channel
    • Market Attractiveness Analysis
      • By Country
      • By Source
      • By Application
      • By Distribution Channel
    • Key Takeaways
  16. Middle East and Africa Market Analysis 2020 to 2024 and Forecast 2025 to 2035, By Country
    • Historical Market Size Value (USD Million) & Volume (Liters) Trend Analysis By Market Taxonomy, 2020 to 2024
    • Market Size Value (USD Million) & Volume (Liters) Forecast By Market Taxonomy, 2025 to 2035
      • By Country
        • GCC Countries
        • Northern Africa
        • South Africa
        • Turkiye
        • Rest of MEA
      • By Source
      • By Application
      • By Distribution Channel
    • Market Attractiveness Analysis
      • By Country
      • By Source
      • By Application
      • By Distribution Channel
    • Key Takeaways
  17. Key Countries Market Analysis
    • USA
      • Pricing Analysis
      • Market Share Analysis, 2024
        • By Source
        • By Application
        • By Distribution Channel
    • Canada
      • Pricing Analysis
      • Market Share Analysis, 2024
        • By Source
        • By Application
        • By Distribution Channel
    • Brazil
      • Pricing Analysis
      • Market Share Analysis, 2024
        • By Source
        • By Application
        • By Distribution Channel
    • Mexico
      • Pricing Analysis
      • Market Share Analysis, 2024
        • By Source
        • By Application
        • By Distribution Channel
    • Argentina
      • Pricing Analysis
      • Market Share Analysis, 2024
        • By Source
        • By Application
        • By Distribution Channel
  18. Market Structure Analysis
    • Competition Dashboard
    • Competition Benchmarking
    • Market Share Analysis of Top Players
      • By Regional
      • By Source
      • By Application
      • By Distribution Channel
  19. Competition Analysis
    • Competition Deep Dive
      • Synutra International
        • Overview
        • Product Portfolio
        • Profitability by Market Segments (Product/Age /Sales Channel/Region)
        • Sales Footprint
        • Strategy Overview
          • Marketing Strategy
          • Product Strategy
          • Channel Strategy
      • Kraft Foods Group, Inc
        • Overview
        • Product Portfolio
        • Profitability by Market Segments (Product/Age /Sales Channel/Region)
        • Sales Footprint
        • Strategy Overview
          • Marketing Strategy
          • Product Strategy
          • Channel Strategy
      • Kerry Ingredients & Flavours
        • Overview
        • Product Portfolio
        • Profitability by Market Segments (Product/Age /Sales Channel/Region)
        • Sales Footprint
        • Strategy Overview
          • Marketing Strategy
          • Product Strategy
          • Channel Strategy
      • Abitec Corporation
        • Overview
        • Product Portfolio
        • Profitability by Market Segments (Product/Age /Sales Channel/Region)
        • Sales Footprint
        • Strategy Overview
          • Marketing Strategy
          • Product Strategy
          • Channel Strategy
      • Watson Inc.
        • Overview
        • Product Portfolio
        • Profitability by Market Segments (Product/Age /Sales Channel/Region)
        • Sales Footprint
        • Strategy Overview
          • Marketing Strategy
          • Product Strategy
          • Channel Strategy
      • Advanced Food Systems Inc.
        • Overview
        • Product Portfolio
        • Profitability by Market Segments (Product/Age /Sales Channel/Region)
        • Sales Footprint
        • Strategy Overview
          • Marketing Strategy
          • Product Strategy
          • Channel Strategy
      • Aarhuskarlshamn AB
        • Overview
        • Product Portfolio
        • Profitability by Market Segments (Product/Age /Sales Channel/Region)
        • Sales Footprint
        • Strategy Overview
          • Marketing Strategy
          • Product Strategy
          • Channel Strategy
      • Firmenich SA
        • Overview
        • Product Portfolio
        • Profitability by Market Segments (Product/Age /Sales Channel/Region)
        • Sales Footprint
        • Strategy Overview
          • Marketing Strategy
          • Product Strategy
          • Channel Strategy
      • BASF Company
        • Overview
        • Product Portfolio
        • Profitability by Market Segments (Product/Age /Sales Channel/Region)
        • Sales Footprint
        • Strategy Overview
          • Marketing Strategy
          • Product Strategy
          • Channel Strategy
      • Eurobio Lab
        • Overview
        • Product Portfolio
        • Profitability by Market Segments (Product/Age /Sales Channel/Region)
        • Sales Footprint
        • Strategy Overview
          • Marketing Strategy
          • Product Strategy
          • Channel Strategy
      • The Good Scents Company
        • Overview
        • Product Portfolio
        • Profitability by Market Segments (Product/Age /Sales Channel/Region)
        • Sales Footprint
        • Strategy Overview
          • Marketing Strategy
          • Product Strategy
          • Channel Strategy
      • DeWolf Chemical
        • Overview
        • Product Portfolio
        • Profitability by Market Segments (Product/Age /Sales Channel/Region)
        • Sales Footprint
        • Strategy Overview
          • Marketing Strategy
          • Product Strategy
          • Channel Strategy
      • COSME ITALY
        • Overview
        • Product Portfolio
        • Profitability by Market Segments (Product/Age /Sales Channel/Region)
        • Sales Footprint
        • Strategy Overview
          • Marketing Strategy
          • Product Strategy
          • Channel Strategy
  20. Assumptions & Acronyms Used
  21. Research Methodology

List of Tables

  • Table 1: Global Market Value (USD Million) Forecast by Region, 2020-2035
  • Table 2: Global Market Volume (Liters) Forecast by Region, 2020-2035
  • Table 3: Global Market Value (USD Million) Forecast by Source, 2020-2035
  • Table 4: Global Market Volume (Liters) Forecast by Source, 2020-2035
  • Table 5: Global Market Value (USD Million) Forecast by Application, 2020-2035
  • Table 6: Global Market Volume (Liters) Forecast by Application, 2020-2035
  • Table 7: Global Market Value (USD Million) Forecast by Distribution Channel, 2020-2035
  • Table 8: Global Market Volume (Liters) Forecast by Distribution Channel, 2020-2035
  • Table 9: North America Market Value (USD Million) Forecast by Country, 2020-2035
  • Table 10: North America Market Volume (Liters) Forecast by Country, 2020-2035
  • Table 11: North America Market Value (USD Million) Forecast by Source, 2020-2035
  • Table 12: North America Market Volume (Liters) Forecast by Source, 2020-2035
  • Table 13: North America Market Value (USD Million) Forecast by Application, 2020-2035
  • Table 14: North America Market Volume (Liters) Forecast by Application, 2020-2035
  • Table 15: North America Market Value (USD Million) Forecast by Distribution Channel, 2020-2035
  • Table 16: North America Market Volume (Liters) Forecast by Distribution Channel, 2020-2035
  • Table 17: Latin America Market Value (USD Million) Forecast by Country, 2020-2035
  • Table 18: Latin America Market Volume (Liters) Forecast by Country, 2020-2035
  • Table 19: Latin America Market Value (USD Million) Forecast by Source, 2020-2035
  • Table 20: Latin America Market Volume (Liters) Forecast by Source, 2020-2035
  • Table 21: Latin America Market Value (USD Million) Forecast by Application, 2020-2035
  • Table 22: Latin America Market Volume (Liters) Forecast by Application, 2020-2035
  • Table 23: Latin America Market Value (USD Million) Forecast by Distribution Channel, 2020-2035
  • Table 24: Latin America Market Volume (Liters) Forecast by Distribution Channel, 2020-2035
  • Table 25: Western Europe Market Value (USD Million) Forecast by Country, 2020-2035
  • Table 26: Western Europe Market Volume (Liters) Forecast by Country, 2020-2035
  • Table 27: Western Europe Market Value (USD Million) Forecast by Source, 2020-2035
  • Table 28: Western Europe Market Volume (Liters) Forecast by Source, 2020-2035
  • Table 29: Western Europe Market Value (USD Million) Forecast by Application, 2020-2035
  • Table 30: Western Europe Market Volume (Liters) Forecast by Application, 2020-2035
  • Table 31: Western Europe Market Value (USD Million) Forecast by Distribution Channel, 2020-2035
  • Table 32: Western Europe Market Volume (Liters) Forecast by Distribution Channel, 2020-2035
  • Table 33: Eastern Europe Market Value (USD Million) Forecast by Country, 2020-2035
  • Table 34: Eastern Europe Market Volume (Liters) Forecast by Country, 2020-2035
  • Table 35: Eastern Europe Market Value (USD Million) Forecast by Source, 2020-2035
  • Table 36: Eastern Europe Market Volume (Liters) Forecast by Source, 2020-2035
  • Table 37: Eastern Europe Market Value (USD Million) Forecast by Application, 2020-2035
  • Table 38: Eastern Europe Market Volume (Liters) Forecast by Application, 2020-2035
  • Table 39: Eastern Europe Market Value (USD Million) Forecast by Distribution Channel, 2020-2035
  • Table 40: Eastern Europe Market Volume (Liters) Forecast by Distribution Channel, 2020-2035
  • Table 41: East Asia Market Value (USD Million) Forecast by Country, 2020-2035
  • Table 42: East Asia Market Volume (Liters) Forecast by Country, 2020-2035
  • Table 43: East Asia Market Value (USD Million) Forecast by Source, 2020-2035
  • Table 44: East Asia Market Volume (Liters) Forecast by Source, 2020-2035
  • Table 45: East Asia Market Value (USD Million) Forecast by Application, 2020-2035
  • Table 46: East Asia Market Volume (Liters) Forecast by Application, 2020-2035
  • Table 47: East Asia Market Value (USD Million) Forecast by Distribution Channel, 2020-2035
  • Table 48: East Asia Market Volume (Liters) Forecast by Distribution Channel, 2020-2035
  • Table 49: South Asia & Pacific Market Value (USD Million) Forecast by Country, 2020-2035
  • Table 50: South Asia & Pacific Market Volume (Liters) Forecast by Country, 2020-2035
  • Table 51: South Asia & Pacific Market Value (USD Million) Forecast by Source, 2020-2035
  • Table 52: South Asia & Pacific Market Volume (Liters) Forecast by Source, 2020-2035
  • Table 53: South Asia & Pacific Market Value (USD Million) Forecast by Application, 2020-2035
  • Table 54: South Asia & Pacific Market Volume (Liters) Forecast by Application, 2020-2035
  • Table 55: South Asia & Pacific Market Value (USD Million) Forecast by Distribution Channel, 2020-2035
  • Table 56: South Asia & Pacific Market Volume (Liters) Forecast by Distribution Channel, 2020-2035
  • Table 57: Middle East and Africa Market Value (USD Million) Forecast by Country, 2020-2035
  • Table 58: Middle East and Africa Market Volume (Liters) Forecast by Country, 2020-2035
  • Table 59: Middle East and Africa Market Value (USD Million) Forecast by Source, 2020-2035
  • Table 60: Middle East and Africa Market Volume (Liters) Forecast by Source, 2020-2035
  • Table 61: Middle East and Africa Market Value (USD Million) Forecast by Application, 2020-2035
  • Table 62: Middle East and Africa Market Volume (Liters) Forecast by Application, 2020-2035
  • Table 63: Middle East and Africa Market Value (USD Million) Forecast by Distribution Channel, 2020-2035
  • Table 64: Middle East and Africa Market Volume (Liters) Forecast by Distribution Channel, 2020-2035

List of Figures

  • Figure 1: Global Market Volume (Liters) Forecast 2020-2035
  • Figure 2: Global Market Pricing Analysis
  • Figure 3: Global Market Value (USD Million) Forecast 2020-2035
  • Figure 4: Global Market Value Share and BPS Analysis by Source, 2025 and 2035
  • Figure 5: Global Market Y-o-Y Growth Comparison by Source, 2025-2035
  • Figure 6: Global Market Attractiveness Analysis by Source
  • Figure 7: Global Market Value Share and BPS Analysis by Application, 2025 and 2035
  • Figure 8: Global Market Y-o-Y Growth Comparison by Application, 2025-2035
  • Figure 9: Global Market Attractiveness Analysis by Application
  • Figure 10: Global Market Value Share and BPS Analysis by Distribution Channel, 2025 and 2035
  • Figure 11: Global Market Y-o-Y Growth Comparison by Distribution Channel, 2025-2035
  • Figure 12: Global Market Attractiveness Analysis by Distribution Channel
  • Figure 13: Global Market Value (USD Million) Share and BPS Analysis by Region, 2025 and 2035
  • Figure 14: Global Market Y-o-Y Growth Comparison by Region, 2025-2035
  • Figure 15: Global Market Attractiveness Analysis by Region
  • Figure 16: North America Market Incremental $ Opportunity, 2025-2035
  • Figure 17: Latin America Market Incremental $ Opportunity, 2025-2035
  • Figure 18: Western Europe Market Incremental $ Opportunity, 2025-2035
  • Figure 19: Eastern Europe Market Incremental $ Opportunity, 2025-2035
  • Figure 20: East Asia Market Incremental $ Opportunity, 2025-2035
  • Figure 21: South Asia & Pacific Market Incremental $ Opportunity, 2025-2035
  • Figure 22: Middle East and Africa Market Incremental $ Opportunity, 2025-2035
  • Figure 23: North America Market Value Share and BPS Analysis by Country, 2025 and 2035
  • Figure 24: North America Market Value Share and BPS Analysis by Source, 2025 and 2035
  • Figure 25: North America Market Y-o-Y Growth Comparison by Source, 2025-2035
  • Figure 26: North America Market Attractiveness Analysis by Source
  • Figure 27: North America Market Value Share and BPS Analysis by Application, 2025 and 2035
  • Figure 28: North America Market Y-o-Y Growth Comparison by Application, 2025-2035
  • Figure 29: North America Market Attractiveness Analysis by Application
  • Figure 30: North America Market Value Share and BPS Analysis by Distribution Channel, 2025 and 2035
  • Figure 31: North America Market Y-o-Y Growth Comparison by Distribution Channel, 2025-2035
  • Figure 32: North America Market Attractiveness Analysis by Distribution Channel
  • Figure 33: Latin America Market Value Share and BPS Analysis by Country, 2025 and 2035
  • Figure 34: Latin America Market Value Share and BPS Analysis by Source, 2025 and 2035
  • Figure 35: Latin America Market Y-o-Y Growth Comparison by Source, 2025-2035
  • Figure 36: Latin America Market Attractiveness Analysis by Source
  • Figure 37: Latin America Market Value Share and BPS Analysis by Application, 2025 and 2035
  • Figure 38: Latin America Market Y-o-Y Growth Comparison by Application, 2025-2035
  • Figure 39: Latin America Market Attractiveness Analysis by Application
  • Figure 40: Latin America Market Value Share and BPS Analysis by Distribution Channel, 2025 and 2035
  • Figure 41: Latin America Market Y-o-Y Growth Comparison by Distribution Channel, 2025-2035
  • Figure 42: Latin America Market Attractiveness Analysis by Distribution Channel
  • Figure 43: Western Europe Market Value Share and BPS Analysis by Country, 2025 and 2035
  • Figure 44: Western Europe Market Value Share and BPS Analysis by Source, 2025 and 2035
  • Figure 45: Western Europe Market Y-o-Y Growth Comparison by Source, 2025-2035
  • Figure 46: Western Europe Market Attractiveness Analysis by Source
  • Figure 47: Western Europe Market Value Share and BPS Analysis by Application, 2025 and 2035
  • Figure 48: Western Europe Market Y-o-Y Growth Comparison by Application, 2025-2035
  • Figure 49: Western Europe Market Attractiveness Analysis by Application
  • Figure 50: Western Europe Market Value Share and BPS Analysis by Distribution Channel, 2025 and 2035
  • Figure 51: Western Europe Market Y-o-Y Growth Comparison by Distribution Channel, 2025-2035
  • Figure 52: Western Europe Market Attractiveness Analysis by Distribution Channel
  • Figure 53: Eastern Europe Market Value Share and BPS Analysis by Country, 2025 and 2035
  • Figure 54: Eastern Europe Market Value Share and BPS Analysis by Source, 2025 and 2035
  • Figure 55: Eastern Europe Market Y-o-Y Growth Comparison by Source, 2025-2035
  • Figure 56: Eastern Europe Market Attractiveness Analysis by Source
  • Figure 57: Eastern Europe Market Value Share and BPS Analysis by Application, 2025 and 2035
  • Figure 58: Eastern Europe Market Y-o-Y Growth Comparison by Application, 2025-2035
  • Figure 59: Eastern Europe Market Attractiveness Analysis by Application
  • Figure 60: Eastern Europe Market Value Share and BPS Analysis by Distribution Channel, 2025 and 2035
  • Figure 61: Eastern Europe Market Y-o-Y Growth Comparison by Distribution Channel, 2025-2035
  • Figure 62: Eastern Europe Market Attractiveness Analysis by Distribution Channel
  • Figure 63: East Asia Market Value Share and BPS Analysis by Country, 2025 and 2035
  • Figure 64: East Asia Market Value Share and BPS Analysis by Source, 2025 and 2035
  • Figure 65: East Asia Market Y-o-Y Growth Comparison by Source, 2025-2035
  • Figure 66: East Asia Market Attractiveness Analysis by Source
  • Figure 67: East Asia Market Value Share and BPS Analysis by Application, 2025 and 2035
  • Figure 68: East Asia Market Y-o-Y Growth Comparison by Application, 2025-2035
  • Figure 69: East Asia Market Attractiveness Analysis by Application
  • Figure 70: East Asia Market Value Share and BPS Analysis by Distribution Channel, 2025 and 2035
  • Figure 71: East Asia Market Y-o-Y Growth Comparison by Distribution Channel, 2025-2035
  • Figure 72: East Asia Market Attractiveness Analysis by Distribution Channel
  • Figure 73: South Asia & Pacific Market Value Share and BPS Analysis by Country, 2025 and 2035
  • Figure 74: South Asia & Pacific Market Value Share and BPS Analysis by Source, 2025 and 2035
  • Figure 75: South Asia & Pacific Market Y-o-Y Growth Comparison by Source, 2025-2035
  • Figure 76: South Asia & Pacific Market Attractiveness Analysis by Source
  • Figure 77: South Asia & Pacific Market Value Share and BPS Analysis by Application, 2025 and 2035
  • Figure 78: South Asia & Pacific Market Y-o-Y Growth Comparison by Application, 2025-2035
  • Figure 79: South Asia & Pacific Market Attractiveness Analysis by Application
  • Figure 80: South Asia & Pacific Market Value Share and BPS Analysis by Distribution Channel, 2025 and 2035
  • Figure 81: South Asia & Pacific Market Y-o-Y Growth Comparison by Distribution Channel, 2025-2035
  • Figure 82: South Asia & Pacific Market Attractiveness Analysis by Distribution Channel
  • Figure 83: Middle East and Africa Market Value Share and BPS Analysis by Country, 2025 and 2035
  • Figure 84: Middle East and Africa Market Value Share and BPS Analysis by Source, 2025 and 2035
  • Figure 85: Middle East and Africa Market Y-o-Y Growth Comparison by Source, 2025-2035
  • Figure 86: Middle East and Africa Market Attractiveness Analysis by Source
  • Figure 87: Middle East and Africa Market Value Share and BPS Analysis by Application, 2025 and 2035
  • Figure 88: Middle East and Africa Market Y-o-Y Growth Comparison by Application, 2025-2035
  • Figure 89: Middle East and Africa Market Attractiveness Analysis by Application
  • Figure 90: Middle East and Africa Market Value Share and BPS Analysis by Distribution Channel, 2025 and 2035
  • Figure 91: Middle East and Africa Market Y-o-Y Growth Comparison by Distribution Channel, 2025-2035
  • Figure 92: Middle East and Africa Market Attractiveness Analysis by Distribution Channel
  • Figure 93: Global Market - Tier Structure Analysis
  • Figure 94: Global Market - Company Share Analysis

Frequently Asked Questions

How big is the brominated vegetable oil market in 2025?

The global brominated vegetable oil market is estimated to be valued at USD 769.5 million in 2025.

What will be the size of the brominated vegetable oil market in 2035?

The market size for the brominated vegetable oil market is projected to reach USD 1,128.1 million by 2035.

How much will the brominated vegetable oil market grow between 2025 and 2035?

The brominated vegetable oil market is expected to grow at a 3.9% CAGR between 2025 and 2035.

Which application segment has the highest segment share in the brominated vegetable oil market?

The beverages account for 68% of the market share, dominating the application segment in the brominated vegetable oil market in 2025.

Which distribution channel is expected to contribute a significant share to the brominated vegetable oil market in 2025?

In terms of distribution channel, the offline channel is expected to command a 65% share in the brominated vegetable oil market in 2025.

Explore Similar Insights

Future Market Insights

Brominated Vegetable Oil Market