Texturized Vegetable Protein Market
Market Insights on Texturized Vegetable Protein covering sales outlook, demand forecast & up-to-date key trends
Texturized Vegetable Protein Market By Product Type (Soy Protein, Wheat Protein, Pea Protein, Rice Protein), Nature (Organic, Conventional), Form (Chunks, Slice, Flakes, Granules), End User (Household, Commercial, Industry), Distribution Channel (Direct, Indirect) & Region - Forecast to 2021 - 2031
Texturized Vegetable Protein Market - About the Report
[300 Pages Report] The number of flexitarians is rapidly increasing, thus propelling the demand for texturized vegetable protein products. As a result of increasing incidence of chronic ailments, consumers are shifting towards healthy food choices. A significant number of these conditions are considered preventable with healthy diets and few lifestyle changes. As a result of the increasing health awareness, the demand for texturized vegetable proteins is set to increase. Also consumer preference for high protein diet has been favoring the overall expansion.
In its new study, ESOMAR-certified market research and consulting firm Future Market Insights (FMI) offers insights about key factors driving demand for texturized vegetable protein. The report tracks the global sales of texturized vegetable protein products in 20+ high-growth markets, along with analyzing the impact COVID-19 has had on the food industry in general, and texturized vegetable protein products in particular.
Let us know your requirement to get
100% FREE customization
How Lucrative is Future Outlook for Texturized Vegetables Market in Comparison to Historical Pattern?
Over the past few years, there has been an increasing shift towards vegetarianism among consumers. This trend has positively affected the demand for plant-based products such as texturized vegetable protein products. In 2008, according to the Vegetarian Times Magazine, over 7.3 million adults in the U.S. were vegetarians, which is 3.2% of the total population. With the number of consumers following vegetarian or flexitarian diet set to rise in the coming years, the demand for texturized vegetable protein is expected to scale higher.
Texturized vegetable protein has emerged as a replacement for proteins such as whey protein, meat protein, egg protein, and others for consumers favoring the vegan trend. Some of the leading names in the food sector have already joined the bandwagon, paving way for the growth of the market. For instance, Beyond Meat uses soy protein with non-genetically modified soy in its chicken-free strips. Consumers are now following the new trend of consuming food containing texturized vegetable protein such as yoghurt smoothies, breakfast cereals, Bakery products and many more.
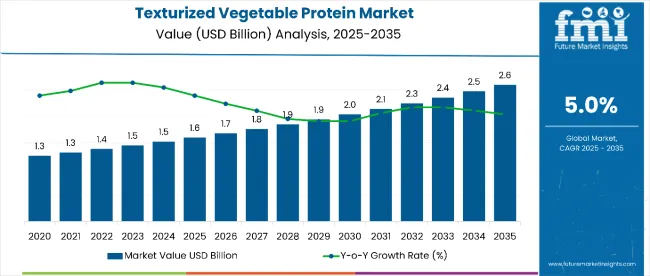
The increasing demand for texturized vegetable protein has led to the emergence and presence of a significantly high number of domestic and small-scale texturized vegetable protein manufacturers across the globe. Moreover, their increasing presence across online platforms has bode well for the overall market. FMI has forecast the texturized vegetable protein market to exhibit 6.5% CAGR between 2021 and 2031 in comparison to 5.8% registered between 2016 and 2020 as focus towards healthy lifestyle increases.
How is Demand for Vegan and High-protein Ingredients Driving Texturized Vegetable Protein Sales?
Along with health consciousness among consumers, their preferences are evolving. As a result they are inclining towards consuming food where no animal is harmed and that causes less environmental damages. This trend has catapulted texturized vegetable protein products to the fore of retail shelves. The growing acceptance of veganism has been aiding overall expansion. According to the Plant Based Foods Association, the retail sales of plant-based foods in the U.S. increased by 11.4% in the past year. Also the increasing demand for vegan, gluten free, and nutrition rich sources of protein has been favoring the surging sales.
Find your sweet spots for generating winning opportunities in this market.
Talk to AnalystWhy are Texturized Vegetables More Popular Among Athletes?
Texturized vegetable proteins are easier to digest as compared to other animal-derived proteins, which also includes dairy products such as whey protein. For instance, pea protein is naturally high in branched chain amino acids- leucine, isoleucine and valine (BCCAAs). Its chemical structure is absorbed and catabolized (broken down for energy) within the muscle. This aspect is particularly important to athletes and fitness enthusiasts, which has resulted into increasing demand for texturized vegetable protein nutrition.
What are Label Claims for Conventional Texturized Vegetable Protein Foods and Dietary Supplements?
The popularity of texturized vegetable protein is increasing among food manufacturers, as it is a clean label ingredient. According to the U.S. Food & Drug Administration (FDA), regulations for Label Claims for Conventional Foods and Dietary Supplements has to be followed by every texturized vegetable protein manufacturer in this market. A food label of texturized vegetable protein should contain information describing the food product and ingredients used. Because textured vegetable protein are derived from plant-based sources they are considered ideal candidate clean label.

A unified Market Research Subscription Platform, built for today's disparate research needs.
What is the Effect of Increasing Healthcare Cost on Texturized Vegetable Protein Sales?
Increasing healthcare cost has been compelling consumers to follow a healthy lifestyle to improve immunity against chronic ailments. Consequently, there is rising demand for protein derived plant-based sources. Besides this, the rising incidence of various chronic ailments has been supporting the overall expansion of the market.
Consumers across some of the mature markets have been focusing on diet control, thanks to high prevalence of obesity, diabetes, heart ailments, and other chronic diseases. According to the Centers for Disease Control and Prevention (CDC), the prevalence of obesity in the U.S. stood at 42.4% in 2017-2018 and the estimated annual medical cost of obesity in the U.S. was recorded at US$ 147 Bn in 2008. Since then healthcare spending has significantly increased, compelling consumers to focus on healthier lifestyle and rethink about their food habits.
According to the World Health Organization (WHO), diabetes continues to be a major cause of heart attacks, stroke, kidney failure, and other chronic diseases. Besides this, the WHO has found that cardiovascular diseases account for nearly 17.9 million deaths worldwide each year. With the burden of various chronic ailments rising, coupled with increasing healthcare costs, more consumers are likely to shift towards a healthier living, creating prospects for textured vegetable protein sales.
Opportunities Abound in Texturized Vegetable Protein
As consumer interest and demand for new products increases, a reduction in the consumption of meat will be observed. One approach is to develop meat analogues which will be similar in taste and texture just like meat itself individual focus towards the development of texture and taste must be considered by texturized vegetable protein manufacturers, as consumer approach towards product texture and savory aspects vary significantly.
Further in developing countries, young consumers are now demanding more of clean labeled protein as sport nutrition. This also leads to an opportunity for texturized vegetable protein.
Texturized Vegetable Protein Market Country-wise Insights
How big is the Opportunity in US Texturized Vegetable Protein?
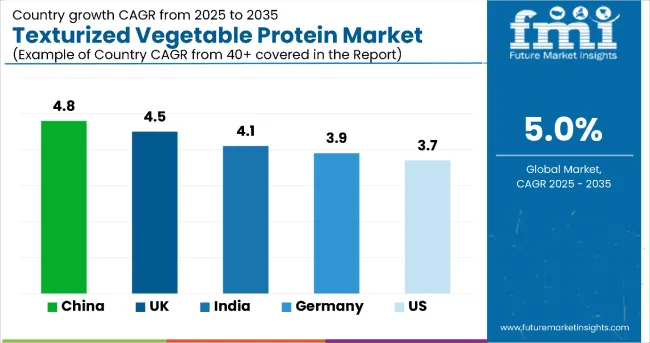
FMI has projected North America to remain one of the most lucrative texturized vegetable protein markets throughout the course of the forecast period. One of the key factors supporting expansion of texturized vegetable protein is the U.S. is increasing per capita consumption expenditure is due to rising awareness about health-related issues. Further it is estimated that increasing per capita expenditure on beverages will continue supporting growth of the texturized vegetable protein industry.
U.S. remains one of the largest markets for texturized vegetable protein in the world, which invariably makes it a lucrative pocket for manufacturers. The U.S. accounted for 91.7% of the North America market for texturized vegetable protein in 2019. The increasing demand for natural ingredients is an opportunity for the manufacturers to expand their portfolio over the forecast period. In the meantime, increasing vegan population in the U.S. will immensely support sales of plant-based protein. According to a survey (sample size – 1,033) conducted by Gallup in 2018, 3% of Americans said that they were vegans. With vegan population set to rise in America, the demand for texturized vegetable proteins will increase in the coming years.
How big is the Opportunity in China Texturized Vegetable Protein?
FMI has projected China to remain one of the most lucrative markets in East Asia throughout the course of the forecast period. The rising incidence of various chronic diseases, besides high prevalence of obesity in China has been contributing towards changing eating patterns among consumers. According to the World Heart Federation, non-communicable diseases including heart diseases are expected to cause 87% of mortality in China.
A National Health Commission report, released in China in 2020 has found that more than half of adults in the country can be classified as overweight, of whom nearly 16.4% are overweight. The rising prevalence of obesity, besides cardiovascular ailments has been pushing for healthier lifestyle, creating growth opportunities for the market in China.
How big is the Opportunity in Germany Texturized Vegetable Protein?
In recent years, the vegan population in Germany has rapidly expanded. Much of the vegan population sees veganism as a lifestyle choice, not just a dietary restriction. An increase in desired wellness resulted in changes in consumer diets, facilitating the rise texturized vegetable protein among the German population, that is increasingly concerned about animal welfare, the environment, and, especially, their health. Besides this, the presence of companies such as Cargill Inc. has been supporting expansion in Germany.
How Big is Opportunity for Texturized Vegetable Sales in India?
According to the National Diabetes and Diabetic Retinopathy Survey Report, the prevalence of diabetes in India stood at 11.8%. Diabetes and diabetic retinopathy have emerged as a significant non-communicable disease, resulting in ocular morbidity. With the incidence of various chronic ailments showing no signs of slowing down, an increasing number of people are likely to adopt food promoting a better health.
A survey conducted by the United Nations Food and Agriculture Organization has indicated that India has more number of vegetarians than rest of the world put together. With an increasing number of consumers adopting a vegetarian lifestyle, India will make for a lucrative market for texturized vegetable sales.
What Supports Texturized Vegetable Protein Sales in U.K.?
The U.K. is expected to remain one of the key markets for texturized vegetable protein. The high prevalence of diabetes has been supporting sales in the country. According to the Diabetes.co.uk statistics, the prevalence of diabetes in the country is forecast to touch 5 million by the end of 2025. While mortality because of heart diseases is on decline, it continues to pose immense burden on the country. Consequently, focus on plant-based sources of protein as a key ingredient in food products has greatly increased. This has been creating attractive opportunities for sales in the U.K.
Texturized Vegetable Protein Market Category Wise
Why is Soy Protein More Preferred as Texturized Vegetable Protein?
The soy protein segment is expected to hold 70.0% of global texturized vegetable protein market in 2030. Soy protein is known to have several health benefits. Most importantly it is considered to be a safer alternative for meat protein, aiding in muscle building. It is also known to have 9 essential amino acids and provide a multitude of functional benefits to food processors. Also the rising popularity of natural soy products such as tempeh, tofu, edamame, and soy milk has been aiding the overall expansion of the segment.
Which Form of Texturized Vegetable Protein is More in Demand?
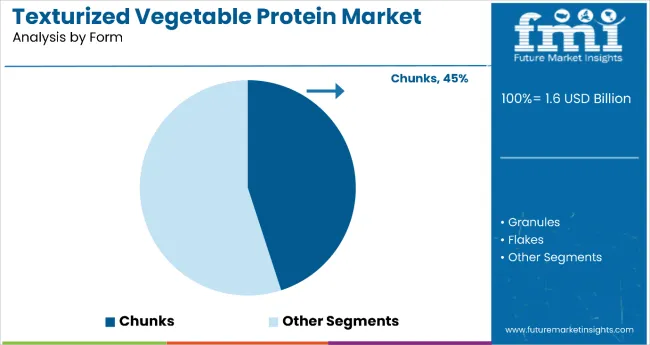
Granules form is expected to hold 29.0% in 2030 share globally. Texturized vegetable protein -based products are mainly called meal replacements. Texturized vegetable protein in granules form is used in cereals, chili, stews and other snack products.
Which End User is Exhibiting High Demand for Texturized Vegetable Protein?
The food industry is expected to hold the maximum share of the market through the forecast period. Within the food sector, the meat analogues segment is expected to showcase high demand for texturized vegetable protein. The increasing demand for protein derived from plant-based sources has been creating growth opportunities within the industry.
Which Distributions Channel is More Preferred?
Direct distribution channel holds maximum share in the market. Direct distribution channel make it possible for the manufacturers to know their buyers and their behavior towards the product. However, over the forecast period the sales via indirect channels have been expected to improve as well.
Competitive Landscape
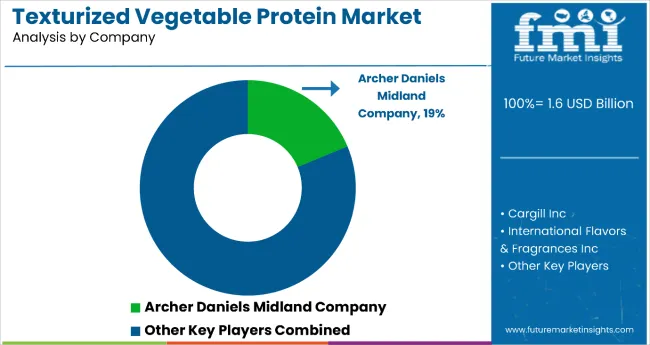
Global texturized vegetable protein is primarily characterized by presence of a large number of local, regional and multinational companies. Regional players are relatively highly concentrated in texturized vegetable protein as compared to local players and multinational players. Moreover, regional players are trying to increase their reach across the world. Established players on the other hand are strengthening their position by acquiring local players. This is also intended to have a powerful product portfolio. Besides this, they have been adopting various strategies for expansion such as building new facilities.
For instance, Cargill Inc., in January 2017, started construction of a new US$ 60 Mn protein business headquarters in Wichita, U.S. to increase its protein production. Cargill Inc., the largest company in the USA, has grown to one of the world's top producers and distributors of agricultural products and will continue to grow in its sector and win the hearts of people.
In 2017, E.I. du Pont de Nemours & Co, launched SUPRO XT 55 which is an isolated Soy Protein which will help manufacturers of beverages to maintain protein costs with the on-going trend of consuming plant- based protein.
In 2020, MGP Ingredients, Inc, announces a new product line “ProTerra” in the texturized vegetable protein market. ProTerra offered a new range of textured pea with TruTex (textured wheat).
Some of the leading companies operating in the texturized vegetable protein market are:
- Archer Daniels Midland Company
- CHS Inc.
- Roquette Frères
- Beneo GmbH
- Danisco A/S
- Vestkron A/S
- Cargill Inc.
- FUJI OIL CO., LTD.
- Puris Proteins, LLC.
- Ingredion Inc.
*The list is not exhaustive, and only for representational purposes. Full competitive intelligence with SWOT analysis available in the report.
Scope of the Report
Attribute |
Details |
Forecast Period |
2015-2030 |
Historical Data Available for |
2015-2019 |
Market Analysis |
USD Million for value and Metric Tons for Volume |
Key Regions Covered |
North America, Latin America, Europe, East Asia, South Asia, Oceania Middle East & Africa |
Key Countries Covered |
US, Canada, Germany, U.K., France, Italy, Spain, Poland, Russia, China, Japan, South Korea, India, Thailand, Malaysia, Vietnam, Indonesia, Australia, New Zealand, GCC Countries, Turkey, Northern Africa, South Africa |
Key Segments Covered |
Product Type, Nature, Form, End Users, Distribution Channel, Regions |
Key Companies Profiled |
|
Report Coverage |
Market Forecast, brand share analysis, competition intelligence, DROT analysis, Market Dynamics and Challenges, Strategic Growth Initiatives |
Customization & Pricing |
Texturized Vegetable Protein Market Key Segments
Product Type:
- Soy Protein
- Wheat Protein
- Pea Protein
- Rice Protein
Nature:
- Organic
- Conventional
Form:
- Chunks
- Slice
- Flakes
- Granules
End Users:
- Household
- Commercial
- Industry
- Food Industry
- Bakery
- Snacks
- Ready Meals
- Sports Nutrition
- Clinical Nutrition
- Baby Food
- Meat Analogues
- Others
- Animal Feed
- Food Industry
Distribution Channel:
- Direct
- Indirect
- Store Based
- Hypermarket
- Convenience St.
- Traditional Store
- Online Retails
Region:
- North America
- Latin America
- Europe
- East Asia
- South Asia
- Middle East and Africa (MEA)
- Oceania
Frequently Asked Questions
The U.S. currently leads the global market for texturized vegetable protein. Sales in U.S. will account for over 91.7% of total demand in North America.
Soy protein is highly sought-after among products available. Soy protein is expected to continue leading the market for texturized vegetable protein through 2031. Other than soy and pea, proteins such as faba bean, lentil, and corn are also available in the market.
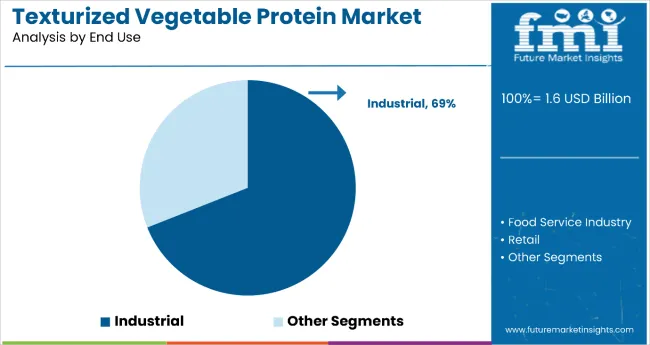
Industrial sector remains the leading end user of texturized vegetable protein as application continues to rise in bakery, snacks, ready meals, sports nutrition, clinical nutrition, baby food, meat analogues and others.
Granules form is expected to hold maximum share in the market due to their increasing application in various food products such as cereals, snacks, and others.
? Some of the leading companies offering texturized vegetable protein are Archer Daniels Midland Company, CHS Inc., Roquette Frères, Beneo GmbH, Danisco A/S, Vestkron A/S, Cargill Inc., FUJI OIL CO., LTD., Puris Proteins, LLC., MGP Ingredients, Inc., Crown Soya Protein Group, Sotexpro SA, Wilmar International Ltd., Gushen Biotechnology Group Co., Ltd.,Ingredion Inc.
Table of Content
1. Executive Summary
1.1. Global Market Outlook
1.2. Summary of Statistics
1.3. Summary of Key Findings
1.4. Analysis and Recommendations
2. Market Overview
2.1. Market Coverage / Taxonomy
2.2. Market Definition / Scope / Limitations
3. Product Innovation and Development
3.1. Cultural Customization to Target Specific Populations and Ethnic Groups
3.2. Creating New Delivery Mechanisms
3.3. Shift towards Natural Ingredients
3.4. Brand Differentiation through Packaging
4. Risk & Opportunity
4.1. Risk Analysis
4.2. Opportunity Analysis
5. Market Dynamics
5.1. Drivers
5.2. Restraints
5.3. Opportunity
5.4. Trends
5.5. Macro-Economic Factors
5.6. Forecast Factors - Relevance & Impact
6. Value Chain Analysis
6.1. Supply Chain Analysis
6.1.1. Raw Material Suppliers
6.1.2. Product Manufacturers
6.1.3. Distributors/Suppliers/Wholesalers
7. Policy and Regulatory Landscape
7.1. Dietary Supplement Health and Education Act (DSHEA)
7.2. Federal Food & Cosmetics Act
7.3. Europe Food & Safety Authority
7.4. State Food and Drug Administration (SFDA)
7.5. Foods for Specified Health Uses
7.6. FSSAI
7.7. Food Packaging Claims
7.8. Labeling and Claims
7.9. Import/Export Regulations
8. Global Market Demand Analysis 2016-2020 and Forecast, 2021-2031
8.1. Historical Market Volume (Metric Tons) Analysis, 2016-2020
8.2. Current and Future Market Volume (Metric Tons) Projections, 2021-2031
8.3. Y-o-Y Growth Trend Analysis
9. Global Market - Pricing Analysis
9.1. Regional Pricing Analysis (US$/Metric Tons) By Product Type
9.2. Global Average Pricing Analysis Benchmark
9.3. Pricing Influencing Factors
10. Global Market Analysis 2016-2020 and Forecast 2021-2031, By Product Type
10.1. Introduction / Key Findings
10.2. Historical Market Size (US$ Mn) and Volume Analysis By Product Type , 2016 - 2020
10.3. Current and Future Market Size (US$ Mn) and Volume Analysis and Forecast By Product Type, 2021 - 2031
10.3.1. Soy
10.3.2. Wheat
10.3.3. Pea
10.3.4. Rice
10.4. Market Attractiveness Analysis By Product Type
11. Global Market Analysis 2016-2020 and Forecast 2021-2031, By Nature
11.1. Introduction / Key Findings
11.2. Historical Market Size (US$ Mn) and Volume Analysis By Nature, 2016 - 2020
11.3. Current and Future Market Size (US$ Mn) and Volume Analysis and Forecast By Nature, 2021 - 2031
11.3.1. Organic
11.3.2. Conventional
11.4. Market Attractiveness Analysis By Nature
12. Global Market Analysis 2016-2020 and Forecast 2021-2031, By Form
12.1. Introduction / Key Findings
12.2. Historical Market Size (US$ Mn) and Volume Analysis By Form, 2016 - 2020
12.3. Current and Future Market Size (US$ Mn) and Volume Analysis and Forecast By Form, 2021 - 2031
12.3.1. Chunks
12.3.2. Slice
12.3.3. Flakes
12.3.4. Granules
12.4. Market Attractiveness Analysis By Form
13. Global Market Analysis 2016-2020 and Forecast 2021-2031, By End Users
13.1. Introduction / Key Findings
13.2. Historical Market Size (US$ Mn) and Volume Analysis By End Users, 2016 - 2020
13.3. Current and Future Market Size (US$ Mn) and Volume Analysis and Forecast By End Users, 2021 - 2031
13.3.1. Households
13.3.2. Commercial
13.3.3. Industry
13.3.3.1. Food Industry
13.3.3.1.1. Bakery
13.3.3.1.2. Snacks
13.3.3.1.3. Ready Meals
13.3.3.1.4. Sports Nutrition
13.3.3.1.5. Clinical Nutrition
13.3.3.1.6. Baby Food
13.3.3.1.7. Meat Analogues
13.3.3.1.8. Others
13.3.3.2. Animal Feed & Pet Food
13.4. Market Attractiveness Analysis By End Users
14. Global Market Analysis 2016-2020 and Forecast 2021-2031, By Distribution Channel
14.1. Introduction / Key Findings
14.2. Historical Market Size (US$ Mn) and Volume Analysis By Distribution Channel, 2016-2020
14.3. Current and Future Market Size (US$ Mn) and Volume Analysis and Forecast By Distribution Channel, 2021 – 2031
14.3.1. Direct
14.3.2. Indirect
14.3.2.1. Store Based
14.3.2.2. Hypermarket
14.3.2.3. Convenience Store
14.3.2.4. Traditional Grocery Retail
14.3.2.5. Online Retail
14.4. Market Attractiveness Analysis By Distribution Channel
15. Global Market Analysis 2016-2020 and Forecast 2021-2031, By Region
15.1. Introduction
15.2. Historical Market Size (US$ Mn) and Volume Analysis By Region, 2016 - 2020
15.3. Current Market Size (US$ Mn) and Volume Analysis and Forecast By Region, 2021 - 2031
15.3.1. North America
15.3.2. Latin America
15.3.3. Europe
15.3.4. East Asia
15.3.5. South Asia
15.3.6. Oceania
15.3.7. Middle East and Africa (MEA)
15.4. Market Attractiveness Analysis By Region
16. North America Market Analysis 2016-2020 and Forecast 2021-2031
16.1. Introduction
16.2. Historical Market Size (US$ Mn) and Volume Trend Analysis By Market Taxonomy, 2016 - 2020
16.3. Market Size (US$ Mn) and Volume Forecast By Market Taxonomy, 2021 - 2031
16.3.1. By Country
16.3.1.1. U.S.
16.3.1.2. Canada
16.3.2. By Product Type
16.3.3. By Nature
16.3.4. By Form
16.3.5. By End Users
16.3.6. By Distribution Channel
16.4. Market Attractiveness Analysis
16.4.1. By Country
16.4.2. By Product Type
16.4.3. By Nature
16.4.4. By Form
16.4.5. By End Users
16.4.6. By Distribution Channel
16.5. Drivers and Restraints - Impact Analysis
17. Latin America Market Analysis 2016-2020 and Forecast 2021-2031
17.1. Introduction
17.2. Historical Market Size (US$ Mn) and Volume Trend Analysis By Market Taxonomy, 2016 - 2020
17.3. Market Size (US$ Mn) and Volume Forecast By Market Taxonomy, 2021 - 2031
17.3.1. By Country
17.3.1.1. Brazil
17.3.1.2. Mexico
17.3.1.3. Argentina
17.3.1.4. Rest of Latin America
17.3.2. By Product Type
17.3.3. By Nature
17.3.4. By Form
17.3.5. By End Users
17.3.6. By Distribution Channel
17.4. Market Attractiveness Analysis
17.4.1. By Country
17.4.2. By Product Type
17.4.3. By Nature
17.4.4. By Form
17.4.5. By End Users
17.4.6. By Distribution Channel
17.5. Drivers and Restraints - Impact Analysis
18. Europe Market Analysis 2016-2020 and Forecast 2021-2031
18.1. Introduction
18.2. Historical Market Size (US$ Mn) and Volume Trend Analysis By Market Taxonomy, 2016 - 2020
18.3. Market Size (US$ Mn) and Volume Forecast By Market Taxonomy, 2021 - 2031
18.3.1. By Country
18.3.1.1. Germany
18.3.1.2. Italy
18.3.1.3. France
18.3.1.4. U.K.
18.3.1.5. Spain
18.3.1.6. Benelux
18.3.1.7. Russia
18.3.1.8. Poland
18.3.1.9. Rest of Europe
18.3.2. By Product Type
18.3.3. By Nature
18.3.4. By Form
18.3.5. By End Users
18.3.6. By Distribution Channel
18.4. Market Attractiveness Analysis
18.4.1. By Country
18.4.2. By Product Type
18.4.3. By Nature
18.4.4. By Form
18.4.5. By End Users
18.4.6. By Distribution Channel
18.5. Drivers and Restraints - Impact Analysis
19. East Asia Market Analysis 2016-2020 and Forecast 2021-2031
19.1. Introduction
19.2. Historical Market Size (US$ Mn) and Volume Trend Analysis By Market Taxonomy, 2016 - 2020
19.3. Market Size (US$ Mn) and Volume Forecast By Market Taxonomy, 2021 - 2031
19.3.1. By Country
19.3.1.1. China
19.3.1.2. Japan
19.3.1.3. South Korea
19.3.2. By Product Type
19.3.3. By Nature
19.3.4. By Form
19.3.5. By End Users
19.3.6. By Distribution Channel
19.4. Market Attractiveness Analysis
19.4.1. By Country
19.4.2. By Product Type
19.4.3. By Nature
19.4.4. By Form
19.4.5. By End Users
19.4.6. By Distribution Channel
19.5. Drivers and Restraints - Impact Analysis
20. South Asia Market Analysis 2016-2020 and Forecast 2021-2031
20.1. Introduction
20.2. Historical Market Size (US$ Mn) and Volume Trend Analysis By Market Taxonomy, 2016 - 2020
20.3. Market Size (US$ Mn) and Volume Forecast By Market Taxonomy, 2021 - 2031
20.3.1. By Country
20.3.1.1. India
20.3.1.2. Thailand
20.3.1.3. Indonesia
20.3.1.4. Malaysia
20.3.1.5. Singapore
20.3.1.6. Rest of South Asia
20.3.2. By Product Type
20.3.3. By Nature
20.3.4. By Form
20.3.5. By End Users
20.3.6. By Distribution Channel
20.4. Market Attractiveness Analysis
20.4.1. By Country
20.4.2. By Product Type
20.4.3. By Nature
20.4.4. By Form
20.4.5. By End Users
20.4.6. By Distribution Channel
20.5. Drivers and Restraints - Impact Analysis
21. Oceania Market Analysis 2016-2020 and Forecast 2021-2031
21.1. Introduction
21.2. Historical Market Size (US$ Mn) and Volume Trend Analysis By Market Taxonomy, 2016 - 2020
21.3. Market Size (US$ Mn) and Volume Forecast By Market Taxonomy, 2021 - 2031
21.3.1. By Country
21.3.1.1. Australia
21.3.1.2. New Zealand
21.3.2. By Product Type
21.3.3. By Nature
21.3.4. By Form
21.3.5. By End Users
21.3.6. By Distribution Channel
21.4. Market Attractiveness Analysis
21.4.1. By Country
21.4.2. By Product Type
21.4.3. By Nature
21.4.4. By Form
21.4.5. By End Users
21.4.6. By Distribution Channel
21.5. Drivers and Restraints - Impact Analysis
22. Middle East and Africa Market Analysis 2016-2020 and Forecast 2021-2031
22.1. Introduction
22.2. Historical Market Size (US$ Mn) and Volume Trend Analysis By Market Taxonomy, 2016 - 2020
22.3. Market Size (US$ Mn) and Volume Forecast By Market Taxonomy, 2021 - 2031
22.3.1. By Country
22.3.1.1. GCC Countries
22.3.1.2. Turkey
22.3.1.3. South Africa
22.3.1.4. Northern Africa
22.3.1.5. Rest of MEA
22.3.2. By Product Type
22.3.3. By Nature
22.3.4. By Form
22.3.5. By End Users
22.3.6. By Distribution Channel
22.4. Market Attractiveness Analysis
22.4.1. By Country
22.4.2. By Product Type
22.4.3. By Form
22.4.4. By End Users
22.4.5. By Distribution Channel
22.5. Drivers and Restraints - Impact Analysis
23. Emerging Countries Market Analysis 2016-2020 and Forecast 2021-2031
23.1. Introduction
23.2. China Market Analysis 2016-2020 and Forecast 2021-2031
23.2.1. By Product Type
23.2.2. By Nature
23.2.3. By Form
23.2.4. By End Users
23.2.5. By Distribution Channel
23.2.6. Market Attractiveness Analysis
23.2.7. Drivers and Restraints - Impact Analysis
23.3. France Market Analysis 2016-2020 and Forecast 2021-2031
23.3.1. By Product Type
23.3.2. By Nature
23.3.3. By Form
23.3.4. By End Users
23.3.5. By Distribution Channel
23.3.6. Market Attractiveness Analysis
23.3.7. Drivers and Restraints - Impact Analysis
23.4. U.K Market Analysis 2016-2020 and Forecast 2021-2031
23.4.1. By Product Type
23.4.2. By Nature
23.4.3. By Form
23.4.4. By End Users
23.4.5. By Distribution Channel
23.4.6. Market Attractiveness Analysis
23.4.7. Drivers and Restraints - Impact Analysis
24. Market Structure Analysis
24.1. Global Market Competition - a Dashboard View
24.2. Global Market Structure Analysis
24.3. Global Market Company Share Analysis
24.3.1. Company Market Share Analysis of Top 10 Players, By Region
24.3.2. Company Market Share Analysis of Top 10 Players, By Product Type
24.4. Key Participants Market Presence (Intensity Mapping) by Region
25. Competition Analysis
25.1. Competition Dashboard
25.2. Competition Benchmarking
25.3. Competition Deep Dive
25.3.1. ROQUETTE FRERES S.A
25.3.1.1. Overview
25.3.1.2. Product Portfolio
25.3.1.3. Key Developments/Key Takeaways
25.3.1.4. Strategy Overview
25.3.1.5. Financial Overview
25.3.2. CHS Inc.
25.3.2.1. Overview
25.3.2.2. Product Portfolio
25.3.2.3. Key Developments/Key Takeaways
25.3.2.4. Strategy Overview
25.3.2.5. Financial Overview
25.3.3. Archer Daniels Midland Company
25.3.3.1. Overview
25.3.3.2. Product Portfolio
25.3.3.3. Key Developments/Key Takeaways
25.3.3.4. Strategy Overview
25.3.3.5. Financial Overview
25.3.4. Cargill Inc.
25.3.4.1. Overview
25.3.4.2. Product Portfolio
25.3.4.3. Key Developments/Key Takeaways
25.3.4.4. Strategy Overview
25.3.4.5. Financial Overview
25.3.5. E.I. du Pont de Nemours & Co.
25.3.5.1. Overview
25.3.5.2. Product Portfolio
25.3.5.3. Key Developments/Key Takeaways
25.3.5.4. Strategy Overview
25.3.5.5. Financial Overview
25.3.6. MGP Ingredients, Inc.
25.3.6.1. Overview
25.3.6.2. Product Portfolio
25.3.6.3. Key Developments/Key Takeaways
25.3.6.4. Strategy Overview
25.3.6.5. Financial Overview
25.3.7. Sonic Biochem Extractions Limited
25.3.7.1. Overview
25.3.7.2. Product Portfolio
25.3.7.3. Key Developments/Key Takeaways
25.3.7.4. Strategy Overview
25.3.7.5. Financial Overview
25.3.8. Sotexpro
25.3.8.1. Overview
25.3.8.2. Product Portfolio
25.3.8.3. Key Developments/Key Takeaways
25.3.8.4. Strategy Overview
25.3.8.5. Financial Overview
25.3.9. BENEO GmbH
25.3.9.1. Overview
25.3.9.2. Product Portfolio
25.3.9.3. Key Developments/Key Takeaways
25.3.9.4. Strategy Overview
25.3.9.5. Financial Overview
25.3.10. Victoria Group
25.3.10.1. Overview
25.3.10.2. Product Portfolio
25.3.10.3. Key Developments/Key Takeaways
25.3.10.4. Strategy Overview
25.3.10.5. Financial Overview
25.3.11. Shandong Yuxin Soybean Protein Co. Ltd.
25.3.11.1. Overview
25.3.11.2. Product Portfolio
25.3.11.3. Key Developments/Key Takeaways
25.3.11.4. Strategy Overview
25.3.11.5. Financial Overview
25.3.12. Crown Soya Protein Group
25.3.12.1. Overview
25.3.12.2. Product Portfolio
25.3.12.3. Key Developments/Key Takeaways
25.3.12.4. Strategy Overview
25.3.12.5. Financial Overview
26. Assumptions and Acronyms Used
27. Research Methodology
Let us know your requirement to get
100% FREE customization
List of Tables
Table 1: Global Market Value (US$ Mn) and Forecast by Region, 2016–2021
Table 2: Global Market Value (US$ Mn) and Forecast by Region, 2021–2031
Table 3: Global Market Volume (Metric Tons) and Forecast by Region, 2016–2021
Table 4: Global Market Volume (Metric Tons) and Forecast by Region, 2021–2031
Table 5: Global Market Value (US$ Mn) and Forecast by Product Type, 2016–2021
Table 6: Global Market Value (US$ Mn) and Forecast by Product Type, 2021–2031
Table 7: Global Market Volume (Metric Tons) and Forecast by Product Type, 2016–2021
Table 8: Global Market Volume (Metric Tons) and Forecast by Product Type, 2021–2031
Table 9: Global Market Value (US$ Mn) and Forecast by Nature, 2016–2021
Table 10: Global Market Value (US$ Mn) and Forecast by Nature, 2021–2031
Table 11: Global Market Volume (Metric Tons) and Forecast by Nature, 2016–2021
Table 12: Global Market Volume (Metric Tons) and Forecast by Nature, 2021–2031
Table 13: Global Market Value (US$ Mn) and Forecast by Form, 2016–2021
Table 14: Global Market Value (US$ Mn) and Forecast by Form, 2021–2031
Table 15: Global Market Volume (Metric Tons) and Forecast by Form, 2016–2021
Table 16: Global Market Volume (Metric Tons) and Forecast by Form, 2021–2031
Table 17: Global Market Value (US$ Mn) and Forecast by End User, 2016–2021
Table 18: Global Market Value (US$ Mn) and Forecast by End user, 2021–2031
Table 19: Global Market Volume (Metric Tons) and Forecast by End User, 2016–2021
Table 20: Global Market Volume (Metric Tons) and Forecast by End User, 2021–2031
Table 21: Global Market Value (US$ Mn) and Forecast by Distribution Channel, 2016–2021
Table 22: Global Market Value (US$ Mn) and Forecast by Distribution Channel, 2021–2031
Table 23: Global Market Volume (Metric Tons) and Forecast by Distribution Channel, 2016–2021
Table 24: Global Market Volume (Metric Tons) and Forecast by Distribution Channel, 2021–2031
Table 25: North America Market Value (US$ Mn) and Forecast by Country, 2016–2021
Table 26: North America Market Value (US$ Mn) and Forecast by Country, 2021–2031
Table 27: North America Market Volume (Metric Tons) and Forecast by Country, 2016–2021
Table 28: North America Market Volume (Metric Tons) and Forecast by Country, 2021–2031
Table 29: North America Market Value (US$ Mn) and Forecast by Product Type, 2016–2021
Table 30: North America Market Value (US$ Mn) and Forecast by Product Type, 2021–2031
Table 31: North America Market Volume (Metric Tons) and Forecast by Product Type, 2016–2021
Table 32: North America Market Volume (Metric Tons) and Forecast by Product Type, 2021–2031
Table 33: North America Market Value (US$ Mn) and Forecast by Nature, 2016–2021
Table 34: North America Market Value (US$ Mn) and Forecast by Nature, 2021–2031
Table 35: North America Market Volume (Metric Tons) and Forecast by Nature, 2016–2021
Table 36: North America Market Volume (Metric Tons) and Forecast by Nature, 2021–2031
Table 37: North America Market Value (US$ Mn) and Forecast by Form, 2016–2021
Table 38: North America Market Value (US$ Mn) and Forecast by Form, 2021–2031
Table 39: North America Market Volume (Metric Tons) and Forecast by Form, 2016–2021
Table 40: North America Market Volume (Metric Tons) and Forecast by Form, 2021–2031
Table 41: North America Market Value (US$ Mn) and Forecast by End User, 2016–2021
Table 42: North America Market Value (US$ Mn) and Forecast by End user, 2021–2031
Table 43: North America Market Volume (Metric Tons) and Forecast by End User, 2016–2021
Table 44: North America Market Volume (Metric Tons) and Forecast by End User, 2021–2031
Table 45: North America Market Value (US$ Mn) and Forecast by Distribution Channel, 2016–2021
Table 46: North America Market Value (US$ Mn) and Forecast by Distribution Channel, 2021–2031
Table 47: North America Market Volume (Metric Tons) and Forecast by Distribution Channel, 2016–2021
Table 48: North America Market Volume (Metric Tons) and Forecast by Distribution Channel, 2021–2031
Table 49: Latin America Market Value (US$ Mn) and Forecast by Country, 2016–2021
Table 50: Latin America Market Value (US$ Mn) and Forecast by Country, 2021–2031
Table 51: Latin America Market Volume (Metric Tons) and Forecast by Country, 2016–2021
Table 52: Latin America Market Volume (Metric Tons) and Forecast by Country, 2021–2031
Table 53: Latin America Market Value (US$ Mn) and Forecast by Product Type, 2016–2021
Table 54: Latin America Market Value (US$ Mn) and Forecast by Product Type, 2021–2031
Table 55: Latin America Market Volume (Metric Tons) and Forecast by Product Type, 2016–2021
Table 56: Latin America Market Volume (Metric Tons) and Forecast by Product Type, 2021–2031
Table 57: Latin America Market Value (US$ Mn) and Forecast by Nature, 2016–2021
Table 58: Latin America Market Value (US$ Mn) and Forecast by Nature, 2021–2031
Table 59: Latin America Market Volume (Metric Tons) and Forecast by Nature, 2016–2021
Table 60: Latin America Market Volume (Metric Tons) and Forecast by Nature, 2021–2031
Table 61: Latin America Market Value (US$ Mn) and Forecast by Form, 2016–2021
Table 62: Latin America Market Value (US$ Mn) and Forecast by Form, 2021–2031
Table 63: Latin America Market Volume (Metric Tons) and Forecast by Form, 2016–2021
Table 64: Latin America Market Volume (Metric Tons) and Forecast by Form, 2021–2031
Table 65: Latin America Market Value (US$ Mn) and Forecast by End User, 2016–2021
Table 66: Latin America Market Value (US$ Mn) and Forecast by End user, 2021–2031
Table 67: Latin America Market Volume (Metric Tons) and Forecast by End User, 2016–2021
Table 68: Latin America Market Volume (Metric Tons) and Forecast by End User, 2021–2031
Table 69: Latin America Market Value (US$ Mn) and Forecast by Distribution Channel, 2016–2021
Table 70: Latin America Market Value (US$ Mn) and Forecast by Distribution Channel, 2021–2031
Table 71: Latin America Market Volume (Metric Tons) and Forecast by Distribution Channel, 2016–2021
Table 72: Latin America Market Volume (Metric Tons) and Forecast by Distribution Channel, 2021–2031
Table 73: Europe Market Value (US$ Mn) and Forecast by Country, 2016–2021
Table 74: Europe Market Value (US$ Mn) and Forecast by Country, 2021–2031
Table 75: Europe Market Volume (Metric Tons) and Forecast by Country, 2016–2021
Table 76: Europe Market Volume (Metric Tons) and Forecast by Country, 2021–2031
Table 77: Europe Market Value (US$ Mn) and Forecast by Product Type, 2016–2021
Table 78: Europe Market Value (US$ Mn) and Forecast by Product Type, 2021–2031
Table 79: Europe Market Volume (Metric Tons) and Forecast by Product Type, 2016–2021
Table 80: Europe Market Volume (Metric Tons) and Forecast by Product Type, 2021–2031
Table 81: Europe Market Value (US$ Mn) and Forecast by Nature, 2016–2021
Table 82: Europe Market Value (US$ Mn) and Forecast by Nature, 2021–2031
Table 83: Europe Market Volume (Metric Tons) and Forecast by Nature, 2016–2021
Table 84: Europe Market Volume (Metric Tons) and Forecast by Nature, 2021–2031
Table 85: Europe Market Value (US$ Mn) and Forecast by Form, 2016–2021
Table 86: Europe Market Value (US$ Mn) and Forecast by Form, 2021–2031
Table 87: Europe Market Volume (Metric Tons) and Forecast by Form, 2016–2021
Table 88: Europe Market Volume (Metric Tons) and Forecast by Form, 2021–2031
Table 89: Europe Market Value (US$ Mn) and Forecast by End User, 2016–2021
Table 90: Europe Market Value (US$ Mn) and Forecast by End user, 2021–2031
Table 91: Europe Market Volume (Metric Tons) and Forecast by End User, 2016–2021
Table 92: Europe Market Volume (Metric Tons) and Forecast by End User, 2021–2031
Table 93: Europe Market Value (US$ Mn) and Forecast by Distribution Channel, 2016–2021
Table 94: Europe Market Value (US$ Mn) and Forecast by Distribution Channel, 2021–2031
Table 95: Europe Market Volume (Metric Tons) and Forecast by Distribution Channel, 2016–2021
Table 96: Europe Market Volume (Metric Tons) and Forecast by Distribution Channel, 2021–2031
Table 97: East Asia Texturized Protein Market Value Share (%) and BPS Analysis by Country, 2016 & 2021 & 2031
Table 98: East Asia Market Y-o-Y Analysis by Country, 2021 to 2031
Table 99: East Asia Market Attractiveness, by Country, 2021 to 2031
Table 100: East Asia Market Value Share (%) and BPS Analysis by Product Type, 2016 & 2021 & 2031
Table 101: East Asia Market Y-o-Y Analysis by Product Type, 2021 to 2031
Table 102: East Asia Market Attractiveness, by Product Type, 2021 to 2031
Table 103: East Asia Market Value Share (%) and BPS Analysis by Nature, 2016 & 2021 & 2031
Table 104: East Asia Market Y-o-Y Analysis by Nature, 2021 to 2031
Table 105: East Asia Market Attractiveness, by Nature, 2021 to 2031
Table 106: East Asia Market Value Share (%) and BPS Analysis by Form, 2016 & 2021 & 2031
Table 107: East Asia Market Y-o-Y Analysis by Form, 2021 to 2031
Table 108: East Asia Market Attractiveness, by Form, 2021 to 2031
Table 109: East Asia Market Value Share (%) and BPS Analysis by End- User, 2016 & 2021 & 2031
Table 110: East Asia Market Y-o-Y Analysis by End User, 2021 to 2031
Table 111: East Asia Market Attractiveness, by End User, 2021 to 2031
Table 112: East Asia Market Value Share (%) and BPS Analysis by Distribution Channel, 2016 & 2021 & 2031
Table 113: East Asia Market Y-o-Y Analysis by Distribution Channel, 2021 to 2031
Table 114: East Asia Market Attractiveness, by Distribution Channel, 2021 to 2031
Table 115: South Asia Market Value (US$ Mn) and Forecast by Country, 2016–2021
Table 116: South Asia Market Value (US$ Mn) and Forecast by Country, 2021–2031
Table 117: South Asia Market Volume (Metric Tons) and Forecast by Country, 2016–2021
Table 118: South Asia Market Volume (Metric Tons) and Forecast by Country, 2021–2031
Table 119: South Asia Market Value (US$ Mn) and Forecast by Product Type, 2016–2021
Table 120: South Asia Market Value (US$ Mn) and Forecast by Product Type, 2021–2031
Table 121: South Asia Market Volume (Metric Tons) and Forecast by Product Type, 2016–2021
Table 122: South Asia Market Volume (Metric Tons) and Forecast by Product Type, 2021–2031
Table 123: South Asia Market Value (US$ Mn) and Forecast by Nature, 2016–2021
Table 124: South Asia Market Value (US$ Mn) and Forecast by Nature, 2021–2031
Table 125: South Asia Market Volume (Metric Tons) and Forecast by Nature, 2016–2021
Table 126: South Asia Market Volume (Metric Tons) and Forecast by Nature, 2021–2031
Table 127: South Asia Market Value (US$ Mn) and Forecast by Form, 2016–2021
Table 128: South Asia Market Value (US$ Mn) and Forecast by Form, 2021–2031
Table 129: South Asia Market Volume (Metric Tons) and Forecast by Form, 2016–2021
Table 130: South Asia Market Volume (Metric Tons) and Forecast by Form, 2021–2031
Table 131: South Asia Market Value (US$ Mn) and Forecast by End User, 2016–2021
Table 132: South Asia Market Value (US$ Mn) and Forecast by End user, 2021–2031
Table 133: South Asia Market Volume (Metric Tons) and Forecast by End User, 2016–2021
Table 134: South Asia Market Volume (Metric Tons) and Forecast by End User, 2021–2031
Table 135: South Asia Market Value (US$ Mn) and Forecast by Distribution Channel, 2016–2021
Table 136: South Asia Market Value (US$ Mn) and Forecast by Distribution Channel, 2021–2031
Table 137: South Asia Market Volume (Metric Tons) and Forecast by Distribution Channel, 2016–2021
Table 138: South Asia Market Volume (Metric Tons) and Forecast by Distribution Channel, 2021–2031
Table 139: Oceania Market Value (US$ Mn) and Forecast by Country, 2016–2021
Table 140: Oceania Market Value (US$ Mn) and Forecast by Country, 2021–2031
Table 141: Oceania Market Volume (Metric Tons) and Forecast by Country, 2016–2021
Table 142: Oceania Market Volume (Metric Tons) and Forecast by Country, 2021–2031
Table 143: Oceania Market Value (US$ Mn) and Forecast by Product Type, 2016–2021
Table 144: Oceania Market Value (US$ Mn) and Forecast by Product Type, 2021–2031
Table 145: Oceania Market Volume (Metric Tons) and Forecast by Product Type, 2016–2021
Table 146: Oceania Market Volume (Metric Tons) and Forecast by Product Type, 2021–2031
Table 147: Oceania Market Value (US$ Mn) and Forecast by Nature, 2016–2021
Table 148: Oceania Market Value (US$ Mn) and Forecast by Nature, 2021–2031
Table 149: Oceania Market Volume (Metric Tons) and Forecast by Nature, 2016–2021
Table 150: Oceania Market Volume (Metric Tons) and Forecast by Nature, 2021–2031
Table 151: Oceania Market Value (US$ Mn) and Forecast by Form, 2016–2021
Table 152: Oceania Market Value (US$ Mn) and Forecast by Form, 2021–2031
Table 153: Oceania Market Volume (Metric Tons) and Forecast by Form, 2016–2021
Table 154: Oceania Market Volume (Metric Tons) and Forecast by Form, 2021–2031
Table 155: Oceania Market Value (US$ Mn) and Forecast by End User, 2016–2021
Table 156: Oceania Market Value (US$ Mn) and Forecast by End user, 2021–2031
Table 157: Oceania Market Volume (Metric Tons) and Forecast by End User, 2016–2021
Table 158: Oceania Market Volume (Metric Tons) and Forecast by End User, 2021–2031
Table 159: Oceania Market Value (US$ Mn) and Forecast by Distribution Channel, 2016–2021
Table 160: Oceania Market Value (US$ Mn) and Forecast by Distribution Channel, 2021–2031
Table 161: Oceania Market Volume (Metric Tons) and Forecast by Distribution Channel, 2016–2021
Table 162: Oceania Market Volume (Metric Tons) and Forecast by Distribution Channel, 2021–2031
Table 163: MEA Market Value (US$ Mn) and Forecast by Country, 2016–2021
Table 164: MEA Market Value (US$ Mn) and Forecast by Country, 2021–2031
Table 165: MEA Market Volume (Metric Tons) and Forecast by Country, 2016–2021
Table 166: MEA Market Volume (Metric Tons) and Forecast by Country, 2021–2031
Table 167: MEA Market Value (US$ Mn) and Forecast by Product Type, 2016–2021
Table 168: MEA Market Value (US$ Mn) and Forecast by Product Type, 2021–2031
Table 169: MEA Market Volume (Metric Tons) and Forecast by Product Type, 2016–2021
Table 170: MEA Market Volume (Metric Tons) and Forecast by Product Type, 2021–2031
Table 171: MEA Market Value (US$ Mn) and Forecast by Nature, 2016–2021
Table 172: MEA Market Value (US$ Mn) and Forecast by Nature, 2021–2031
Table 173: MEA Market Volume (Metric Tons) and Forecast by Nature, 2016–2021
Table 174: MEA Market Volume (Metric Tons) and Forecast by Nature, 2021–2031
Table 175: MEA Market Value (US$ Mn) and Forecast by Form, 2016–2021
Table 176: MEA Market Value (US$ Mn) and Forecast by Form, 2021–2031
Table 177: MEA Market Volume (Metric Tons) and Forecast by Form, 2016–2021
Table 178: MEA Market Volume (Metric Tons) and Forecast by Form, 2021–2031
Table 179: MEA Market Value (US$ Mn) and Forecast by End User, 2016–2021
Table 180: MEA Market Value (US$ Mn) and Forecast by End user, 2021–2031
Table 181: MEA Market Volume (Metric Tons) and Forecast by End User, 2016–2021
Table 182: MEA Market Volume (Metric Tons) and Forecast by End User, 2021–2031
Table 183: MEA Market Value (US$ Mn) and Forecast by Distribution Channel, 2016–2021
Table 184: MEA Market Value (US$ Mn) and Forecast by Distribution Channel, 2021–2031
Table 185: MEA Market Volume (Metric Tons) and Forecast by Distribution Channel, 2016–2021
Table 186: MEA Market Volume (Metric Tons) and Forecast by Distribution Channel, 2021–2031
Find your sweet spots for generating winning opportunities in this market.
Talk to AnalystList of Charts
Figure 1: Global Texturized Protein Market Value Share (%) and BPS Analysis by Region, 2016 & 2021 & 2031
Figure 2: Global Market Y-o-Y Analysis by Region, 2021 to 2031
Figure 3: Global Market Attractiveness, by Region, 2021 to 2031
Figure 4: Global Market Value Share (%) and BPS Analysis by Product Type, 2016 & 2021 & 2031
Figure 5: Global Market Y-o-Y Analysis by Product Type, 2021 to 2031
Figure 6: Global Market Attractiveness, by Product Type, 2021 to 2031
Figure 7: Global Market Value Share (%) and BPS Analysis by Nature, 2016 & 2021 & 2031
Figure 8: Global Market Y-o-Y Analysis by Nature, 2021 to 2031
Figure 9: Global Market Attractiveness, by Nature, 2021 to 2031
Figure 10: Global Market Value Share (%) and BPS Analysis by Form, 2016 & 2021 & 2031
Figure 11: Global Market Y-o-Y Analysis by Form, 2021 to 2031
Figure 12: Global Market Attractiveness, by Form, 2021 to 2031
Figure 13: Global Market Value Share (%) and BPS Analysis by End- User, 2016 & 2021 & 2031
Figure 14: Global Market Y-o-Y Analysis by End User, 2021 to 2031
Figure 15: Global Market Attractiveness, by End User, 2021 to 2031
Figure 16: Global Market Value Share (%) and BPS Analysis by Distribution Channel, 2016 & 2021 & 2031
Figure 17: Global Market Y-o-Y Analysis by Distribution Channel, 2021 to 2031
Figure 18: Global Market Attractiveness, by Distribution Channel, 2021 to 2031
Figure 19: North America Texturized Protein Market Value Share (%) and BPS Analysis by Country, 2016 & 2021 & 2031
Figure 20: North America Market Y-o-Y Analysis by Country, 2021 to 2031
Figure 21: North America Market Attractiveness, by Country, 2021 to 2031
Figure 22: North America Market Value Share (%) and BPS Analysis by Product Type, 2016 & 2021 & 2031
Figure 23: North America Market Y-o-Y Analysis by Product Type, 2021 to 2031
Figure 24: North America Market Attractiveness, by Product Type, 2021 to 2031
Figure 25: North America Market Value Share (%) and BPS Analysis by Nature, 2016 & 2021 & 2031
Figure 26: North America Market Y-o-Y Analysis by Nature, 2021 to 2031
Figure 27: North America Market Attractiveness, by Nature, 2021 to 2031
Figure 28: North America Market Value Share (%) and BPS Analysis by Form, 2016 & 2021 & 2031
Figure 29: North America Market Y-o-Y Analysis by Form, 2021 to 2031
Figure 30: North America Market Attractiveness, by Form, 2021 to 2031
Figure 31: North America Market Value Share (%) and BPS Analysis by End- User, 2016 & 2021 & 2031
Figure 32: North America Market Y-o-Y Analysis by End User, 2021 to 2031
Figure 33: North America Market Attractiveness, by End User, 2021 to 2031
Figure 34: North America Market Value Share (%) and BPS Analysis by Distribution Channel, 2016 & 2021 & 2031
Figure 35: North America Market Y-o-Y Analysis by Distribution Channel, 2021 to 2031
Figure 36: North America Market Attractiveness, by Distribution Channel, 2021 to 2031
Figure 37: Latin America Texturized Protein Market Value Share (%) and BPS Analysis by Country, 2016 & 2021 & 2031
Figure 38: Latin America Market Y-o-Y Analysis by Country, 2021 to 2031
Figure 39: Latin America Market Attractiveness, by Country, 2021 to 2031
Figure 40: Latin America Market Value Share (%) and BPS Analysis by Product Type, 2016 & 2021 & 2031
Figure 41: Latin America Market Y-o-Y Analysis by Product Type, 2021 to 2031
Figure 42: Latin America Market Attractiveness, by Product Type, 2021 to 2031
Figure 43: Latin America Market Value Share (%) and BPS Analysis by Nature, 2016 & 2021 & 2031
Figure 44: Latin America Market Y-o-Y Analysis by Nature, 2021 to 2031
Figure 45: Latin America Market Attractiveness, by Nature, 2021 to 2031
Figure 46: Latin America Market Value Share (%) and BPS Analysis by Form, 2016 & 2021 & 2031
Figure 47: Latin America Market Y-o-Y Analysis by Form, 2021 to 2031
Figure 48: Latin America Market Attractiveness, by Form, 2021 to 2031
Figure 49: Latin America Market Value Share (%) and BPS Analysis by End- User, 2016 & 2021 & 2031
Figure 50: Latin America Market Y-o-Y Analysis by End User, 2021 to 2031
Figure 51: Latin America Market Attractiveness, by End User, 2021 to 2031
Figure 52: Latin America Market Value Share (%) and BPS Analysis by Distribution Channel, 2016 & 2021 & 2031
Figure 53: Latin America Market Y-o-Y Analysis by Distribution Channel, 2021 to 2031
Figure 54: Latin America Market Attractiveness, by Distribution Channel, 2021 to 2031
Figure 55: Europe Texturized Protein Market Value Share (%) and BPS Analysis by Country, 2016 & 2021 & 2031
Figure 56: Europe Market Y-o-Y Analysis by Country, 2021 to 2031
Figure 57: Europe Market Attractiveness, by Country, 2021 to 2031
Figure 58: Europe Market Value Share (%) and BPS Analysis by Product Type, 2016 & 2021 & 2031
Figure 59: Europe Market Y-o-Y Analysis by Product Type, 2021 to 2031
Figure 60: Europe Market Attractiveness, by Product Type, 2021 to 2031
Figure 61: Europe Market Value Share (%) and BPS Analysis by Nature, 2016 & 2021 & 2031
Figure 62: Europe Market Y-o-Y Analysis by Nature, 2021 to 2031
Figure 63: Europe Market Attractiveness, by Nature, 2021 to 2031
Figure 64: Europe Market Value Share (%) and BPS Analysis by Form, 2016 & 2021 & 2031
Figure 65: Europe Market Y-o-Y Analysis by Form, 2021 to 2031
Figure 66: Europe Market Attractiveness, by Form, 2021 to 2031
Figure 67: Europe Market Value Share (%) and BPS Analysis by End- User, 2016 & 2021 & 2031
Figure 68: Europe Market Y-o-Y Analysis by End User, 2021 to 2031
Figure 69: Europe Market Attractiveness, by End User, 2021 to 2031
Figure 70: Europe Market Value Share (%) and BPS Analysis by Distribution Channel, 2016 & 2021 & 2031
Figure 71: Europe Market Y-o-Y Analysis by Distribution Channel, 2021 to 2031
Figure 72: Europe Market Attractiveness, by Distribution Channel, 2021 to 2031
Figure 73: East Asia Texturized Protein Market Value Share (%) and BPS Analysis by Country, 2016 & 2021 & 2031
Figure 74: East Asia Market Y-o-Y Analysis by Country, 2021 to 2031
Figure 75: East Asia Market Attractiveness, by Country, 2021 to 2031
Figure 76: East Asia Market Value Share (%) and BPS Analysis by Product Type, 2016 & 2021 & 2031
Figure 77: East Asia Market Y-o-Y Analysis by Product Type, 2021 to 2031
Figure 78: East Asia Market Attractiveness, by Product Type, 2021 to 2031
Figure 79: East Asia Market Value Share (%) and BPS Analysis by Nature, 2016 & 2021 & 2031
Figure 80: East Asia Market Y-o-Y Analysis by Nature, 2021 to 2031
Figure 81: East Asia Market Attractiveness, by Nature, 2021 to 2031
Figure 82: East Asia Market Value Share (%) and BPS Analysis by Form, 2016 & 2021 & 2031
Figure 83: East Asia Market Y-o-Y Analysis by Form, 2021 to 2031
Figure 84: East Asia Market Attractiveness, by Form, 2021 to 2031
Figure 85: East Asia Market Value Share (%) and BPS Analysis by End- User, 2016 & 2021 & 2031
Figure 86: East Asia Market Y-o-Y Analysis by End User, 2021 to 2031
Figure 87: East Asia Market Attractiveness, by End User, 2021 to 2031
Figure 88: East Asia Market Value Share (%) and BPS Analysis by Distribution Channel, 2016 & 2021 & 2031
Figure 89: East Asia Market Y-o-Y Analysis by Distribution Channel, 2021 to 2031
Figure 90: East Asia Market Attractiveness, by Distribution Channel, 2021 to 2031
Figure 91: South Asia Texturized Protein Market Value Share (%) and BPS Analysis by Country, 2016 & 2021 & 2031
Figure 92: South Asia Market Y-o-Y Analysis by Country, 2021 to 2031
Figure 93: South Asia Market Attractiveness, by Country, 2021 to 2031
Figure 94: South Asia Market Value Share (%) and BPS Analysis by Product Type, 2016 & 2021 & 2031
Figure 95: South Asia Market Y-o-Y Analysis by Product Type, 2021 to 2031
Figure 96: South Asia Market Attractiveness, by Product Type, 2021 to 2031
Figure 97: South Asia Market Value Share (%) and BPS Analysis by Nature, 2016 & 2021 & 2031
Figure 98: South Asia Market Y-o-Y Analysis by Nature, 2021 to 2031
Figure 99: South Asia Market Attractiveness, by Nature, 2021 to 2031
Figure 100: South Asia Market Value Share (%) and BPS Analysis by Form, 2016 & 2021 & 2031
Figure 101: South Asia Market Y-o-Y Analysis by Form, 2021 to 2031
Figure 102: South Asia Market Attractiveness, by Form, 2021 to 2031
Figure 103: South Asia Market Value Share (%) and BPS Analysis by End- User, 2016 & 2021 & 2031
Figure 104: South Asia Market Y-o-Y Analysis by End User, 2021 to 2031
Figure 105: South Asia Market Attractiveness, by End User, 2021 to 2031
Figure 106: South Asia Market Value Share (%) and BPS Analysis by Distribution Channel, 2016 & 2021 & 2031
Figure 107: South Asia Market Y-o-Y Analysis by Distribution Channel, 2021 to 2031
Figure 108: South Asia Market Attractiveness, by Distribution Channel, 2021 to 2031
Figure 109: Oceania Texturized Protein Market Value Share (%) and BPS Analysis by Country, 2016 & 2021 & 2031
Figure 110: Oceania Market Y-o-Y Analysis by Country, 2021 to 2031
Figure 111: Oceania Market Attractiveness, by Country, 2021 to 2031
Figure 112: Oceania Market Value Share (%) and BPS Analysis by Product Type, 2016 & 2021 & 2031
Figure 113: Oceania Market Y-o-Y Analysis by Product Type, 2021 to 2031
Figure 114: Oceania Market Attractiveness, by Product Type, 2021 to 2031
Figure 115: Oceania Market Value Share (%) and BPS Analysis by Nature, 2016 & 2021 & 2031
Figure 116: Oceania Market Y-o-Y Analysis by Nature, 2021 to 2031
Figure 117: Oceania Market Attractiveness, by Nature, 2021 to 2031
Figure 118: Oceania Market Value Share (%) and BPS Analysis by Form, 2016 & 2021 & 2031
Figure 119: Oceania Market Y-o-Y Analysis by Form, 2021 to 2031
Figure 120: Oceania Market Attractiveness, by Form, 2021 to 2031
Figure 121: Oceania Market Value Share (%) and BPS Analysis by End- User, 2016 & 2021 & 2031
Figure 122: Oceania Market Y-o-Y Analysis by End User, 2021 to 2031
Figure 123: Oceania Market Attractiveness, by End User, 2021 to 2031
Figure 124: Oceania Market Value Share (%) and BPS Analysis by Distribution Channel, 2016 & 2021 & 2031
Figure 125: Oceania Market Y-o-Y Analysis by Distribution Channel, 2021 to 2031
Figure 126: Oceania Market Attractiveness, by Distribution Channel, 2021 to 2031
Figure 127: MEA Texturized Protein Market Value Share (%) and BPS Analysis by Country, 2016 & 2021 & 2031
Figure 128: MEA Market Y-o-Y Analysis by Country, 2021 to 2031
Figure 129: MEA Market Attractiveness, by Country, 2021 to 2031
Figure 130: MEA Market Value Share (%) and BPS Analysis by Product Type, 2016 & 2021 & 2031
Figure 131: MEA Market Y-o-Y Analysis by Product Type, 2021 to 2031
Figure 132: MEA Market Attractiveness, by Product Type, 2021 to 2031
Figure 133: MEA Market Value Share (%) and BPS Analysis by Nature, 2016 & 2021 & 2031
Figure 134: MEA Market Y-o-Y Analysis by Nature, 2021 to 2031
Figure 135: MEA Market Attractiveness, by Nature, 2021 to 2031
Figure 136: MEA Market Value Share (%) and BPS Analysis by Form, 2016 & 2021 & 2031
Figure 137: MEA Market Y-o-Y Analysis by Form, 2021 to 2031
Figure 138: MEA Market Attractiveness, by Form, 2021 to 2031
Figure 139: MEA Market Value Share (%) and BPS Analysis by End- User, 2016 & 2021 & 2031
Figure 140: MEA Market Y-o-Y Analysis by End User, 2021 to 2031
Figure 141: MEA Market Attractiveness, by End User, 2021 to 2031
Figure 142: MEA Market Value Share (%) and BPS Analysis by Distribution Channel, 2016 & 2021 & 2031
Figure 143: MEA Market Y-o-Y Analysis by Distribution Channel, 2021 to 2031
Figure 144: MEA Market Attractiveness, by Distribution Channel, 2021 to 2031
Need specific information?
Request CustomizationExplore Food and Beverage Insights
View Reports