Reports

- Global Locations -

Headquarters

Future Market Insights, Inc.

Christiana Corporate, 200
Continental Drive, Suite 401,
Newark, Delaware - 19713,
United States

T: +1-845-579-5705

Americas

Future Market Insights, Inc.

616 Corporate Way, Suite 2-9018,
Valley Cottage, NY 10989, United States

T: +1-347-918-3531

MEA

Future Market Insights

1602-6 Jumeirah Bay X2 Tower, Plot No: JLT-PH2-X2A,
Jumeirah Lakes Towers, Dubai,
United Arab Emirates

Europe

Future Market Insights

3rd Floor, 207 Regent Street,
W1B 3HH London
United Kingdom

T: + 44 (0) 20 8123 9659
D: +44 (0) 20 3287 4268

Asia Pacific

Future Market Insights

IndiaLand Global Tech Park, Unit UG-1, Behind Grand HighStreet, Phase 1, Hinjawadi, MH, Pune – 411057, India

Bruxism Management Market Snapshot (2022-2032)

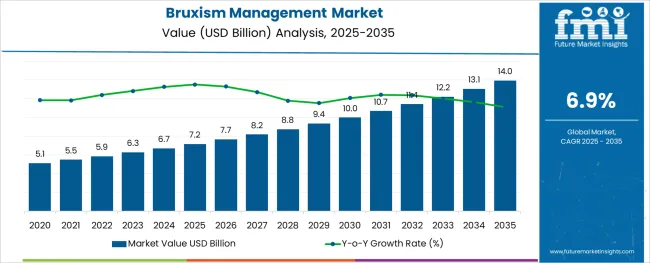
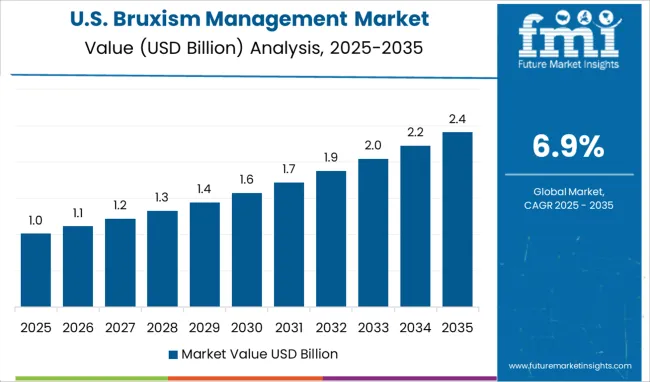
[250 Pages Report] The global bruxism management market is anticipated to grow at a fast pace by reaching US$ 5.3 Billion in 2022. As per Future Market Insights (FMI), the market is likely to be valued at US$ 10.1 Billion in 2032 and exhibit growth at a CAGR of 6.9% in the forecast period from 2022 to 2032. The rising prevalence of obstructive sleep apnea is set to augment the demand for bruxism management techniques in the near future.

Report Attribute Details
Bruxism Management Market Estimated Base Year Value (2021) US$ 4.8 Billion
Bruxism Management Market Expected Market Value (2022) US$ 5.3 Billion
Bruxism Management Market Anticipated Forecast Value (2032) US$ 10.1 Billion
Bruxism Management Market Projected Growth Rate (2022 to 2032) 6.9% CAGR

Bruxism is when a person clenches, grinds, or gnashes their teeth while not chewing. It often occurs during sleep, but it can also happen during waking hours. The person is usually not consciously aware that they are doing it.

Various symptoms of bruxism include broken or loose fillings, a dull headache, facial pain, worn teeth, jaw pain, and similar others. It is a common condition in young children when their teeth are growing.

Another main cause of bruxism in adults is stress. The usage of caffeine and alcohol can also lead to bruxism. In some individuals, it happens if they have a missing tooth or if their bite is not aligned.

Don't pay for what you don't need

Customize your report by selecting specific countries or regions and save 30%!

Is the Rising Prevalence of Sleep Apnea Pushing Bruxism Management Market Growth

The rising prevalence of neurological disorders, such as Parkinson’s and Huntington’s disease among the geriatric population is a vital factor that is likely to push sales of bruxism management devices in the evaluation period. As per Parkinson’s Foundation, more than 10 million people are currently living with the disease across the globe. This number is estimated to grow at a steady pace, thereby propelling the market.

In addition to that, the growing cases of sleep apnea are expected to contribute to the global market growth. The American Sleep Apnea Association mentions that about 22 million people suffer from sleep apnea every year in the U.S. alone. Out of this, nearly 80% cases of severe and moderate obstructive sleep apnea remain undiagnosed. Spurred by the aforementioned factors, the global market is set to grow at a fast pace.

Which Factors May Hamper the Bruxism Management Market Growth

Researchers have found that medications are not very effective for the treatment of bruxism. Thus, they are striving to manage the consequences of this condition by promoting preventative measures. It involves the utilization of occlusal splints, mandibular advancement devices, stress management, and similar other devices.

A wide range of medications and muscle relaxants are being used to treat sleep bruxism. However, these medications can cause numerous side-effects, such as muscle weakness, nausea, and constipation. Also, bruxism mouth guards often ground down with time. The unavailability of effective treatment options may hence hamper the global bruxism management market growth.
Sabyasachi Ghosh
Sabyasachi Ghosh

Principal Consultant

Talk to Analyst

Find your sweet spots for generating winning opportunities in this market.

Why is Surging Anxiety Affecting the North America Bruxism Management Market

North America is set to dominate in the near future by accounting for the largest bruxism management market share. Rising stress and anxiety among the populaces in the U.S. and Canada is one of the major factors that is expected to bode well for the regional market. 

As per the National Alliance on Mental Illness, more than 40 million adults have an anxiety disorder in the U.S. Likewise, nearly 7% of children belonging to the age group of 3 to 17 years, experience various issues with anxiety every year in the country. This trend is projected to continue throughout the forthcoming years, thereby boosting the regional market.
How is the Entry of New Players Fueling the Asia Pacific Bruxism Management Market

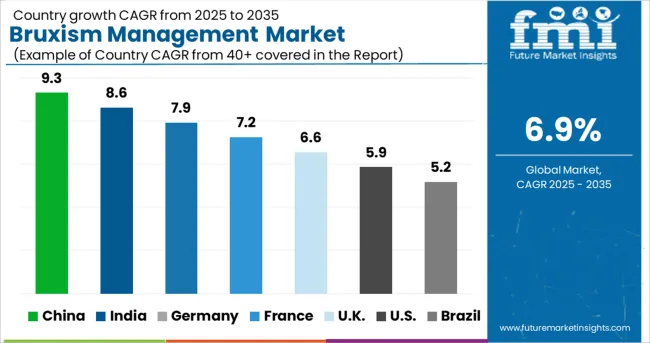
At present, Asia Pacific has a relatively low penetration for bruxism treatment products. Governments of various countries, such as India, China, South Korea, and Japan are investing huge sums to develop their healthcare infrastructure. Many international companies are expected to set up their manufacturing facilities in these countries owing to the easy availability of low-cost labor and raw materials.

The increasing prevalence of sleeping bruxism across Asia Pacific is another major factor that is set to fuel the growth. The rising workplace stress and rapidly changing lifestyle in this region are also projected to expand the Asia Pacific bruxism management market size.
Get the data you need at a Fraction of the cost

Personalize your report by choosing insights you need
and save 40%!

Market Competition

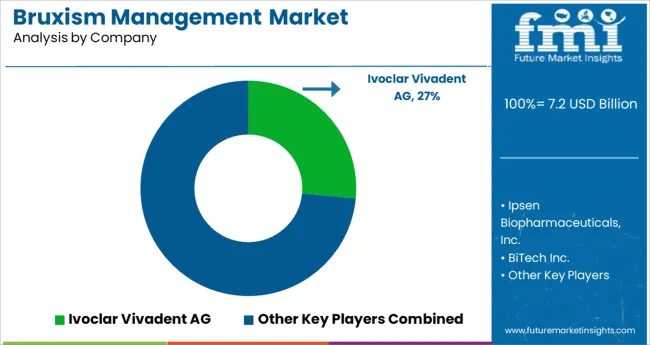
Some of the renowned companies present in the global bruxism management market are F. Hoffmann-La Roche AG, GlaxoSmithKline plc, Eli Lilly and Company, Mayne Pharma, Cadila Pharmaceuticals, Teva Pharmaceutical Industries Ltd., Pfizer, Endo International plc, Akervall Technologies, Inc., and Mylan N.V. among others.

Majority of the companies operating in the global market are increasingly focusing on research and development activities to introduce cutting-edge bruxism treatment options. The market is projected to witness the entry of several start-up companies that would target the infant population and come up with new medications for them.

In June 2021, for instance, SelfSense Technologies, an Irish start-up firm, announced its plan to close a €1 million funding round by launching its new intelligent mouth guards in Europe and Ireland. The company aims to cater to the needs of patients suffering from bruxism by providing them with innovative guards. Thus, the increasing number of new product launches by start-up companies is set to propel the growth in this market.

Report Scope

Report Attribute Details
Growth Rate CAGR of 6.9% from 2022 to 2032
Base Year for Estimation 2021
Historical Data 2015 to 2020
Forecast Period 2022 to 2032
Quantitative Units Revenue in USD Million and CAGR from 2022 to 2032
Report Coverage Revenue Forecast, Volume Forecast, Company Ranking, Competitive Landscape, Growth Factors, Trends and Pricing Analysis
Segments Covered
  • Type
  • Treatment Type
  • Cause
  • Distribution Channel
  • Region
Regions Covered
  • North America
  • Latin America
  • Western Europe
  • Eastern Europe
  • APEJ
  • Japan
  • Middle East and Africa
Key Countries Profiled
  • USA
  • Canada
  • Brazil
  • Argentina
  • Germany
  • UK
  • France
  • Spain
  • Italy
  • Nordics
  • BENELUX
  • Australia & New Zealand
  • China
  • India
  • ASEAN
  • GCC
  • South Africa
Key Companies Profiled
  • F. Hoffmann-La Roche AG
  • GlaxoSmithKline plc
  • Eli Lilly and Company
  • Mayne Pharma
  • Cadila Pharmaceuticals
  • Teva Pharmaceutical Industries Ltd.
  • Pfizer
  • Endo International plc
  • Akervall Technologies, Inc.
  • Mylan N.V.
Customization Available Upon Request

Key Segments Profiled in the Bruxism Management Industry Survey

By Type:

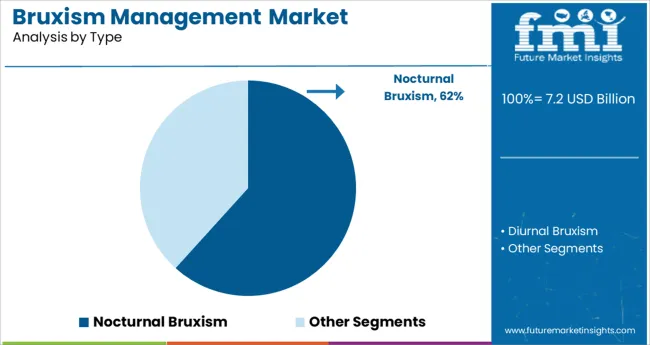
  • Diurnal Bruxism
  • Nocturnal Bruxism

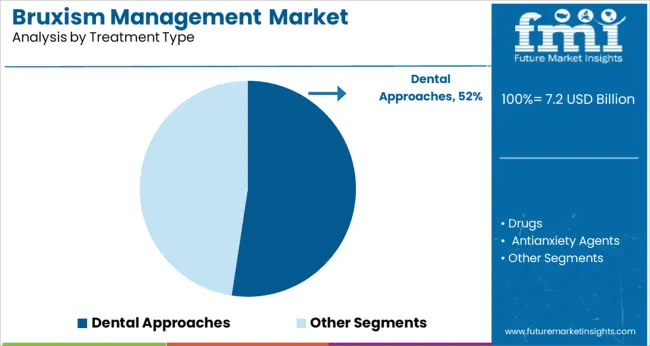
By Treatment Type:

  • Drugs
  • Antianxiety Agents
  • Tranquilizers
  • Sedatives
  • Muscle Relaxants
  • Dental Approaches
  • Occlusal Splint
  • Mouth Guard

By Cause:

  • Obstructive Sleep Apnea
  • Sleep Paralysis
  • Malocclusion
  • Gastroesophageal Reflux Disease (GERD)
  • Depression
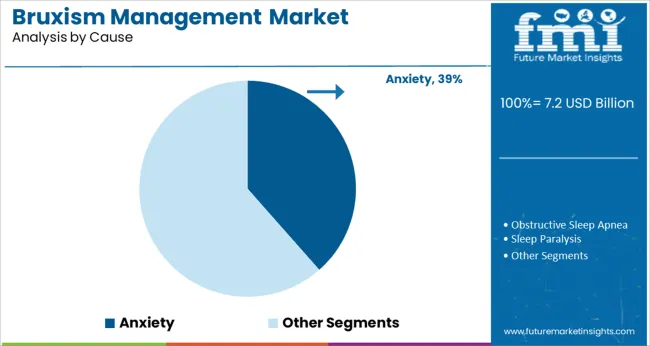
  • Anxiety
  • Others

By Distribution Channel:

  • Institutional Sales
  • Hospital
  • Dental Clinic
  • Retail Sales
  • Drug Store
  • Retail Store
  • Supermarket
  • Mail Order Pharmacies

By Region:

  • North America
  • Latin America
  • Western Europe
  • Eastern Europe
  • APEJ
  • Japan
  • Middle East and Africa

Frequently Asked Questions

At what rate will the bruxism management market grow until 2032?

The global bruxism management market is anticipated to reach US$ 10.1 Billion in 2032.

Which region is set to lead the bruxism management market?

North America is set to lead the bruxism management market in the forecast period.

Which are some of the renowned companies in the bruxism management market?

F. Hoffmann-La Roche AG, GlaxoSmithKline plc, Eli Lilly and Company, Mayne Pharma, Cadila Pharmaceuticals, and Teva Pharmaceutical Industries Ltd. are some of the renowned companies in the bruxism management market.

Table of Content

1. Executive Summary

    1.1. Global Market Outlook

    1.2. Demand-side Trends

    1.3. Supply-side Trends

    1.4. Technology Roadmap Analysis

    1.5. Analysis and Recommendations

2. Market Overview

    2.1. Market Coverage / Taxonomy

    2.2. Market Definition / Scope / Limitations

3. Market Background

    3.1. Market Dynamics

        3.1.1. Drivers

        3.1.2. Restraints

        3.1.3. Opportunity

        3.1.4. Trends

    3.2. Scenario Forecast

        3.2.1. Demand in Optimistic Scenario

        3.2.2. Demand in Likely Scenario

        3.2.3. Demand in Conservative Scenario

    3.3. Opportunity Map Analysis

    3.4. Product Life Cycle Analysis

    3.5. Supply Chain Analysis

        3.5.1. Supply Side Participants and their Roles

            3.5.1.1. Producers

            3.5.1.2. Mid-Level Participants (Traders/ Agents/ Brokers)

            3.5.1.3. Wholesalers and Distributors

        3.5.2. Value Added and Value Created at Node in the Supply Chain

        3.5.3. List of Raw Material Suppliers

        3.5.4. List of Existing and Potential Buyer’s

    3.6. Investment Feasibility Matrix

    3.7. Value Chain Analysis

        3.7.1. Profit Margin Analysis

        3.7.2. Wholesalers and Distributors

        3.7.3. Retailers

    3.8. PESTLE and Porter’s Analysis

    3.9. Regulatory Landscape

        3.9.1. By Key Regions

        3.9.2. By Key Countries

    3.10. Regional Parent Market Outlook

    3.11. Production and Consumption Statistics

    3.12. Import and Export Statistics

4. Global Bruxism Management Market Analysis 2017-2021 and Forecast, 2022-2032

    4.1. Historical Market Size Value (US$ Mn) & Volume (Units) Analysis, 2017-2021

    4.2. Current and Future Market Size Value (US$ Mn) & Volume (Units) Projections, 2022-2032

        4.2.1. Y-o-Y Growth Trend Analysis

        4.2.2. Absolute $ Opportunity Analysis

5. Global Bruxism Management Market Analysis 2017-2021 and Forecast 2022-2032, By Product Type

    5.1. Introduction / Key Findings

    5.2. Historical Market Size Value (US$ Mn) & Volume (Units) Analysis By Product Type, 2017-2021

    5.3. Current and Future Market Size Value (US$ Mn) & Volume (Units) Analysis and Forecast By Product Type, 2022-2032

        5.3.1. Mouth Guards

        5.3.2. Electric Stimulators

    5.4. Y-o-Y Growth Trend Analysis By Product Type, 2017-2021

    5.5. Absolute $ Opportunity Analysis By Product Type, 2022-2032

Deep-dive segmentation will be available in the sample on request

6. Global Bruxism Management Market Analysis 2017-2021 and Forecast 2022-2032, By Indication

    6.1. Introduction / Key Findings

    6.2. Historical Market Size Value (US$ Mn) & Volume (Units) Analysis By Indication, 2017-2021

    6.3. Current and Future Market Size Value (US$ Mn) & Volume (Units) Analysis and Forecast By Indication, 2022-2032

        6.3.1. Awake Bruxism

        6.3.2. Sleep Bruxism

    6.4. Y-o-Y Growth Trend Analysis By Indication, 2017-2021

    6.5. Absolute $ Opportunity Analysis By Indication, 2022-2032

Deep-dive segmentation will be available in the sample on request

7. Global Bruxism Management Market Analysis 2017-2021 and Forecast 2022-2032, By End User

    7.1. Introduction / Key Findings

    7.2. Historical Market Size Value (US$ Mn) & Volume (Units) Analysis By End User, 2017-2021

    7.3. Current and Future Market Size Value (US$ Mn) & Volume (Units) Analysis and Forecast By End User, 2022-2032

        7.3.1. Dental Clinics

        7.3.2. Hospitals

        7.3.3. Sleep Centers

        7.3.4. Home Care Settings

    7.4. Y-o-Y Growth Trend Analysis By End User, 2017-2021

    7.5. Absolute $ Opportunity Analysis By End User, 2022-2032

Deep-dive segmentation will be available in the sample on request

8. Global Bruxism Management Market Analysis 2017-2021 and Forecast 2022-2032, By Region

    8.1. Introduction

    8.2. Historical Market Size Value (US$ Mn) & Volume (Units) Analysis By Region, 2017-2021

    8.3. Current Market Size Value (US$ Mn) & Volume (Units) Analysis and Forecast By Region, 2022-2032

        8.3.1. North America

        8.3.2. Latin America

        8.3.3. Europe

        8.3.4. East Asia

        8.3.5. South Asia & Pacific

        8.3.6. MEA

    8.4. Market Attractiveness Analysis By Region

9. North America Bruxism Management Market Analysis 2017-2021 and Forecast 2022-2032, By Country

    9.1. Historical Market Size Value (US$ Mn) & Volume (Units) Trend Analysis By Market Taxonomy, 2017-2021

    9.2. Market Size Value (US$ Mn) & Volume (Units) Forecast By Market Taxonomy, 2022-2032

        9.2.1. By Country

            9.2.1.1. U.S.

            9.2.1.2. Canada

        9.2.2. By Product Type

        9.2.3. By Indication

        9.2.4. By End User

    9.3. Market Attractiveness Analysis

        9.3.1. By Country

        9.3.2. By Product Type

        9.3.3. By Indication

        9.3.4. By End User

    9.4. Key Takeaways

10. Latin America Bruxism Management Market Analysis 2017-2021 and Forecast 2022-2032, By Country

    10.1. Historical Market Size Value (US$ Mn) & Volume (Units) Trend Analysis By Market Taxonomy, 2017-2021

    10.2. Market Size Value (US$ Mn) & Volume (Units) Forecast By Market Taxonomy, 2022-2032

        10.2.1. By Country

            10.2.1.1. Mexico

            10.2.1.2. Brazil

            10.2.1.3. Rest of Latin America

        10.2.2. By Product Type

        10.2.3. By Indication

        10.2.4. By End User

    10.3. Market Attractiveness Analysis

        10.3.1. By Country

        10.3.2. By Product Type

        10.3.3. By Indication

        10.3.4. By End User

    10.4. Key Takeaways

11. Europe Bruxism Management Market Analysis 2017-2021 and Forecast 2022-2032, By Country

    11.1. Historical Market Size Value (US$ Mn) & Volume (Units) Trend Analysis By Market Taxonomy, 2017-2021

    11.2. Market Size Value (US$ Mn) & Volume (Units) Forecast By Market Taxonomy, 2022-2032

        11.2.1. By Country

            11.2.1.1. Germany

            11.2.1.2. Italy

            11.2.1.3. France

            11.2.1.4. U.K.

            11.2.1.5. Spain

            11.2.1.6. BENELUX

            11.2.1.7. Russia

            11.2.1.8. Rest of Europe

        11.2.2. By Product Type

        11.2.3. By Indication

        11.2.4. By End User

    11.3. Market Attractiveness Analysis

        11.3.1. By Country

        11.3.2. By Product Type

        11.3.3. By Indication

        11.3.4. By End User

    11.4. Key Takeaways

12. East Asia Bruxism Management Market Analysis 2017-2021 and Forecast 2022-2032, By Country

    12.1. Historical Market Size Value (US$ Mn) & Volume (Units) Trend Analysis By Market Taxonomy, 2017-2021

    12.2. Market Size Value (US$ Mn) & Volume (Units) Forecast By Market Taxonomy, 2022-2032

        12.2.1. By Country

            12.2.1.1. China

            12.2.1.2. Japan

            12.2.1.3. South Korea

        12.2.2. By Product Type

        12.2.3. By Indication

        12.2.4. By End User

    12.3. Market Attractiveness Analysis

        12.3.1. By Country

        12.3.2. By Product Type

        12.3.3. By Indication

        12.3.4. By End User

    12.4. Key Takeaways

13. South Asia & Pacific Bruxism Management Market Analysis 2017-2021 and Forecast 2022-2032, By Country

    13.1. Historical Market Size Value (US$ Mn) & Volume (Units) Trend Analysis By Market Taxonomy, 2017-2021

    13.2. Market Size Value (US$ Mn) & Volume (Units) Forecast By Market Taxonomy, 2022-2032

        13.2.1. By Country

            13.2.1.1. India

            13.2.1.2. ASEAN

            13.2.1.3. Australia and New Zealand

            13.2.1.4. Rest of South Asia & Pacific

        13.2.2. By Product Type

        13.2.3. By Indication

        13.2.4. By End User

    13.3. Market Attractiveness Analysis

        13.3.1. By Country

        13.3.2. By Product Type

        13.3.3. By Indication

        13.3.4. By End User

    13.4. Key Takeaways

14. MEA Bruxism Management Market Analysis 2017-2021 and Forecast 2022-2032, By Country

    14.1. Historical Market Size Value (US$ Mn) & Volume (Units) Trend Analysis By Market Taxonomy, 2017-2021

    14.2. Market Size Value (US$ Mn) & Volume (Units) Forecast By Market Taxonomy, 2022-2032

        14.2.1. By Country

            14.2.1.1. GCC Countries

            14.2.1.2. Turkey

            14.2.1.3. South Africa

            14.2.1.4. Rest of MEA

        14.2.2. By Product Type

        14.2.3. By Indication

        14.2.4. By End User

    14.3. Market Attractiveness Analysis

        14.3.1. By Country

        14.3.2. By Product Type

        14.3.3. By Indication

        14.3.4. By End User

    14.4. Key Takeaways

15. Key Countries Bruxism Management Market Analysis

    15.1. U.S.

        15.1.1. Pricing Analysis

        15.1.2. Market Share Analysis, 2021

            15.1.2.1. By Product Type

            15.1.2.2. By Indication

            15.1.2.3. By End User

    15.2. Canada

        15.2.1. Pricing Analysis

        15.2.2. Market Share Analysis, 2021

            15.2.2.1. By Product Type

            15.2.2.2. By Indication

            15.2.2.3. By End User

    15.3. Mexico

        15.3.1. Pricing Analysis

        15.3.2. Market Share Analysis, 2021

            15.3.2.1. By Product Type

            15.3.2.2. By Indication

            15.3.2.3. By End User

    15.4. Brazil

        15.4.1. Pricing Analysis

        15.4.2. Market Share Analysis, 2021

            15.4.2.1. By Product Type

            15.4.2.2. By Indication

            15.4.2.3. By End User

    15.5. Germany

        15.5.1. Pricing Analysis

        15.5.2. Market Share Analysis, 2021

            15.5.2.1. By Product Type

            15.5.2.2. By Indication

            15.5.2.3. By End User

    15.6. Italy

        15.6.1. Pricing Analysis

        15.6.2. Market Share Analysis, 2021

            15.6.2.1. By Product Type

            15.6.2.2. By Indication

            15.6.2.3. By End User

    15.7. France

        15.7.1. Pricing Analysis

        15.7.2. Market Share Analysis, 2021

            15.7.2.1. By Product Type

            15.7.2.2. By Indication

            15.7.2.3. By End User

    15.8. U.K.

        15.8.1. Pricing Analysis

        15.8.2. Market Share Analysis, 2021

            15.8.2.1. By Product Type

            15.8.2.2. By Indication

            15.8.2.3. By End User

    15.9. Spain

        15.9.1. Pricing Analysis

        15.9.2. Market Share Analysis, 2021

            15.9.2.1. By Product Type

            15.9.2.2. By Indication

            15.9.2.3. By End User

    15.10. BENELUX

        15.10.1. Pricing Analysis

        15.10.2. Market Share Analysis, 2021

            15.10.2.1. By Product Type

            15.10.2.2. By Indication

            15.10.2.3. By End User

    15.11. Russia

        15.11.1. Pricing Analysis

        15.11.2. Market Share Analysis, 2021

            15.11.2.1. By Product Type

            15.11.2.2. By Indication

            15.11.2.3. By End User

    15.12. China

        15.12.1. Pricing Analysis

        15.12.2. Market Share Analysis, 2021

            15.12.2.1. By Product Type

            15.12.2.2. By Indication

            15.12.2.3. By End User

    15.13. Japan

        15.13.1. Pricing Analysis

        15.13.2. Market Share Analysis, 2021

            15.13.2.1. By Product Type

            15.13.2.2. By Indication

            15.13.2.3. By End User

    15.14. South Korea

        15.14.1. Pricing Analysis

        15.14.2. Market Share Analysis, 2021

            15.14.2.1. By Product Type

            15.14.2.2. By Indication

            15.14.2.3. By End User

    15.15. India

        15.15.1. Pricing Analysis

        15.15.2. Market Share Analysis, 2021

            15.15.2.1. By Product Type

            15.15.2.2. By Indication

            15.15.2.3. By End User

    15.16. ASEAN

        15.16.1. Pricing Analysis

        15.16.2. Market Share Analysis, 2021

            15.16.2.1. By Product Type

            15.16.2.2. By Indication

            15.16.2.3. By End User

    15.17. Australia and New Zealand

        15.17.1. Pricing Analysis

        15.17.2. Market Share Analysis, 2021

            15.17.2.1. By Product Type

            15.17.2.2. By Indication

            15.17.2.3. By End User

    15.18. GCC Countries

        15.18.1. Pricing Analysis

        15.18.2. Market Share Analysis, 2021

            15.18.2.1. By Product Type

            15.18.2.2. By Indication

            15.18.2.3. By End User

    15.19. Turkey

        15.19.1. Pricing Analysis

        15.19.2. Market Share Analysis, 2021

            15.19.2.1. By Product Type

            15.19.2.2. By Indication

            15.19.2.3. By End User

    15.20. South Africa

        15.20.1. Pricing Analysis

        15.20.2. Market Share Analysis, 2021

            15.20.2.1. By Product Type

            15.20.2.2. By Indication

            15.20.2.3. By End User

16. Market Structure Analysis

    16.1. Competition Dashboard

    16.2. Competition Benchmarking

    16.3. Market Share Analysis of Top Players

        16.3.1. By Regional

        16.3.2. By Product Type

        16.3.3. By Indication

        16.3.4. By End User

17. Competition Analysis

    17.1. Competition Deep Dive

        17.1.1. Ivoclar Vivadent AG

            17.1.1.1. Overview

            17.1.1.2. Product Portfolio

            17.1.1.3. Profitability by Market Segments

            17.1.1.4. Sales Footprint

            17.1.1.5. Strategy Overview

                17.1.1.5.1. Marketing Strategy

                17.1.1.5.2. Product Strategy

                17.1.1.5.3. Channel Strategy

        17.1.2. Ipsen Biopharmaceuticals, Inc.

            17.1.2.1. Overview

            17.1.2.2. Product Portfolio

            17.1.2.3. Profitability by Market Segments

            17.1.2.4. Sales Footprint

            17.1.2.5. Strategy Overview

                17.1.2.5.1. Marketing Strategy

                17.1.2.5.2. Product Strategy

                17.1.2.5.3. Channel Strategy

        17.1.3. BiTech Inc.

            17.1.3.1. Overview

            17.1.3.2. Product Portfolio

            17.1.3.3. Profitability by Market Segments

            17.1.3.4. Sales Footprint

            17.1.3.5. Strategy Overview

                17.1.3.5.1. Marketing Strategy

                17.1.3.5.2. Product Strategy

                17.1.3.5.3. Channel Strategy

        17.1.4. Alldent

            17.1.4.1. Overview

            17.1.4.2. Product Portfolio

            17.1.4.3. Profitability by Market Segments

            17.1.4.4. Sales Footprint

            17.1.4.5. Strategy Overview

                17.1.4.5.1. Marketing Strategy

                17.1.4.5.2. Product Strategy

                17.1.4.5.3. Channel Strategy

        17.1.5. DenTek Oral Care, Inc.

            17.1.5.1. Overview

            17.1.5.2. Product Portfolio

            17.1.5.3. Profitability by Market Segments

            17.1.5.4. Sales Footprint

            17.1.5.5. Strategy Overview

                17.1.5.5.1. Marketing Strategy

                17.1.5.5.2. Product Strategy

                17.1.5.5.3. Channel Strategy

        17.1.6. Carestream Dental

            17.1.6.1. Overview

            17.1.6.2. Product Portfolio

            17.1.6.3. Profitability by Market Segments

            17.1.6.4. Sales Footprint

            17.1.6.5. Strategy Overview

                17.1.6.5.1. Marketing Strategy

                17.1.6.5.2. Product Strategy

                17.1.6.5.3. Channel Strategy

        17.1.7. Patterson Dental Supply, Inc.

            17.1.7.1. Overview

            17.1.7.2. Product Portfolio

            17.1.7.3. Profitability by Market Segments

            17.1.7.4. Sales Footprint

            17.1.7.5. Strategy Overview

                17.1.7.5.1. Marketing Strategy

                17.1.7.5.2. Product Strategy

                17.1.7.5.3. Channel Strategy

18. Assumptions & Acronyms Used

19. Research Methodology

Don't pay for what you don't need

Customize your report by selecting specific countries or regions and save 30%!

List of Tables

Table 1: Global Bruxism Management Market Value (US$ Mn) Forecast by Region, 2017-2032

Table 2: Global Bruxism Management Market Volume (Units) Forecast by Region, 2017-2032

Table 3: Global Bruxism Management Market Value (US$ Mn) Forecast by Product Type, 2017-2032

Table 4: Global Bruxism Management Market Volume (Units) Forecast by Product Type, 2017-2032

Table 5: Global Bruxism Management Market Value (US$ Mn) Forecast by Indication, 2017-2032

Table 6: Global Bruxism Management Market Volume (Units) Forecast by Indication, 2017-2032

Table 7: Global Bruxism Management Market Value (US$ Mn) Forecast by End User, 2017-2032

Table 8: Global Bruxism Management Market Volume (Units) Forecast by End User, 2017-2032

Table 9: North America Bruxism Management Market Value (US$ Mn) Forecast by Country, 2017-2032

Table 10: North America Bruxism Management Market Volume (Units) Forecast by Country, 2017-2032

Table 11: North America Bruxism Management Market Value (US$ Mn) Forecast by Product Type, 2017-2032

Table 12: North America Bruxism Management Market Volume (Units) Forecast by Product Type, 2017-2032

Table 13: North America Bruxism Management Market Value (US$ Mn) Forecast by Indication, 2017-2032

Table 14: North America Bruxism Management Market Volume (Units) Forecast by Indication, 2017-2032

Table 15: North America Bruxism Management Market Value (US$ Mn) Forecast by End User, 2017-2032

Table 16: North America Bruxism Management Market Volume (Units) Forecast by End User, 2017-2032

Table 17: Latin America Bruxism Management Market Value (US$ Mn) Forecast by Country, 2017-2032

Table 18: Latin America Bruxism Management Market Volume (Units) Forecast by Country, 2017-2032

Table 19: Latin America Bruxism Management Market Value (US$ Mn) Forecast by Product Type, 2017-2032

Table 20: Latin America Bruxism Management Market Volume (Units) Forecast by Product Type, 2017-2032

Table 21: Latin America Bruxism Management Market Value (US$ Mn) Forecast by Indication, 2017-2032

Table 22: Latin America Bruxism Management Market Volume (Units) Forecast by Indication, 2017-2032

Table 23: Latin America Bruxism Management Market Value (US$ Mn) Forecast by End User, 2017-2032

Table 24: Latin America Bruxism Management Market Volume (Units) Forecast by End User, 2017-2032

Table 25: Europe Bruxism Management Market Value (US$ Mn) Forecast by Country, 2017-2032

Table 26: Europe Bruxism Management Market Volume (Units) Forecast by Country, 2017-2032

Table 27: Europe Bruxism Management Market Value (US$ Mn) Forecast by Product Type, 2017-2032

Table 28: Europe Bruxism Management Market Volume (Units) Forecast by Product Type, 2017-2032

Table 29: Europe Bruxism Management Market Value (US$ Mn) Forecast by Indication, 2017-2032

Table 30: Europe Bruxism Management Market Volume (Units) Forecast by Indication, 2017-2032

Table 31: Europe Bruxism Management Market Value (US$ Mn) Forecast by End User, 2017-2032

Table 32: Europe Bruxism Management Market Volume (Units) Forecast by End User, 2017-2032

Table 33: East Asia Bruxism Management Market Value (US$ Mn) Forecast by Country, 2017-2032

Table 34: East Asia Bruxism Management Market Volume (Units) Forecast by Country, 2017-2032

Table 35: East Asia Bruxism Management Market Value (US$ Mn) Forecast by Product Type, 2017-2032

Table 36: East Asia Bruxism Management Market Volume (Units) Forecast by Product Type, 2017-2032

Table 37: East Asia Bruxism Management Market Value (US$ Mn) Forecast by Indication, 2017-2032

Table 38: East Asia Bruxism Management Market Volume (Units) Forecast by Indication, 2017-2032

Table 39: East Asia Bruxism Management Market Value (US$ Mn) Forecast by End User, 2017-2032

Table 40: East Asia Bruxism Management Market Volume (Units) Forecast by End User, 2017-2032

Table 41: South Asia & Pacific Bruxism Management Market Value (US$ Mn) Forecast by Country, 2017-2032

Table 42: South Asia & Pacific Bruxism Management Market Volume (Units) Forecast by Country, 2017-2032

Table 43: South Asia & Pacific Bruxism Management Market Value (US$ Mn) Forecast by Product Type, 2017-2032

Table 44: South Asia & Pacific Bruxism Management Market Volume (Units) Forecast by Product Type, 2017-2032

Table 45: South Asia & Pacific Bruxism Management Market Value (US$ Mn) Forecast by Indication, 2017-2032

Table 46: South Asia & Pacific Bruxism Management Market Volume (Units) Forecast by Indication, 2017-2032

Table 47: South Asia & Pacific Bruxism Management Market Value (US$ Mn) Forecast by End User, 2017-2032

Table 48: South Asia & Pacific Bruxism Management Market Volume (Units) Forecast by End User, 2017-2032

Table 49: MEA Bruxism Management Market Value (US$ Mn) Forecast by Country, 2017-2032

Table 50: MEA Bruxism Management Market Volume (Units) Forecast by Country, 2017-2032

Table 51: MEA Bruxism Management Market Value (US$ Mn) Forecast by Product Type, 2017-2032

Table 52: MEA Bruxism Management Market Volume (Units) Forecast by Product Type, 2017-2032

Table 53: MEA Bruxism Management Market Value (US$ Mn) Forecast by Indication, 2017-2032

Table 54: MEA Bruxism Management Market Volume (Units) Forecast by Indication, 2017-2032

Table 55: MEA Bruxism Management Market Value (US$ Mn) Forecast by End User, 2017-2032

Table 56: MEA Bruxism Management Market Volume (Units) Forecast by End User, 2017-2032
Sabyasachi Ghosh
Sabyasachi Ghosh

Principal Consultant

Talk to Analyst

Find your sweet spots for generating winning opportunities in this market.

List of Charts

Figure 1: Global Bruxism Management Market Value (US$ Mn) by Product Type, 2022-2032

Figure 2: Global Bruxism Management Market Value (US$ Mn) by Indication, 2022-2032

Figure 3: Global Bruxism Management Market Value (US$ Mn) by End User, 2022-2032

Figure 4: Global Bruxism Management Market Value (US$ Mn) by Region, 2022-2032

Figure 5: Global Bruxism Management Market Value (US$ Mn) Analysis by Region, 2017-2032

Figure 6: Global Bruxism Management Market Volume (Units) Analysis by Region, 2017-2032

Figure 7: Global Bruxism Management Market Value Share (%) and BPS Analysis by Region, 2022-2032

Figure 8: Global Bruxism Management Market Y-o-Y Growth (%) Projections by Region, 2022-2032

Figure 9: Global Bruxism Management Market Value (US$ Mn) Analysis by Product Type, 2017-2032

Figure 10: Global Bruxism Management Market Volume (Units) Analysis by Product Type, 2017-2032

Figure 11: Global Bruxism Management Market Value Share (%) and BPS Analysis by Product Type, 2022-2032

Figure 12: Global Bruxism Management Market Y-o-Y Growth (%) Projections by Product Type, 2022-2032

Figure 13: Global Bruxism Management Market Value (US$ Mn) Analysis by Indication, 2017-2032

Figure 14: Global Bruxism Management Market Volume (Units) Analysis by Indication, 2017-2032

Figure 15: Global Bruxism Management Market Value Share (%) and BPS Analysis by Indication, 2022-2032

Figure 16: Global Bruxism Management Market Y-o-Y Growth (%) Projections by Indication, 2022-2032

Figure 17: Global Bruxism Management Market Value (US$ Mn) Analysis by End User, 2017-2032

Figure 18: Global Bruxism Management Market Volume (Units) Analysis by End User, 2017-2032

Figure 19: Global Bruxism Management Market Value Share (%) and BPS Analysis by End User, 2022-2032

Figure 20: Global Bruxism Management Market Y-o-Y Growth (%) Projections by End User, 2022-2032

Figure 21: Global Bruxism Management Market Attractiveness by Product Type, 2022-2032

Figure 22: Global Bruxism Management Market Attractiveness by Indication, 2022-2032

Figure 23: Global Bruxism Management Market Attractiveness by End User, 2022-2032

Figure 24: Global Bruxism Management Market Attractiveness by Region, 2022-2032

Figure 25: North America Bruxism Management Market Value (US$ Mn) by Product Type, 2022-2032

Figure 26: North America Bruxism Management Market Value (US$ Mn) by Indication, 2022-2032

Figure 27: North America Bruxism Management Market Value (US$ Mn) by End User, 2022-2032

Figure 28: North America Bruxism Management Market Value (US$ Mn) by Country, 2022-2032

Figure 29: North America Bruxism Management Market Value (US$ Mn) Analysis by Country, 2017-2032

Figure 30: North America Bruxism Management Market Volume (Units) Analysis by Country, 2017-2032

Figure 31: North America Bruxism Management Market Value Share (%) and BPS Analysis by Country, 2022-2032

Figure 32: North America Bruxism Management Market Y-o-Y Growth (%) Projections by Country, 2022-2032

Figure 33: North America Bruxism Management Market Value (US$ Mn) Analysis by Product Type, 2017-2032

Figure 34: North America Bruxism Management Market Volume (Units) Analysis by Product Type, 2017-2032

Figure 35: North America Bruxism Management Market Value Share (%) and BPS Analysis by Product Type, 2022-2032

Figure 36: North America Bruxism Management Market Y-o-Y Growth (%) Projections by Product Type, 2022-2032

Figure 37: North America Bruxism Management Market Value (US$ Mn) Analysis by Indication, 2017-2032

Figure 38: North America Bruxism Management Market Volume (Units) Analysis by Indication, 2017-2032

Figure 39: North America Bruxism Management Market Value Share (%) and BPS Analysis by Indication, 2022-2032

Figure 40: North America Bruxism Management Market Y-o-Y Growth (%) Projections by Indication, 2022-2032

Figure 41: North America Bruxism Management Market Value (US$ Mn) Analysis by End User, 2017-2032

Figure 42: North America Bruxism Management Market Volume (Units) Analysis by End User, 2017-2032

Figure 43: North America Bruxism Management Market Value Share (%) and BPS Analysis by End User, 2022-2032

Figure 44: North America Bruxism Management Market Y-o-Y Growth (%) Projections by End User, 2022-2032

Figure 45: North America Bruxism Management Market Attractiveness by Product Type, 2022-2032

Figure 46: North America Bruxism Management Market Attractiveness by Indication, 2022-2032

Figure 47: North America Bruxism Management Market Attractiveness by End User, 2022-2032

Figure 48: North America Bruxism Management Market Attractiveness by Country, 2022-2032

Figure 49: Latin America Bruxism Management Market Value (US$ Mn) by Product Type, 2022-2032

Figure 50: Latin America Bruxism Management Market Value (US$ Mn) by Indication, 2022-2032

Figure 51: Latin America Bruxism Management Market Value (US$ Mn) by End User, 2022-2032

Figure 52: Latin America Bruxism Management Market Value (US$ Mn) by Country, 2022-2032

Figure 53: Latin America Bruxism Management Market Value (US$ Mn) Analysis by Country, 2017-2032

Figure 54: Latin America Bruxism Management Market Volume (Units) Analysis by Country, 2017-2032

Figure 55: Latin America Bruxism Management Market Value Share (%) and BPS Analysis by Country, 2022-2032

Figure 56: Latin America Bruxism Management Market Y-o-Y Growth (%) Projections by Country, 2022-2032

Figure 57: Latin America Bruxism Management Market Value (US$ Mn) Analysis by Product Type, 2017-2032

Figure 58: Latin America Bruxism Management Market Volume (Units) Analysis by Product Type, 2017-2032

Figure 59: Latin America Bruxism Management Market Value Share (%) and BPS Analysis by Product Type, 2022-2032

Figure 60: Latin America Bruxism Management Market Y-o-Y Growth (%) Projections by Product Type, 2022-2032

Figure 61: Latin America Bruxism Management Market Value (US$ Mn) Analysis by Indication, 2017-2032

Figure 62: Latin America Bruxism Management Market Volume (Units) Analysis by Indication, 2017-2032

Figure 63: Latin America Bruxism Management Market Value Share (%) and BPS Analysis by Indication, 2022-2032

Figure 64: Latin America Bruxism Management Market Y-o-Y Growth (%) Projections by Indication, 2022-2032

Figure 65: Latin America Bruxism Management Market Value (US$ Mn) Analysis by End User, 2017-2032

Figure 66: Latin America Bruxism Management Market Volume (Units) Analysis by End User, 2017-2032

Figure 67: Latin America Bruxism Management Market Value Share (%) and BPS Analysis by End User, 2022-2032

Figure 68: Latin America Bruxism Management Market Y-o-Y Growth (%) Projections by End User, 2022-2032

Figure 69: Latin America Bruxism Management Market Attractiveness by Product Type, 2022-2032

Figure 70: Latin America Bruxism Management Market Attractiveness by Indication, 2022-2032

Figure 71: Latin America Bruxism Management Market Attractiveness by End User, 2022-2032

Figure 72: Latin America Bruxism Management Market Attractiveness by Country, 2022-2032

Figure 73: Europe Bruxism Management Market Value (US$ Mn) by Product Type, 2022-2032

Figure 74: Europe Bruxism Management Market Value (US$ Mn) by Indication, 2022-2032

Figure 75: Europe Bruxism Management Market Value (US$ Mn) by End User, 2022-2032

Figure 76: Europe Bruxism Management Market Value (US$ Mn) by Country, 2022-2032

Figure 77: Europe Bruxism Management Market Value (US$ Mn) Analysis by Country, 2017-2032

Figure 78: Europe Bruxism Management Market Volume (Units) Analysis by Country, 2017-2032

Figure 79: Europe Bruxism Management Market Value Share (%) and BPS Analysis by Country, 2022-2032

Figure 80: Europe Bruxism Management Market Y-o-Y Growth (%) Projections by Country, 2022-2032

Figure 81: Europe Bruxism Management Market Value (US$ Mn) Analysis by Product Type, 2017-2032

Figure 82: Europe Bruxism Management Market Volume (Units) Analysis by Product Type, 2017-2032

Figure 83: Europe Bruxism Management Market Value Share (%) and BPS Analysis by Product Type, 2022-2032

Figure 84: Europe Bruxism Management Market Y-o-Y Growth (%) Projections by Product Type, 2022-2032

Figure 85: Europe Bruxism Management Market Value (US$ Mn) Analysis by Indication, 2017-2032

Figure 86: Europe Bruxism Management Market Volume (Units) Analysis by Indication, 2017-2032

Figure 87: Europe Bruxism Management Market Value Share (%) and BPS Analysis by Indication, 2022-2032

Figure 88: Europe Bruxism Management Market Y-o-Y Growth (%) Projections by Indication, 2022-2032

Figure 89: Europe Bruxism Management Market Value (US$ Mn) Analysis by End User, 2017-2032

Figure 90: Europe Bruxism Management Market Volume (Units) Analysis by End User, 2017-2032

Figure 91: Europe Bruxism Management Market Value Share (%) and BPS Analysis by End User, 2022-2032

Figure 92: Europe Bruxism Management Market Y-o-Y Growth (%) Projections by End User, 2022-2032

Figure 93: Europe Bruxism Management Market Attractiveness by Product Type, 2022-2032

Figure 94: Europe Bruxism Management Market Attractiveness by Indication, 2022-2032

Figure 95: Europe Bruxism Management Market Attractiveness by End User, 2022-2032

Figure 96: Europe Bruxism Management Market Attractiveness by Country, 2022-2032

Figure 97: East Asia Bruxism Management Market Value (US$ Mn) by Product Type, 2022-2032

Figure 98: East Asia Bruxism Management Market Value (US$ Mn) by Indication, 2022-2032

Figure 99: East Asia Bruxism Management Market Value (US$ Mn) by End User, 2022-2032

Figure 100: East Asia Bruxism Management Market Value (US$ Mn) by Country, 2022-2032

Figure 101: East Asia Bruxism Management Market Value (US$ Mn) Analysis by Country, 2017-2032

Figure 102: East Asia Bruxism Management Market Volume (Units) Analysis by Country, 2017-2032

Figure 103: East Asia Bruxism Management Market Value Share (%) and BPS Analysis by Country, 2022-2032

Figure 104: East Asia Bruxism Management Market Y-o-Y Growth (%) Projections by Country, 2022-2032

Figure 105: East Asia Bruxism Management Market Value (US$ Mn) Analysis by Product Type, 2017-2032

Figure 106: East Asia Bruxism Management Market Volume (Units) Analysis by Product Type, 2017-2032

Figure 107: East Asia Bruxism Management Market Value Share (%) and BPS Analysis by Product Type, 2022-2032

Figure 108: East Asia Bruxism Management Market Y-o-Y Growth (%) Projections by Product Type, 2022-2032

Figure 109: East Asia Bruxism Management Market Value (US$ Mn) Analysis by Indication, 2017-2032

Figure 110: East Asia Bruxism Management Market Volume (Units) Analysis by Indication, 2017-2032

Figure 111: East Asia Bruxism Management Market Value Share (%) and BPS Analysis by Indication, 2022-2032

Figure 112: East Asia Bruxism Management Market Y-o-Y Growth (%) Projections by Indication, 2022-2032

Figure 113: East Asia Bruxism Management Market Value (US$ Mn) Analysis by End User, 2017-2032

Figure 114: East Asia Bruxism Management Market Volume (Units) Analysis by End User, 2017-2032

Figure 115: East Asia Bruxism Management Market Value Share (%) and BPS Analysis by End User, 2022-2032

Figure 116: East Asia Bruxism Management Market Y-o-Y Growth (%) Projections by End User, 2022-2032

Figure 117: East Asia Bruxism Management Market Attractiveness by Product Type, 2022-2032

Figure 118: East Asia Bruxism Management Market Attractiveness by Indication, 2022-2032

Figure 119: East Asia Bruxism Management Market Attractiveness by End User, 2022-2032

Figure 120: East Asia Bruxism Management Market Attractiveness by Country, 2022-2032

Figure 121: South Asia & Pacific Bruxism Management Market Value (US$ Mn) by Product Type, 2022-2032

Figure 122: South Asia & Pacific Bruxism Management Market Value (US$ Mn) by Indication, 2022-2032

Figure 123: South Asia & Pacific Bruxism Management Market Value (US$ Mn) by End User, 2022-2032

Figure 124: South Asia & Pacific Bruxism Management Market Value (US$ Mn) by Country, 2022-2032

Figure 125: South Asia & Pacific Bruxism Management Market Value (US$ Mn) Analysis by Country, 2017-2032

Figure 126: South Asia & Pacific Bruxism Management Market Volume (Units) Analysis by Country, 2017-2032

Figure 127: South Asia & Pacific Bruxism Management Market Value Share (%) and BPS Analysis by Country, 2022-2032

Figure 128: South Asia & Pacific Bruxism Management Market Y-o-Y Growth (%) Projections by Country, 2022-2032

Figure 129: South Asia & Pacific Bruxism Management Market Value (US$ Mn) Analysis by Product Type, 2017-2032

Figure 130: South Asia & Pacific Bruxism Management Market Volume (Units) Analysis by Product Type, 2017-2032

Figure 131: South Asia & Pacific Bruxism Management Market Value Share (%) and BPS Analysis by Product Type, 2022-2032

Figure 132: South Asia & Pacific Bruxism Management Market Y-o-Y Growth (%) Projections by Product Type, 2022-2032

Figure 133: South Asia & Pacific Bruxism Management Market Value (US$ Mn) Analysis by Indication, 2017-2032

Figure 134: South Asia & Pacific Bruxism Management Market Volume (Units) Analysis by Indication, 2017-2032

Figure 135: South Asia & Pacific Bruxism Management Market Value Share (%) and BPS Analysis by Indication, 2022-2032

Figure 136: South Asia & Pacific Bruxism Management Market Y-o-Y Growth (%) Projections by Indication, 2022-2032

Figure 137: South Asia & Pacific Bruxism Management Market Value (US$ Mn) Analysis by End User, 2017-2032

Figure 138: South Asia & Pacific Bruxism Management Market Volume (Units) Analysis by End User, 2017-2032

Figure 139: South Asia & Pacific Bruxism Management Market Value Share (%) and BPS Analysis by End User, 2022-2032

Figure 140: South Asia & Pacific Bruxism Management Market Y-o-Y Growth (%) Projections by End User, 2022-2032

Figure 141: South Asia & Pacific Bruxism Management Market Attractiveness by Product Type, 2022-2032

Figure 142: South Asia & Pacific Bruxism Management Market Attractiveness by Indication, 2022-2032

Figure 143: South Asia & Pacific Bruxism Management Market Attractiveness by End User, 2022-2032

Figure 144: South Asia & Pacific Bruxism Management Market Attractiveness by Country, 2022-2032

Figure 145: MEA Bruxism Management Market Value (US$ Mn) by Product Type, 2022-2032

Figure 146: MEA Bruxism Management Market Value (US$ Mn) by Indication, 2022-2032

Figure 147: MEA Bruxism Management Market Value (US$ Mn) by End User, 2022-2032

Figure 148: MEA Bruxism Management Market Value (US$ Mn) by Country, 2022-2032

Figure 149: MEA Bruxism Management Market Value (US$ Mn) Analysis by Country, 2017-2032

Figure 150: MEA Bruxism Management Market Volume (Units) Analysis by Country, 2017-2032

Figure 151: MEA Bruxism Management Market Value Share (%) and BPS Analysis by Country, 2022-2032

Figure 152: MEA Bruxism Management Market Y-o-Y Growth (%) Projections by Country, 2022-2032

Figure 153: MEA Bruxism Management Market Value (US$ Mn) Analysis by Product Type, 2017-2032

Figure 154: MEA Bruxism Management Market Volume (Units) Analysis by Product Type, 2017-2032

Figure 155: MEA Bruxism Management Market Value Share (%) and BPS Analysis by Product Type, 2022-2032

Figure 156: MEA Bruxism Management Market Y-o-Y Growth (%) Projections by Product Type, 2022-2032

Figure 157: MEA Bruxism Management Market Value (US$ Mn) Analysis by Indication, 2017-2032

Figure 158: MEA Bruxism Management Market Volume (Units) Analysis by Indication, 2017-2032

Figure 159: MEA Bruxism Management Market Value Share (%) and BPS Analysis by Indication, 2022-2032

Figure 160: MEA Bruxism Management Market Y-o-Y Growth (%) Projections by Indication, 2022-2032

Figure 161: MEA Bruxism Management Market Value (US$ Mn) Analysis by End User, 2017-2032

Figure 162: MEA Bruxism Management Market Volume (Units) Analysis by End User, 2017-2032

Figure 163: MEA Bruxism Management Market Value Share (%) and BPS Analysis by End User, 2022-2032

Figure 164: MEA Bruxism Management Market Y-o-Y Growth (%) Projections by End User, 2022-2032

Figure 165: MEA Bruxism Management Market Attractiveness by Product Type, 2022-2032

Figure 166: MEA Bruxism Management Market Attractiveness by Indication, 2022-2032

Figure 167: MEA Bruxism Management Market Attractiveness by End User, 2022-2032

Figure 168: MEA Bruxism Management Market Attractiveness by Country, 2022-2032

Recommendations

Healthcare

Obesity Management Market

Published : July 2023

Healthcare

Hospital Capacity Management Solutions Market

Published : January 2023

Healthcare

Pain Management Devices Market

Published : October 2022

Explore Healthcare Insights

View Reports

Bruxism Management Market