Reports

- Global Locations -

Headquarters

Future Market Insights, Inc.

Christiana Corporate, 200
Continental Drive, Suite 401,
Newark, Delaware - 19713,
United States

T: +1-845-579-5705

Americas

Future Market Insights, Inc.

616 Corporate Way, Suite 2-9018,
Valley Cottage, NY 10989, United States

T: +1-347-918-3531

MEA

Future Market Insights

1602-6 Jumeirah Bay X2 Tower, Plot No: JLT-PH2-X2A,
Jumeirah Lakes Towers, Dubai,
United Arab Emirates

Europe

Future Market Insights

3rd Floor, 207 Regent Street,
W1B 3HH London
United Kingdom

T: + 44 (0) 20 8123 9659
D: +44 (0) 20 3287 4268

Asia Pacific

Future Market Insights

IndiaLand Global Tech Park, Unit UG-1, Behind Grand HighStreet, Phase 1, Hinjawadi, MH, Pune – 411057, India

Cake Enzyme Market Snapshot (2022 to 2032)

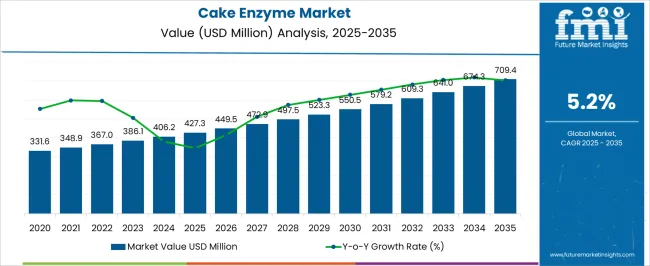
The global cake enzyme market is anticipated to be valued at US$ 367.0 Million in 2022, forecast to grow at a CAGR of 5.2% to be valued at US$ 609.3 Million from 2022 to 2032. Growth is attributed to the growing demand for bakery and confectionery products in food and beverages.

Data Points Key Statistics
Growth Rate (2016 to 2021) 3.4% CAGR
Expected Market Value (2022) US$ 367.0 Million
Anticipated Forecast Value (2032) US$ 609.3 Million
Projected Growth Rate (2022 to 2032) 5.2% CAGR

The enzymes are biological compounds usually proteins having properties, i.e., heat sensitivity, optimum temperature, and pH. Enzymes such as fungal alpha-amylases and Maltogenic alpha-amylases, glucose oxidase, lipase, and many more enzymes are used in bakery products such as pastries, cakes, cookies, etc.

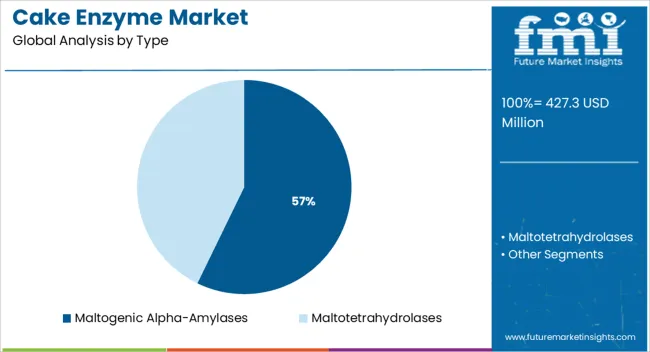
The cake contains a high level of fat and sugar and is frozen which decreases staling matters. Caking enzymes such as maltogenic alpha-amylases and maltotetrahydrolases are used for reducing Staling issues. Staling is occurred due to changes in the starch structure during storage.

The demand for bakery enzymes is anticipated to witness a swift rise during the forecast period, due to rising demand for bakery products across the globe, especially in developed markets. The presence of numerous functional properties in bakery enzymes is expected to fuel their demand for the production of bakery products, which in turn is projected to fuel their market growth.

Excessive Research and Development costs and strict and critical guidelines to handle enzyme production and usage are the major factors that are anticipated to limit the growth of the cake enzyme market in the forthcoming years.

Don't pay for what you don't need

Customize your report by selecting specific countries or regions and save 30%!

Which Are Some Prominent Drivers Spearheading Cake Enzyme Market Growth?

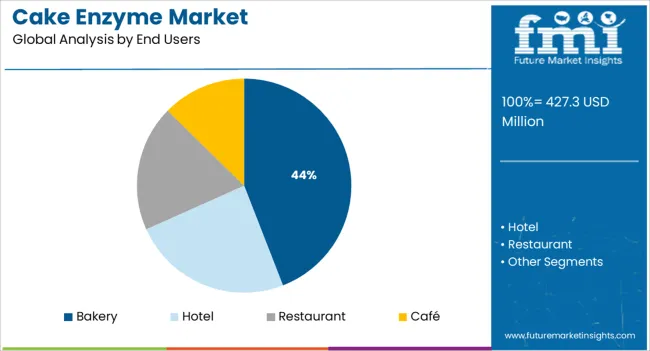
The rising use of cake enzymes in the bakery and HoReCa (Hotels, Restaurants, and Cafes) is one of the major factors that is expected to propel the growth of the global cake enzymes market during the forecast period. Moreover, the increasing awareness among bakers regarding the utilization of enzymes to improvise the quality and efficiency of cakes is another factor anticipated to fuel the market in the forthcoming years.

The growing demand for bakery and confectionery products in the food and beverages industry due to increasing per capita income and changing the lifestyle of consumers, rise in awareness about packaged food are some other factors responsible for the growth of the cake enzymes market.

The enzymes help to increase the taste and quality of cake and other bakery products, which is also expected to increase the growth of the global cake enzymes market during the forecast period. More and more cake manufacturers across the world are discovering quality-improving and cost-cutting enzymes.

The bakery industry possesses high growth potential and is anticipated to garner a remarkable position in the food processing sector. This is attributed to the surge in demand for bakery items majorly bread, owing to busy lifestyles and an increase in preference for fresh & ready-to-eat breakfast food.

The surge in consumption of bakery products, especially the packaged variety, has increased the overall growth of the market, in terms of value sales. Rapid urbanization, increment in disposable income of the population, rise in trend of bread & cakes among millennials, developments in bakeries, and continuously changing buyer inclination drive the demand for cake enzymes from the bakery industry.

What Are The Challenges Faced By The Cake Enzyme Industry?

An unstable demand forecast and supply chain are the major factors that are expected to limit the growth of the Cake Enzyme Market during the forecast period. In addition, emulsifiers and other additives are used to improve the shelf life and other valuable aspects of bread.

However, because these synthetic emulsifiers have a detrimental influence on health after intake, such as high blood pressure and diabetes, their use in bread products must be restricted, potentially stifling market growth.

Further, excessive consumption of bakery products such as bread, cookies, and others may affect human health negatively, which in turn is anticipated to impede the growth of the cake enzyme market over the analysis period. Furthermore, stringent governmental regulations on the usage and commercialization of food enzymes are expected to hamper the market growth during the forecast period.

Excessive Research and Development costs and strict and critical guidelines to handle enzyme production and usage are other factors that are anticipated to obstruct the growth of the cake enzyme market in the forthcoming years.

Nandini Roy Choudhury

Principal Consultant

Talk to Analyst

Find your sweet spots for generating winning opportunities in this market.

Why Is North America Emerging As An Opportunistic Cake Enzyme Market?

In terms of regional platforms, North America holds the largest market share in the Cake Enzyme market. The region is expected to accrue a revenue share worth 31.1% in 2022. North America is projected to dominate the cake enzyme market, attributed to the high consumption of baked goods by population-based in North America, especially in the USA.

Increased consumer inclination towards processed and convenience food products, of which, baked goods are a major part, is expected to fuel the growth of the cake enzyme market in North America.

In addition, the rising trend for nutritional diet patterns, especially in the USA will essentially support regional growth. The implementation of new regulations in this region permits the manufacturers to not describe or enlist information on the use of baking enzymes on the product packaging.

This relaxation in the legislation of bakery products enables the growing use of baking enzymes by manufacturing companies to extract the best quality product in a more advanced and cost-effective output.
How Is Europe Contributing To Growth Of The Cake Enzyme Market?

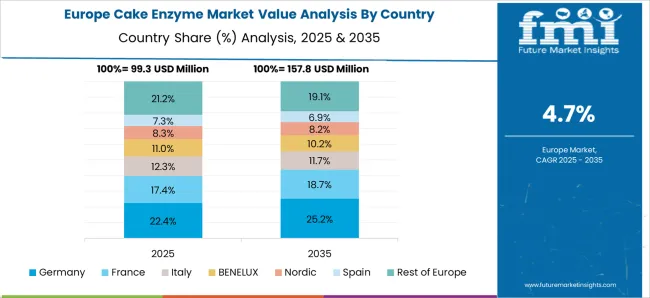
According to Future Market Insights, Europe is expected to hold significant growth opportunities for Cake Enzyme and is expected to reach a share of 28.6% in 2022. Europe is expected to foresee significant growth in the Cake Enzyme market in the near future, owing to the larger production and consumption trend observed in the region.

Germany has the largest market share in the cake enzyme market, owing to the widespread consumption of bakery products, resulting in several bakery industries demanding the baking enzyme to provide high-quality bakery goods to the market.

Due to the consumption of bakery goods such as bread and pastries in daily diets, Germany has occupied the largest market share in the European market. Because of the high consumption of enzymes through baking goods, the United Kingdom is leading the growth. Several companies in the region are working to develop enzymes that can be used to produce baked goods.

Get the data you need at a Fraction of the cost

Personalize your report by choosing insights you need
and save 40%!

Where Does Asia-Pacific Region Stand In The Cake Enzyme Market?

According to Future Market Insights, Asia-Pacific is expected to grow with lucrative growth opportunities for Cake Enzyme Market and is expected to reach a significant share of 25.4% in 2022.

The Cake Enzyme Market in Asia Pacific is expected to grow at a rapid pace during the forecast years, due to rapid growth in the food processing industry of the region, attributed to the increasing population of the major economies of Asia Pacific, such as India and China.

Further, increased product launches in the Asia Pacific, coupled with increased governmental support for the use of bakery enzymes in baked goods further expected to aid the rise of the cake enzyme market in the region.

How Is Middle East & Africa Contributing To Growth Of The Cake Enzyme Market?

According to Future Market Insights, the Middle East & Africa are expected to provide significant growth opportunities for Cake Enzyme Market and are expected to reach a share of 12.8% in 2022.

Rapid urbanization along with increasing awareness among consumers regarding the benefits of baking enzymes is driving the industry growth in the region. Further, the presence of prominent bakery companies along with demand for bread and other ready-to-eat bakery and confectionery food product has resulted in proliferating the enzymes demand among the bakery food manufacturers in the Middle East & Africa.

Role of Start-ups In Cake Enzyme Market

There are many prominent market players in the Cake Enzyme Market such as Novozymes, DuPont, AB Enzymes, Fermentech Labs, Fermex Solutions, and Grain Improvers BV, among others, which are working hand-in-hand to provide the best-in-class Cake Enzyme for enhancing the global arena.

However, there are many global start-ups in the cake enzyme market, which are stepping forward in matching the requirements of the Cake Enzyme domain.
  • In December 2020, DuPont introduced its line of Danisco enzymes for improver houses and industrial bakeries to offer them an outstanding anti-staling solution that provides a unique texture, premium softness, and a longer-lasting freshness to cakes, bread, sweet rolls, and buns while maintaining their shape. The new products, i.e., Powerfresh Special and Powersoft Cake 8010 enzymes are expected to help the improver houses and industrial bakeries in Japan to meet the demand for soft, moist, less crumbling cakes and sweet rolls and buns while improving productivity, flexibility, and shelf life.

Market Competition

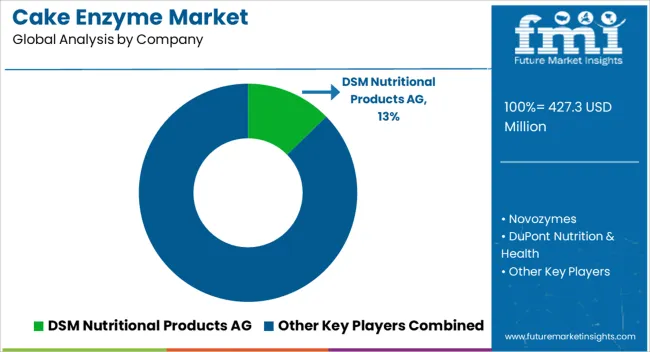
Some of the key participants present in the global Cake Enzyme market include DSM Nutritional Products AG, Novozymes, DuPont Nutrition & Health, Advanced Enzymes, AB Enzymes, Amano Enzymes, Stern Enzyme, and Dyadic International Inc. among others.

Attributed to the presence of such a high number of participants, the market is highly competitive. While global players such as DSM Nutritional Products AG, Novozymes, and DuPont Nutrition & Health, Advanced Enzymes, account for considerable market size, several regional-level players are also operating across key growth regions, particularly in North America.

Recent Development

  • In April 2021, BASF along with Sandoz GmbH a subsidiary of Novartis had agreed to invest in Kundl/Schaftenau Campus based in Austria. The strategic development is carried out to strengthen the company’s global production footprint for enzymes and biotechnology products.
  • In March 2021, IFF launched its POWERFresh and POWERSoft range of enzymes in China. These products are marketed under the Danisco range of food ingredients. Improver houses and bakeries in China are constantly seeking methods to improve consumer eating experiences while increasing efficiency and lowering product returns.

Report Scope

Report Attribute Details
Growth Rate CAGR of 5.2% from 2022 to 2032
Base Year for Estimation 2021
Market Value in 2022 US$ 367.0 Million
Market Value in 2032 US$ 609.3 Million
Historical Data 2016 to 2021
Forecast Period 2022 to 2032
Quantitative Units Revenue in US$ Million, Volume in Kilotons, and CAGR from 2022 to 2032
Report Coverage Revenue Forecast, Volume Forecast, Company Ranking, Competitive Landscape, Growth Factors, Trends, and Pricing Analysis
Segments Covered
  • Type
  • End Users
  • Region
Regions Covered
  • North America
  • Latin America
  • Europe
  • Asia Pacific
  • Middle East & Africa
Key Countries Profiled
  • United States of America
  • Canada
  • Brazil
  • Mexico
  • Germany
  • United Kingdom
  • France
  • Spain
  • Italy
  • China
  • Japan
  • South Korea
  • Malaysia
  • Singapore
  • Australia
  • New Zealand
  • GCC Countries
  • South Africa
  • Israel
Key Companies Profiled
  • DSM Nutritional Products AG
  • Novozymes
  • DuPont Nutrition & Health
  • Advanced Enzymes
  • AB Enzymes
  • Amano Enzymes
  • Stern Enzyme
  • Dyadic International Inc.
  • Cargill Inc.
  • AAK AB
Customization Available Upon Request

Key Segments Profiled In The Cake Enzyme Industry Survey

By Type:

  • Maltogenic alpha-amylases
  • Maltotetrahydrolases

By End Users:

  • for Bakery
  • for Hotels
  • for Restaurants
  • for Cafes

By Region:

  • North America
  • Latin America
  • Europe Cake
  • Asia Pacific
  • Middle East & Africa

Frequently Asked Questions

What is the anticipated growth of the Cake Enzyme market until 2032?

FMI projects the global Cake Enzyme market to expand at a 5.2% value CAGR by 2032

Which region is forecast to be the most lucrative for Cake Enzyme market growth?

North America is expected to be the most opportunistic Cake Enzyme market, expanding at a 31.1% market share

Which are some prominent Cake Enzyme players?

DSM Nutritional Products AG, Novozymes, and DuPont Nutrition & Health, Advanced Enzymes are some prominent Cake Enzyme players

Table of Content

1. Executive Summary | Cake Enzyme Market

    1.1. Global Market Outlook

    1.2. Demand-side Trends

    1.3. Supply-side Trends

    1.4. Technology Roadmap Analysis

    1.5. Analysis and Recommendations

2. Market Overview

    2.1. Market Coverage / Taxonomy

    2.2. Market Definition / Scope / Limitations

3. Market Background

    3.1. Market Dynamics

        3.1.1. Drivers

        3.1.2. Restraints

        3.1.3. Opportunity

        3.1.4. Trends

    3.2. Scenario Forecast

        3.2.1. Demand in Optimistic Scenario

        3.2.2. Demand in Likely Scenario

        3.2.3. Demand in Conservative Scenario

    3.3. Opportunity Map Analysis

    3.4. Product Life Cycle Analysis

    3.5. Supply Chain Analysis

        3.5.1. Supply Side Participants and Their Roles

            3.5.1.1. Producers

            3.5.1.2. Mid-Level Participants (Traders/ Agents/ Brokers)

            3.5.1.3. Wholesalers and Distributors

        3.5.2. Value Added and Value Created at Node in the Supply Chain

        3.5.3. List of Raw Material Suppliers

        3.5.4. List of Existing and Potential Buyers

    3.6. Investment Feasibility Matrix

    3.7. Value Chain Analysis

        3.7.1. Profit Margin Analysis

        3.7.2. Wholesalers and Distributors

        3.7.3. Retailers

    3.8. PESTLE and Porter’s Analysis

    3.9. Regulatory Landscape

        3.9.1. By Key Regions

        3.9.2. By Key Countries

    3.10. Regional Parent Market Outlook

    3.11. Production and Consumption Statistics

    3.12. Import and Export Statistics

4. Global Market Analysis 2016 to 2021 and Forecast, 2022 to 2032

    4.1. Historical Market Size Value (US$ Million) & Volume (Tons) Analysis, 2016 to 2021

    4.2. Current and Future Market Size Value (US$ Million) & Volume (Tons) Projections, 2022 to 2032

        4.2.1. Y-o-Y Growth Trend Analysis

        4.2.2. Absolute $ Opportunity Analysis

5. Global Market Analysis 2016 to 2021 and Forecast 2022 to 2032, By Type

    5.1. Introduction / Key Findings

    5.2. Historical Market Size Value (US$ Million) & Volume (Tons) Analysis By Type, 2016 to 2021

    5.3. Current and Future Market Size Value (US$ Million) & Volume (Tons) Analysis and Forecast By Type, 2022 to 2032

        5.3.1. Maltogenic Alpha-Amylases

        5.3.2. Maltotetrahydrolases

    5.4. Y-o-Y Growth Trend Analysis By Type, 2016 to 2021

    5.5. Absolute $ Opportunity Analysis By Type, 2022 to 2032

6. Global Market Analysis 2016 to 2021 and Forecast 2022 to 2032, By End Users

    6.1. Introduction / Key Findings

    6.2. Historical Market Size Value (US$ Million) & Volume (Tons) Analysis By End Users, 2016 to 2021

    6.3. Current and Future Market Size Value (US$ Million) & Volume (Tons) Analysis and Forecast By End Users, 2022 to 2032

        6.3.1. Bakery

        6.3.2. Hotel

        6.3.3. Restaurant

        6.3.4. Café

    6.4. Y-o-Y Growth Trend Analysis By End Users, 2016 to 2021

    6.5. Absolute $ Opportunity Analysis By End Users, 2022 to 2032

7. Global Market Analysis 2016 to 2021 and Forecast 2022 to 2032, By Region

    7.1. Introduction

    7.2. Historical Market Size Value (US$ Million) & Volume (Tons) Analysis By Region, 2016 to 2021

    7.3. Current Market Size Value (US$ Million) & Volume (Tons) Analysis and Forecast By Region, 2022 to 2032

        7.3.1. North America

        7.3.2. Latin America

        7.3.3. Europe

        7.3.4. Asia Pacific

        7.3.5. Middle East and Africa

    7.4. Market Attractiveness Analysis By Region

8. North America Market Analysis 2016 to 2021 and Forecast 2022 to 2032, By Country

    8.1. Historical Market Size Value (US$ Million) & Volume (Tons) Trend Analysis By Market Taxonomy, 2016 to 2021

    8.2. Market Size Value (US$ Million) & Volume (Tons) Forecast By Market Taxonomy, 2022 to 2032

        8.2.1. By Country

            8.2.1.1. United States of America

            8.2.1.2. Canada

        8.2.2. By Type

        8.2.3. By End Users

    8.3. Market Attractiveness Analysis

        8.3.1. By Country

        8.3.2. By Type

        8.3.3. By End Users

    8.4. Key Takeaways

9. Latin America Market Analysis 2016 to 2021 and Forecast 2022 to 2032, By Country

    9.1. Historical Market Size Value (US$ Million) & Volume (Tons) Trend Analysis By Market Taxonomy, 2016 to 2021

    9.2. Market Size Value (US$ Million) & Volume (Tons) Forecast By Market Taxonomy, 2022 to 2032

        9.2.1. By Country

            9.2.1.1. Brazil

            9.2.1.2. Mexico

            9.2.1.3. Rest of Latin America

        9.2.2. By Type

        9.2.3. By End Users

    9.3. Market Attractiveness Analysis

        9.3.1. By Country

        9.3.2. By Type

        9.3.3. By End Users

    9.4. Key Takeaways

10. Europe Market Analysis 2016 to 2021 and Forecast 2022 to 2032, By Country

    10.1. Historical Market Size Value (US$ Million) & Volume (Tons) Trend Analysis By Market Taxonomy, 2016 to 2021

    10.2. Market Size Value (US$ Million) & Volume (Tons) Forecast By Market Taxonomy, 2022 to 2032

        10.2.1. By Country

            10.2.1.1. Germany

            10.2.1.2. United Kingdom

            10.2.1.3. France

            10.2.1.4. Spain

            10.2.1.5. Italy

            10.2.1.6. Rest of Europe

        10.2.2. By Type

        10.2.3. By End Users

    10.3. Market Attractiveness Analysis

        10.3.1. By Country

        10.3.2. By Type

        10.3.3. By End Users

    10.4. Key Takeaways

11. Asia Pacific Market Analysis 2016 to 2021 and Forecast 2022 to 2032, By Country

    11.1. Historical Market Size Value (US$ Million) & Volume (Tons) Trend Analysis By Market Taxonomy, 2016 to 2021

    11.2. Market Size Value (US$ Million) & Volume (Tons) Forecast By Market Taxonomy, 2022 to 2032

        11.2.1. By Country

            11.2.1.1. China

            11.2.1.2. Japan

            11.2.1.3. South Korea

            11.2.1.4. Malaysia

            11.2.1.5. Singapore

            11.2.1.6. Australia

            11.2.1.7. New Zealand

            11.2.1.8. Rest of Asia Pacific

        11.2.2. By Type

        11.2.3. By End Users

    11.3. Market Attractiveness Analysis

        11.3.1. By Country

        11.3.2. By Type

        11.3.3. By End Users

    11.4. Key Takeaways

12. Middle East and Africa Market Analysis 2016 to 2021 and Forecast 2022 to 2032, By Country

    12.1. Historical Market Size Value (US$ Million) & Volume (Tons) Trend Analysis By Market Taxonomy, 2016 to 2021

    12.2. Market Size Value (US$ Million) & Volume (Tons) Forecast By Market Taxonomy, 2022 to 2032

        12.2.1. By Country

            12.2.1.1. GCC Countries

            12.2.1.2. South Africa

            12.2.1.3. Israel

            12.2.1.4. Rest of Middle East and Africa

        12.2.2. By Type

        12.2.3. By End Users

    12.3. Market Attractiveness Analysis

        12.3.1. By Country

        12.3.2. By Type

        12.3.3. By End Users

    12.4. Key Takeaways

13. Key Countries Market Analysis

    13.1. United States of America

        13.1.1. Pricing Analysis

        13.1.2. Market Share Analysis, 2021

            13.1.2.1. By Type

            13.1.2.2. By End Users

    13.2. Canada

        13.2.1. Pricing Analysis

        13.2.2. Market Share Analysis, 2021

            13.2.2.1. By Type

            13.2.2.2. By End Users

    13.3. Brazil

        13.3.1. Pricing Analysis

        13.3.2. Market Share Analysis, 2021

            13.3.2.1. By Type

            13.3.2.2. By End Users

    13.4. Mexico

        13.4.1. Pricing Analysis

        13.4.2. Market Share Analysis, 2021

            13.4.2.1. By Type

            13.4.2.2. By End Users

    13.5. Germany

        13.5.1. Pricing Analysis

        13.5.2. Market Share Analysis, 2021

            13.5.2.1. By Type

            13.5.2.2. By End Users

    13.6. United Kingdom

        13.6.1. Pricing Analysis

        13.6.2. Market Share Analysis, 2021

            13.6.2.1. By Type

            13.6.2.2. By End Users

    13.7. France

        13.7.1. Pricing Analysis

        13.7.2. Market Share Analysis, 2021

            13.7.2.1. By Type

            13.7.2.2. By End Users

    13.8. Spain

        13.8.1. Pricing Analysis

        13.8.2. Market Share Analysis, 2021

            13.8.2.1. By Type

            13.8.2.2. By End Users

    13.9. Italy

        13.9.1. Pricing Analysis

        13.9.2. Market Share Analysis, 2021

            13.9.2.1. By Type

            13.9.2.2. By End Users

    13.10. China

        13.10.1. Pricing Analysis

        13.10.2. Market Share Analysis, 2021

            13.10.2.1. By Type

            13.10.2.2. By End Users

    13.11. Japan

        13.11.1. Pricing Analysis

        13.11.2. Market Share Analysis, 2021

            13.11.2.1. By Type

            13.11.2.2. By End Users

    13.12. South Korea

        13.12.1. Pricing Analysis

        13.12.2. Market Share Analysis, 2021

            13.12.2.1. By Type

            13.12.2.2. By End Users

    13.13. Malaysia

        13.13.1. Pricing Analysis

        13.13.2. Market Share Analysis, 2021

            13.13.2.1. By Type

            13.13.2.2. By End Users

    13.14. Singapore

        13.14.1. Pricing Analysis

        13.14.2. Market Share Analysis, 2021

            13.14.2.1. By Type

            13.14.2.2. By End Users

    13.15. Australia

        13.15.1. Pricing Analysis

        13.15.2. Market Share Analysis, 2021

            13.15.2.1. By Type

            13.15.2.2. By End Users

    13.16. New Zealand

        13.16.1. Pricing Analysis

        13.16.2. Market Share Analysis, 2021

            13.16.2.1. By Type

            13.16.2.2. By End Users

    13.17. GCC Countries

        13.17.1. Pricing Analysis

        13.17.2. Market Share Analysis, 2021

            13.17.2.1. By Type

            13.17.2.2. By End Users

    13.18. South Africa

        13.18.1. Pricing Analysis

        13.18.2. Market Share Analysis, 2021

            13.18.2.1. By Type

            13.18.2.2. By End Users

    13.19. Israel

        13.19.1. Pricing Analysis

        13.19.2. Market Share Analysis, 2021

            13.19.2.1. By Type

            13.19.2.2. By End Users

14. Market Structure Analysis

    14.1. Competition Dashboard

    14.2. Competition Benchmarking

    14.3. Market Share Analysis of Top Players

        14.3.1. By Regional

        14.3.2. By Type

        14.3.3. By End Users

15. Competition Analysis

    15.1. Competition Deep Dive

        15.1.1. DSM Nutritional Products AG

            15.1.1.1. Overview

            15.1.1.2. Product Portfolio

            15.1.1.3. Profitability by Market Segments

            15.1.1.4. Sales Footprint

            15.1.1.5. Strategy Overview

                15.1.1.5.1. Marketing Strategy

                15.1.1.5.2. Product Strategy

                15.1.1.5.3. Channel Strategy

        15.1.2. Novozymes

            15.1.2.1. Overview

            15.1.2.2. Product Portfolio

            15.1.2.3. Profitability by Market Segments

            15.1.2.4. Sales Footprint

            15.1.2.5. Strategy Overview

                15.1.2.5.1. Marketing Strategy

                15.1.2.5.2. Product Strategy

                15.1.2.5.3. Channel Strategy

        15.1.3. DuPont Nutrition & Health

            15.1.3.1. Overview

            15.1.3.2. Product Portfolio

            15.1.3.3. Profitability by Market Segments

            15.1.3.4. Sales Footprint

            15.1.3.5. Strategy Overview

                15.1.3.5.1. Marketing Strategy

                15.1.3.5.2. Product Strategy

                15.1.3.5.3. Channel Strategy

        15.1.4. Advanced Enzymes

            15.1.4.1. Overview

            15.1.4.2. Product Portfolio

            15.1.4.3. Profitability by Market Segments

            15.1.4.4. Sales Footprint

            15.1.4.5. Strategy Overview

                15.1.4.5.1. Marketing Strategy

                15.1.4.5.2. Product Strategy

                15.1.4.5.3. Channel Strategy

        15.1.5. AB Enzymes

            15.1.5.1. Overview

            15.1.5.2. Product Portfolio

            15.1.5.3. Profitability by Market Segments

            15.1.5.4. Sales Footprint

            15.1.5.5. Strategy Overview

                15.1.5.5.1. Marketing Strategy

                15.1.5.5.2. Product Strategy

                15.1.5.5.3. Channel Strategy

        15.1.6. Amano Enzymes

            15.1.6.1. Overview

            15.1.6.2. Product Portfolio

            15.1.6.3. Profitability by Market Segments

            15.1.6.4. Sales Footprint

            15.1.6.5. Strategy Overview

                15.1.6.5.1. Marketing Strategy

                15.1.6.5.2. Product Strategy

                15.1.6.5.3. Channel Strategy

        15.1.7. Stern Enzyme

            15.1.7.1. Overview

            15.1.7.2. Product Portfolio

            15.1.7.3. Profitability by Market Segments

            15.1.7.4. Sales Footprint

            15.1.7.5. Strategy Overview

                15.1.7.5.1. Marketing Strategy

                15.1.7.5.2. Product Strategy

                15.1.7.5.3. Channel Strategy

        15.1.8. Dyadic International Inc.

            15.1.8.1. Overview

            15.1.8.2. Product Portfolio

            15.1.8.3. Profitability by Market Segments

            15.1.8.4. Sales Footprint

            15.1.8.5. Strategy Overview

                15.1.8.5.1. Marketing Strategy

                15.1.8.5.2. Product Strategy

                15.1.8.5.3. Channel Strategy

        15.1.9. Cargill Inc.

            15.1.9.1. Overview

            15.1.9.2. Product Portfolio

            15.1.9.3. Profitability by Market Segments

            15.1.9.4. Sales Footprint

            15.1.9.5. Strategy Overview

                15.1.9.5.1. Marketing Strategy

                15.1.9.5.2. Product Strategy

                15.1.9.5.3. Channel Strategy

        15.1.10. AAK AB

            15.1.10.1. Overview

            15.1.10.2. Product Portfolio

            15.1.10.3. Profitability by Market Segments

            15.1.10.4. Sales Footprint

            15.1.10.5. Strategy Overview

                15.1.10.5.1. Marketing Strategy

                15.1.10.5.2. Product Strategy

                15.1.10.5.3. Channel Strategy

16. Assumptions & Acronyms Used

17. Research Methodology

Don't pay for what you don't need

Customize your report by selecting specific countries or regions and save 30%!

List of Tables

Table 01: Global Market Value (US$ Million) Forecast by Region, 2016 to 2032

Table 02: Global Market Volume (Tons) Forecast by Region, 2016 to 2032

Table 03: Global Market Value (US$ Million) Forecast by Type, 2016 to 2032

Table 04: Global Market Volume (Tons) Forecast by Type, 2016 to 2032

Table 05: Global Market Value (US$ Million) Forecast by End Users, 2016 to 2032

Table 06: Global Market Volume (Tons) Forecast by End Users, 2016 to 2032

Table 07: North America Market Value (US$ Million) Forecast by Country, 2016 to 2032

Table 08: North America Market Volume (Tons) Forecast by Country, 2016 to 2032

Table 09: North America Market Value (US$ Million) Forecast by Type, 2016 to 2032

Table 10: North America Market Volume (Tons) Forecast by Type, 2016 to 2032

Table 11: North America Market Value (US$ Million) Forecast by End Users, 2016 to 2032

Table 12: North America Market Volume (Tons) Forecast by End Users, 2016 to 2032

Table 13: Latin America Market Value (US$ Million) Forecast by Country, 2016 to 2032

Table 14: Latin America Market Volume (Tons) Forecast by Country, 2016 to 2032

Table 15: Latin America Market Value (US$ Million) Forecast by Type, 2016 to 2032

Table 16: Latin America Market Volume (Tons) Forecast by Type, 2016 to 2032

Table 17: Latin America Market Value (US$ Million) Forecast by End Users, 2016 to 2032

Table 18: Latin America Market Volume (Tons) Forecast by End Users, 2016 to 2032

Table 19: Europe Market Value (US$ Million) Forecast by Country, 2016 to 2032

Table 20: Europe Market Volume (Tons) Forecast by Country, 2016 to 2032

Table 21: Europe Market Value (US$ Million) Forecast by Type, 2016 to 2032

Table 22: Europe Market Volume (Tons) Forecast by Type, 2016 to 2032

Table 23: Europe Market Value (US$ Million) Forecast by End Users, 2016 to 2032

Table 24: Europe Market Volume (Tons) Forecast by End Users, 2016 to 2032

Table 25: Asia Pacific Market Value (US$ Million) Forecast by Country, 2016 to 2032

Table 26: Asia Pacific Market Volume (Tons) Forecast by Country, 2016 to 2032

Table 27: Asia Pacific Market Value (US$ Million) Forecast by Type, 2016 to 2032

Table 28: Asia Pacific Market Volume (Tons) Forecast by Type, 2016 to 2032

Table 29: Asia Pacific Market Value (US$ Million) Forecast by End Users, 2016 to 2032

Table 30: Asia Pacific Market Volume (Tons) Forecast by End Users, 2016 to 2032

Table 31: Middle East and Africa Market Value (US$ Million) Forecast by Country, 2016 to 2032

Table 32: Middle East and Africa Market Volume (Tons) Forecast by Country, 2016 to 2032

Table 33: Middle East and Africa Market Value (US$ Million) Forecast by Type, 2016 to 2032

Table 34: Middle East and Africa Market Volume (Tons) Forecast by Type, 2016 to 2032

Table 35: Middle East and Africa Market Value (US$ Million) Forecast by End Users, 2016 to 2032

Table 36: Middle East and Africa Market Volume (Tons) Forecast by End Users, 2016 to 2032
Nandini Roy Choudhury

Principal Consultant

Talk to Analyst

Find your sweet spots for generating winning opportunities in this market.

List of Charts

Figure 01: Global Market Value (US$ Million) by Type, 2022 to 2032

Figure 02: Global Market Value (US$ Million) by End Users, 2022 to 2032

Figure 03: Global Market Value (US$ Million) by Region, 2022 to 2032

Figure 04: Global Market Value (US$ Million) Analysis by Region, 2016 to 2032

Figure 05: Global Market Volume (Tons) Analysis by Region, 2016 to 2032

Figure 06: Global Market Value Share (%) and BPS Analysis by Region, 2022 to 2032

Figure 07: Global Market Y-o-Y Growth (%) Projections by Region, 2022 to 2032

Figure 08: Global Market Value (US$ Million) Analysis by Type, 2016 to 2032

Figure 09: Global Market Volume (Tons) Analysis by Type, 2016 to 2032

Figure 10: Global Market Value Share (%) and BPS Analysis by Type, 2022 to 2032

Figure 11: Global Market Y-o-Y Growth (%) Projections by Type, 2022 to 2032

Figure 12: Global Market Value (US$ Million) Analysis by End Users, 2016 to 2032

Figure 13: Global Market Volume (Tons) Analysis by End Users, 2016 to 2032

Figure 14: Global Market Value Share (%) and BPS Analysis by End Users, 2022 to 2032

Figure 15: Global Market Y-o-Y Growth (%) Projections by End Users, 2022 to 2032

Figure 16: Global Market Attractiveness by Type, 2022 to 2032

Figure 17: Global Market Attractiveness by End Users, 2022 to 2032

Figure 18: Global Market Attractiveness by Region, 2022 to 2032

Figure 19: North America Market Value (US$ Million) by Type, 2022 to 2032

Figure 20: North America Market Value (US$ Million) by End Users, 2022 to 2032

Figure 21: North America Market Value (US$ Million) by Country, 2022 to 2032

Figure 22: North America Market Value (US$ Million) Analysis by Country, 2016 to 2032

Figure 23: North America Market Volume (Tons) Analysis by Country, 2016 to 2032

Figure 24: North America Market Value Share (%) and BPS Analysis by Country, 2022 to 2032

Figure 25: North America Market Y-o-Y Growth (%) Projections by Country, 2022 to 2032

Figure 26: North America Market Value (US$ Million) Analysis by Type, 2016 to 2032

Figure 27: North America Market Volume (Tons) Analysis by Type, 2016 to 2032

Figure 28: North America Market Value Share (%) and BPS Analysis by Type, 2022 to 2032

Figure 29: North America Market Y-o-Y Growth (%) Projections by Type, 2022 to 2032

Figure 30: North America Market Value (US$ Million) Analysis by End Users, 2016 to 2032

Figure 31: North America Market Volume (Tons) Analysis by End Users, 2016 to 2032

Figure 32: North America Market Value Share (%) and BPS Analysis by End Users, 2022 to 2032

Figure 33: North America Market Y-o-Y Growth (%) Projections by End Users, 2022 to 2032

Figure 34: North America Market Attractiveness by Type, 2022 to 2032

Figure 35: North America Market Attractiveness by End Users, 2022 to 2032

Figure 36: North America Market Attractiveness by Country, 2022 to 2032

Figure 37: Latin America Market Value (US$ Million) by Type, 2022 to 2032

Figure 38: Latin America Market Value (US$ Million) by End Users, 2022 to 2032

Figure 39: Latin America Market Value (US$ Million) by Country, 2022 to 2032

Figure 40: Latin America Market Value (US$ Million) Analysis by Country, 2016 to 2032

Figure 41: Latin America Market Volume (Tons) Analysis by Country, 2016 to 2032

Figure 42: Latin America Market Value Share (%) and BPS Analysis by Country, 2022 to 2032

Figure 43: Latin America Market Y-o-Y Growth (%) Projections by Country, 2022 to 2032

Figure 44: Latin America Market Value (US$ Million) Analysis by Type, 2016 to 2032

Figure 45: Latin America Market Volume (Tons) Analysis by Type, 2016 to 2032

Figure 46: Latin America Market Value Share (%) and BPS Analysis by Type, 2022 to 2032

Figure 47: Latin America Market Y-o-Y Growth (%) Projections by Type, 2022 to 2032

Figure 48: Latin America Market Value (US$ Million) Analysis by End Users, 2016 to 2032

Figure 49: Latin America Market Volume (Tons) Analysis by End Users, 2016 to 2032

Figure 50: Latin America Market Value Share (%) and BPS Analysis by End Users, 2022 to 2032

Figure 51: Latin America Market Y-o-Y Growth (%) Projections by End Users, 2022 to 2032

Figure 52: Latin America Market Attractiveness by Type, 2022 to 2032

Figure 53: Latin America Market Attractiveness by End Users, 2022 to 2032

Figure 54: Latin America Market Attractiveness by Country, 2022 to 2032

Figure 55: Europe Market Value (US$ Million) by Type, 2022 to 2032

Figure 56: Europe Market Value (US$ Million) by End Users, 2022 to 2032

Figure 57: Europe Market Value (US$ Million) by Country, 2022 to 2032

Figure 58: Europe Market Value (US$ Million) Analysis by Country, 2016 to 2032

Figure 59: Europe Market Volume (Tons) Analysis by Country, 2016 to 2032

Figure 60: Europe Market Value Share (%) and BPS Analysis by Country, 2022 to 2032

Figure 61: Europe Market Y-o-Y Growth (%) Projections by Country, 2022 to 2032

Figure 62: Europe Market Value (US$ Million) Analysis by Type, 2016 to 2032

Figure 63: Europe Market Volume (Tons) Analysis by Type, 2016 to 2032

Figure 64: Europe Market Value Share (%) and BPS Analysis by Type, 2022 to 2032

Figure 65: Europe Market Y-o-Y Growth (%) Projections by Type, 2022 to 2032

Figure 66: Europe Market Value (US$ Million) Analysis by End Users, 2016 to 2032

Figure 67: Europe Market Volume (Tons) Analysis by End Users, 2016 to 2032

Figure 68: Europe Market Value Share (%) and BPS Analysis by End Users, 2022 to 2032

Figure 69: Europe Market Y-o-Y Growth (%) Projections by End Users, 2022 to 2032

Figure 70: Europe Market Attractiveness by Type, 2022 to 2032

Figure 71: Europe Market Attractiveness by End Users, 2022 to 2032

Figure 72: Europe Market Attractiveness by Country, 2022 to 2032

Figure 73: Asia Pacific Market Value (US$ Million) by Type, 2022 to 2032

Figure 74: Asia Pacific Market Value (US$ Million) by End Users, 2022 to 2032

Figure 75: Asia Pacific Market Value (US$ Million) by Country, 2022 to 2032

Figure 76: Asia Pacific Market Value (US$ Million) Analysis by Country, 2016 to 2032

Figure 77: Asia Pacific Market Volume (Tons) Analysis by Country, 2016 to 2032

Figure 78: Asia Pacific Market Value Share (%) and BPS Analysis by Country, 2022 to 2032

Figure 79: Asia Pacific Market Y-o-Y Growth (%) Projections by Country, 2022 to 2032

Figure 80: Asia Pacific Market Value (US$ Million) Analysis by Type, 2016 to 2032

Figure 81: Asia Pacific Market Volume (Tons) Analysis by Type, 2016 to 2032

Figure 82: Asia Pacific Market Value Share (%) and BPS Analysis by Type, 2022 to 2032

Figure 83: Asia Pacific Market Y-o-Y Growth (%) Projections by Type, 2022 to 2032

Figure 84: Asia Pacific Market Value (US$ Million) Analysis by End Users, 2016 to 2032

Figure 85: Asia Pacific Market Volume (Tons) Analysis by End Users, 2016 to 2032

Figure 86: Asia Pacific Market Value Share (%) and BPS Analysis by End Users, 2022 to 2032

Figure 87: Asia Pacific Market Y-o-Y Growth (%) Projections by End Users, 2022 to 2032

Figure 88: Asia Pacific Market Attractiveness by Type, 2022 to 2032

Figure 89: Asia Pacific Market Attractiveness by End Users, 2022 to 2032

Figure 90: Asia Pacific Market Attractiveness by Country, 2022 to 2032

Figure 91: Middle East and Africa Market Value (US$ Million) by Type, 2022 to 2032

Figure 92: Middle East and Africa Market Value (US$ Million) by End Users, 2022 to 2032

Figure 93: Middle East and Africa Market Value (US$ Million) by Country, 2022 to 2032

Figure 94: Middle East and Africa Market Value (US$ Million) Analysis by Country, 2016 to 2032

Figure 95: Middle East and Africa Market Volume (Tons) Analysis by Country, 2016 to 2032

Figure 96: Middle East and Africa Market Value Share (%) and BPS Analysis by Country, 2022 to 2032

Figure 97: Middle East and Africa Market Y-o-Y Growth (%) Projections by Country, 2022 to 2032

Figure 98: Middle East and Africa Market Value (US$ Million) Analysis by Type, 2016 to 2032

Figure 99: Middle East and Africa Market Volume (Tons) Analysis by Type, 2016 to 2032

Figure 100: Middle East and Africa Market Value Share (%) and BPS Analysis by Type, 2022 to 2032

Figure 101: Middle East and Africa Market Y-o-Y Growth (%) Projections by Type, 2022 to 2032

Figure 102: Middle East and Africa Market Value (US$ Million) Analysis by End Users, 2016 to 2032

Figure 103: Middle East and Africa Market Volume (Tons) Analysis by End Users, 2016 to 2032

Figure 104: Middle East and Africa Market Value Share (%) and BPS Analysis by End Users, 2022 to 2032

Figure 105: Middle East and Africa Market Y-o-Y Growth (%) Projections by End Users, 2022 to 2032

Figure 106: Middle East and Africa Market Attractiveness by Type, 2022 to 2032

Figure 107: Middle East and Africa Market Attractiveness by End Users, 2022 to 2032

Figure 108: Middle East and Africa Market Attractiveness by Country, 2022 to 2032

Recommendations

Food and Beverage

Activated Cake Emulsifier Market

Published : April 2023

Food and Beverage

No-fat Cake Market

Published : March 2023

Explore Food and Beverage Insights

View Reports